Analysis: companies
Measuring progress to zero deforestation
January 2015
To ensure deforestation free
supply chains, companies
need to adopt and implement
timebound and measurable
policies for forest risk
About the Forest 500:
The Forest 500 project identifies, ranks, and tracks the governments, companies and financial institutions that together could virtually eradicate tropical deforestation from global commodity supply chains. It measures progress towards ambitious zero deforestation goals by assessing the public policies of these key powerbrokers.
Contact:
To contact the Forest 500 team, please write to [email protected]
Citation:
Please cite this publication as:
Rautner, M., Lawrence, L., Bregman, T., and Leggett, M. 2015. The Forest 500. Global Canopy Programme.
About the Global Canopy Programme: The Global Canopy Programme (GCP) is a tropical forest think tank working to demonstrate the scientific, political and
that underpins water, food, energy, health and climate security for all. GCP works through its international networks – of forest communities, science experts, policymakers, and finance and corporate leaders – to gather evidence, spark insight, and catalyse action to halt forest loss and improve human livelihoods dependent on forests.
Disclaimer:
The contents of this report may be used by anyone providing acknowledgement is given to the Global Canopy Programme. No representation or warranty (express or implied) is given by the Global Canopy Programme or any of its contributors as to the accuracy or completeness of
the information and opinions contained in this report.
‘The Global Canopy Programme’ the activities of which are hosted by The Global Canopy Foundation, a United
Kingdom charitable company limited by guarantee, charity
Contents
Key observations
1
Overview and categorisation
1
Overview of scores
2
Zero deforestation policies
3
Supply chain segment and industry sector
4
Location of headquarters
6
Company type and revenue
8
Commodity-specific policies
10
1
This is an introductory and high level analysis of how the different companies included in the Forest 500 score in relation to their development and adoption of policies for forest risk commodities. In the future, the Forest 500 platform aims to expand on this to include interactive graphs that will allow visitors to carry out their own analyses of critical issues.
Key observations
A number of key observations can be made when analysing how companies score in relation to specific forest risk commodity policy indicators.
As a group, the 250 companies included in the Forest 500 are currently falling short of adopting the policies
needed to ensure a speedy transition to a zero deforestation economy. Some companies are performing remarkably well, achieving close to and in some cases over 90% of the possible score. However, at 29 out of 100, the average score raises concerns about the progress being made by key corporate powerbrokers in removing deforestation from commodity supply chains.
Only 7% of all companies included in the Forest 500 have been found to have an overall zero or net zero
deforestation policy. Of these, two thirds are members of the Consumer Goods Forum (CGF).
CGF members clearly lead the way globally when it comes to adopting corporate policies to reduce
deforestation. Yet, for the CGF to achieve its stated goal of net zero deforestation by 2020, policies need to be adopted and implemented urgently by a much larger share of CGF members. Only one fifth of 50 CGF
members assessed within the Forest 500 have overall zero or net zero deforestation policies. In addition, CGF member companies based in the Asia-Pacific region are shown to be inhibiting progress and need to engage urgently in developing effective policies.
In terms of sectors, the home care manufacturing, and personal care and cosmetics industries are shown to
perform best, while the animal feed industry lags behind other sectors.
In total, companies headquartered in 42 countries have been included in the Forest 500, with the US holding
the largest individual share of corporate headquarters, with one fifth of all companies.
The location of company headquarters is found to be a key differentiator for policy strength, with the best
scoring companies headquartered in North America, slightly outperforming those based in Europe and Latin America. Companies in the Asia-Pacific region achieve much lower scores, reaching only a third of those of companies based in North America.
The best scoring companies are headquartered in the UK, Switzerland and Germany, followed by the US and
France. Companies headquartered in other critical forest risk commodity processing and importing countries, such as China and India are scoring well below the average, with Russian companies at the bottom of the table.
Companies with higher revenues achieve considerably higher scores than those with lower revenues. In
particular, once companies surpass annual revenue thresholds of US$10 billion, policy scores increase sharply, averaging almost double those of companies below that value.
Companies listed on stock exchanges score more than 50% higher than privately owned companies and those
with other governance structures. This suggests that the higher scrutiny associated with requirements for public reporting and responsibility towards larger groups of shareholders leads to stronger policies. State-owned companies are found to be performing particularly poorly. However, most of these are located in in Asia, particularly in China, where low scores already prevail.
Overview and categorisation
Companies have been assessed for their sustainability policies and assigned scores in relation to different forest risk commodity policy indicators. In order to analyse the scores achieved by companies for these different policy indicators, various data points have been collected for each company. This includes information on revenue, headquarter location, governance structure, and membership of various sustainability initiatives. In addition to this, companies have been assigned segments relative to their role within supply chains (producer, processor, trader, manufacturer and retailer), with those companies with vertically integrated operations assigned multiple supply chain segments. Similarly, companies have been categorised into 20 industry sectors in relation to their operations, with companies active in multiple industries also listed under multiple sectors.
Companies have been assessed against up to 33 indicators within four overarching categories: overall forest policy; commodity policies; operations; and reporting and transparency. Companies have been scored based on their publicly available policies and information and could achieve a total of 100 points. Figure 1 shows the weighting of points
between individual indicator categories. Further details of the scoring process can be found in the Scoring methodology
in the Methodology section of the Forest 500 platform. Results of individual company assessments can be found in the
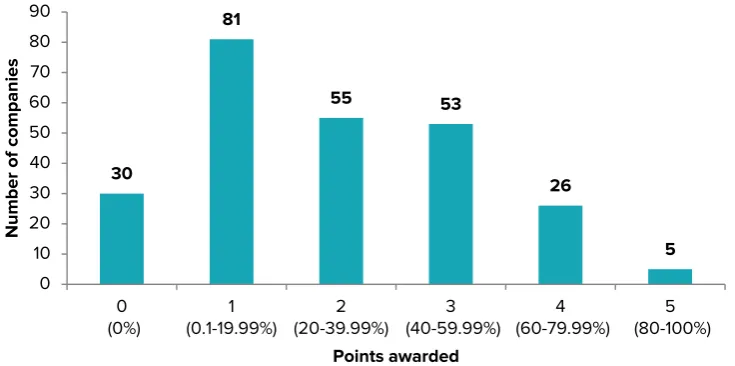
Companies section of the Forest 500 platform, where ultimately each company has been awarded between zero and five points for each 20 per cent increase out of the maximum 100 points. For the analysis in this report, scores out of
100 have been used unless noted otherwise.
Figure 1. Breakdown of scores showing the relative weighting of points between the four indicator categories.
Overview of scores
The variation in company scores shows that the most advanced actors are able to obtain the maximum five points for their individual assessments. However, with just six of the 250 companies included in the Forest 500 in the top band of scores, and the average score for individual assessments at just 29 out 100 (translating into just 2 out of 5 points), there is clearly much room for progress.
Figure 2: Distribution of scores
3
Zero deforestation policies
There is growing momentum in the corporate sector towards removing deforestation from supply chains. The last few years has seen a number of companies adopt zero or net zero deforestation commitments and initiate the
implementation of policies to reduce their impacts on forests. This is a welcome step in addressing global tropical forest loss. Overall zero deforestation policies go beyond initial commitments and apply to all forest risk commodities,
including those likely to become increasingly prominent in the context of global trade and deforestation. Despite the current lack of an internationally agreed definition of zero and net zero deforestation, such policies are symbols of corporate ambition to ensure deforestation free supply chains into the future.
With zero or net zero deforestation supply chains being an explicit goal of many stakeholder initiatives aiming to
address the impact of commodity supply chains on forests, including the Consumer Goods Forum (CGF)1 and the New
York Declaration on Forests2, it is important to measure progress being made in this area.
Recent developments have been especially encouraging since it is often companies with dominant market shares that are leading the way with progressive policies. Policies adopted by such companies cover large volumes of the global trade in forest risk commodities and can have positive knock on effects throughout the supply chain. This allows for progress towards zero deforestation to be made even in the absence of the adoption of policies by large numbers of companies. Having said this, to ensure a comprehensive transition to deforestation free supply chains and to avoid leakage of unsustainable commodities to less consumer-aware markets, it is vital that all actors along the supply chain adopt and implement policies to remove deforestation from their operations.
It is important to highlight that, in the context of this research, companies have only been recognised as having adopted overall zero or net zero deforestation policies if these policies apply to all commodities, rather than to specific
commodities within company portfolios, and are identified clearly within their own communication tools; primarily on their own websites. Referring to membership of sustainability organisations and initiatives with similar goals without explicit statements that indicate the adoption of such commitments by the companies themselves has been interpreted as insufficient for companies to be awarded the relevant points.
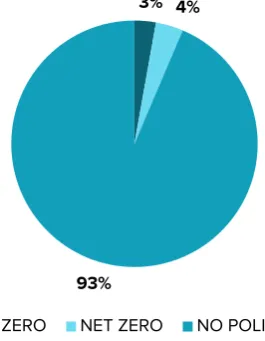
Despite a number of high profile announcements in 2014, overall, it is clear that the corporate community has
significantly more progress to make in the implementation of policies to remove deforestation from supply chains. Only 7% of companies within the Forest 500 have adopted overall zero or net zero deforestation policies, with most of these companies positioned towards the consumption end of supply chains (i.e. manufacturers and retailers).
Figure 3: Percentage of companies with overall deforestation policies.
1 The Consumer Goods Forum. 2014. Achieving zero net deforestation. Sustainability Pillar. [Online] Available from:
http://www.theconsumergoodsforum.com/strategic-focus/sustainability/our-sustainability-pillar [Accessed January 2015]
2 UN Climate Summit. 2014. New York Declaration on Forests. Action Statements and Action Plans. September 2014. [Online]
Available from: http://www.un.org/climatechange/summit/wp-content/uploads/sites/2/2014/09/FORESTS-New-York-Declaration-on-Forests.pdf [Accessed January 2015]
3% 4%
93%
Supply chain segment and industry sector
Supply chain segments
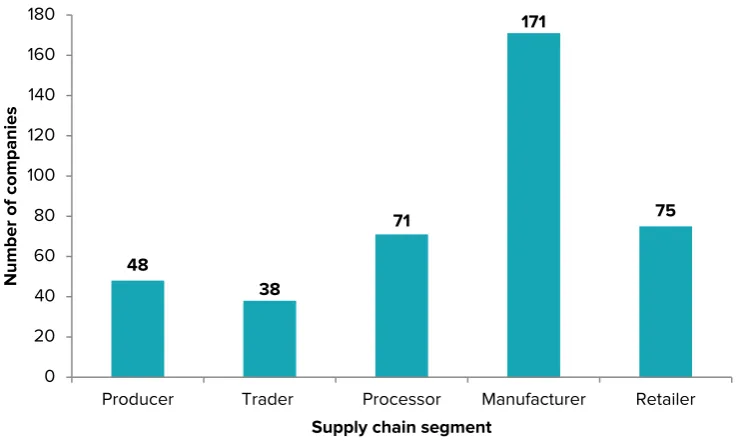
When analysing the scores of corporate actors relative to the stage of their operations in the supply chain, it is important to remember that many companies are vertically integrated and operate across multiple supply chain segments (on average companies have been assigned 1.6 supply chain segments). Within the Forest 500, the largest share of companies are categorised as manufacturers, with retailers and processors being assigned to half as many companies. This, along with the lower number of traders and producers amongst the Forest 500 companies, is unsurprising and largely follows the logic where market concentration is particularly pronounced at the early and late stages of supply chains.
Figure 4: Supply chain segment distribution
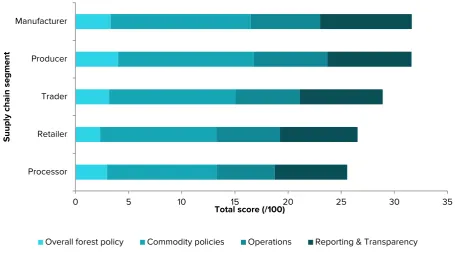
Analysis of scores against supply chain segment reveals that producers and manufacturers achieve the highest total scores (average 32 out of 100). Companies acting at different supply chain stages achieve lower average scores, with processors, for example, achieving the lowest (average 27 out of 100). This relatively small variation is likely to be explained by the listing of some companies under multiple supply chain segments.
The higher average scores achieved by producers and manufacturers can be explained by a number of possible factors. It is arguably easier for producers to implement policies to reduce their impacts on tropical forests. Given their position right at the source of the supply chain, producers do not require large numbers of suppliers to adhere to their policies or complex traceability systems tracking deforestation to ensure reduced deforestation. Conversely, although at a later stage in the supply chain, manufacturers often make products under well-known, globally recognised brand names that receive much more scrutiny and consumer pressure than most other supply chain actors. This heightened consumer pressure often makes them leaders when it comes to the development of progressive policies. As is the case for other analyses of company policy scores, generally there is consistency across scores in the different indicator categories, with companies scoring well overall also scoring well across indicators for overall forest policies, commodity policies, operations, and reporting and transparency.
48
Producer Trader Processor Manufacturer Retailer
Number of
companies
5
Figure 5. Scores by supply chain segments
Industry sectors
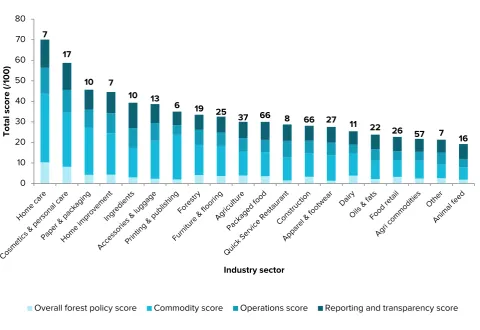
Figure 6 shows the average scores achieved for each industry sector as well as the number of companies within each. Companies have been categorised under 20 industry sectors and in some cases have been listed in multiple categories (on average 1.7 sectors per company, with a maximum of four per company possible). For indicators of commodity policies, companies have been assessed in relation to their policies for each specific commodity of relevance to their operations. This means that companies exposed to more forest risk commodities have a higher burden regarding their scores in the commodity policy indicator category.
Despite these qualifications, it is clear that the Forest 500 companies in the home care and personal care and cosmetics industries achieve the highest total scores on average. This could be explained by their relatively low exposure to forest risk commodities, on average having been assessed for policies for just 2.1 commodities. However this does not apply to other industry sectors exposed to relatively few commodities, with the printing and publishing sector (assessed on average for 1.3 commodities), and the construction or apparel and footwear sectors (assessed on average for 2.2 commodities) each scoring much lower despite being exposed to fewer or a similar number of commodities.
Companies in the food retail sector have been assessed for the largest number of commodity policies (on average for 4.2 commodities) due to their exposure to a larger number of forest risk commodities through the diversity of products they sell. This, together with the sector’s inclusion of a significant number of players operating in countries with traditionally low scores, is one explanation for its relatively low ranking. Finally, representatives from the animal feed industry score the lowest, with average scores of less than a quarter of those companies in the home care sector.
0 5 10 15 20 25 30 35
Processor Retailer Trader Producer Manufacturer
Total score (/100)
Suuply chain
segment
Figure 6: Scores by industry sector
Numbers above bars represent number of companies in each industry sector.
Location of headquarters
Nearly all of the companies included in this research are large corporations with international operations and average revenues in excess of more than US$5 billion. While headquarter (HQ) location is therefore not necessarily
representative of the actual location of company operations, it nonetheless provides an acceptable indicator of corporate culture since organisation-wide sustainability policies are usually developed in a company’s corporate headquarters. In total, companies from 42 different countries are included in the Forest 500. The US, China and Japan have the largest shares of individual companies, although, when considered as a block, the number of companies in Europe exceeds the number of those in the US.
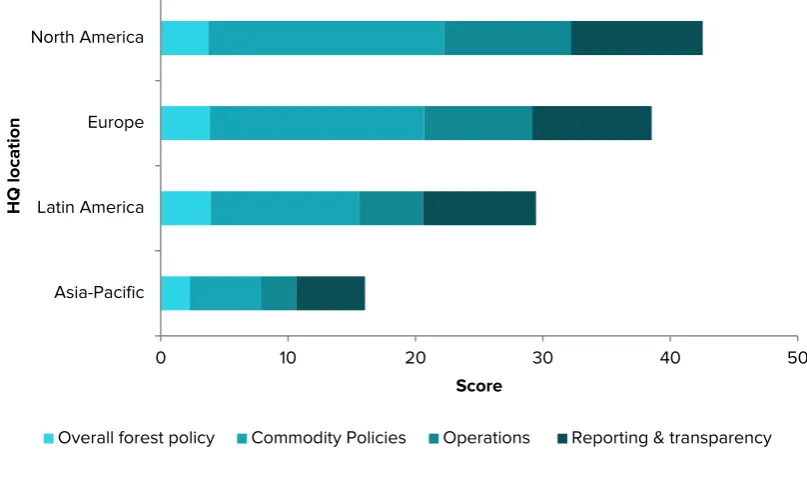
Figure 7 depicts the average scores of companies relative to the location of their corporate headquarters by continent (note: Africa is not included due to the small number of companies based in Africa in the Forest 500). It is noticeable that overall, companies score higher for indicators in the reporting and transparency, and operations categories, but much lower for indicators of their specific commodity and overall forest policies. The results show that companies based in North America score best across all policy areas followed by corporations headquartered in Europe. However, there is a clear drop off in scores for companies located in the Asia-Pacific region, with companies there scoring on average nearly 70% lower than North American companies.
7
7
Figure 7. Scores by HQ location
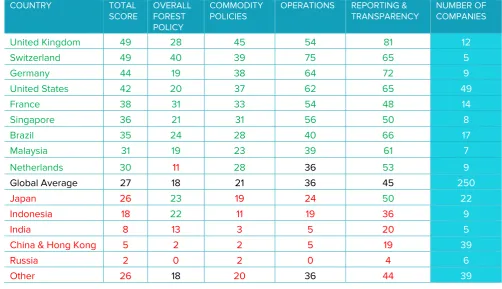
The following table (Table 1) shows the average scores of companies located in specific countries; the top 15 according to the number of company headquarters. Average scores for companies in each country for each indicator category have been converted to a percentage of the maximum possible points and compared to the global average, with those above the global average highlighted in green and those below highlighted in red. It is important to consider that these figures apply only to the 250 companies included in the Forest 500 and while these represent the companies most exposed to forest risk commodities in their sectors and geographies, they are not necessarily representative of the policies of the wider corporate community in each of the countries and sectors as a whole.
While the higher scores of companies based in countries with historically greater awareness of the potential link between commodity supply chains and deforestation may not be surprising, the scale of discrepancies in scores is significant. The low scores achieved by companies headquartered in China and Hong Kong are particularly striking considering the jurisdiction’s importance as the single largest individual importer of forest risk commodities. More unexpected is that those companies included in the Forest 500 headquartered in countries including Brazil, Singapore and Malaysia, achieve similar and sometimes higher average scores than those governed in countries such as France and the Netherlands. Russian companies achieve the lowest scores, with the results demonstrating that sustainability in relation to forest risk commodities is largely yet to enter into discussion in the country. At this point, it is important to highlight that companies have been assessed in the original language in which they operate. In addition this, it has been found that overall communication and transparency, both related to sustainability aspects and wider company information, for companies in countries such as China and Russia has been found to be more limited than elsewhere. Companies based in the UK score highest on average, however it is noticeable that whilst they clearly score well for reporting and transparency, and for their specific commodity policies, their overall forest policies lag behind Swiss companies, who score highest in this area. The overall forest policy and total scores of Dutch companies are also noticeably low. This is perhaps explained by the large number of animal feed companies based in the Netherlands and included in the Forest 500. Having said this, the low scores achieved by these companies is surprising given the
representation of the animal feed industry in the Dutch Task Force for Sustainable Soy, which aims for 100%
responsible soya imports into the Netherlands by 2015. Considering high overall awareness of the impacts of
commodity supply chains in the Netherlands, a wider sample of companies would likely result in generally higher scores for Dutch companies.
With the average total score of companies headquartered in each country not exceeding the 50% mark, it is clear that even in the most developed consumer markets, there is much room for improvement and urgent progress is needed to remove deforestation from supply chains.
Table 1: Scores by location of headquarters
Comparison of average country-based scores (HQs) against the global average – green indicates above average, red below average, and black equal to the average. Scores have been adjusted so that all scores for each policy area are out of 100. Countries with less than 5 companies in the Forest 500 have not been listed individually and are covered under “other”.
COUNTRY TOTAL
Company type and revenue
Company type
Scores, and the associated strength of forest related sustainability policies, has been found to vary according to the type of company ownership. The most striking difference, especially considering the varying sample size for each company type, is seen between the average scores of privately owned companies and those listed on stock
9
Figure 8. Scores by company type
Numbers next to bars represent number of companies under each ownership type.
Revenue
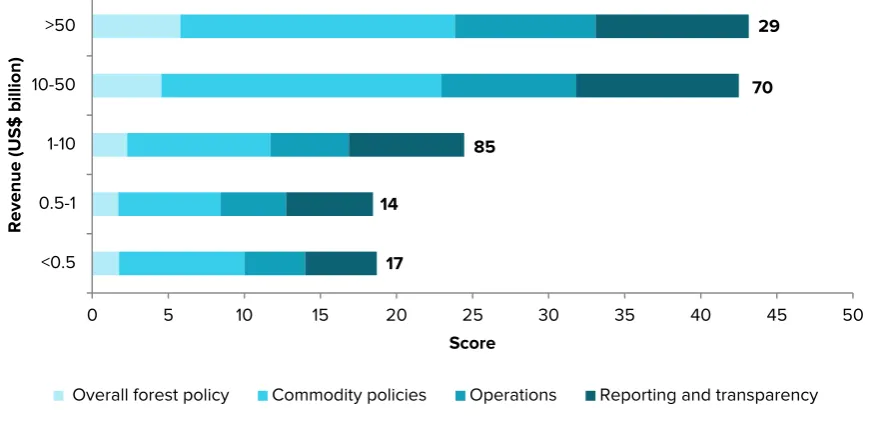
There is a clear correlation between company size in terms of revenue and the development of sustainability policies. Companies with revenues of less than US$1 billion tend to score lower, with a notable increase in scores achieved by companies that post revenues of between US$1 billion and US$10 billion. The US$10 billion revenue threshold appears significant, with companies with revenues above this level achieving scores more than double that of those with revenues of less than US$1 billion. However, it is worth highlighting that the largest companies included, with revenues of more than US$50 billion, do not score significantly higher than those with revenues of $ 10-50 billion. Similarly, there is little difference between the scores of companies with revenues of US$0.5 - 1 billion and those with revenues of less than US$0.5 billion.
Figure 9: Scores by revenue
Numbers next to bars represent number of companies in each revenue category.
5
Overall forest policy Commodity policies Operations Reporting and transparency
17
Commodity-specific policies
Analysing the percentage of companies with commodity-specific policies and the relative strength of these policies reveals some patterns in the prevalence of policies related to different forest risk commodities. More companies exposed to the timber and palm oil supply chains are shown to have commitments than those with operations in the soya, beef and leather industries. Strikingly, less than 20% of companies involved in the soya supply chain have been found to have specific sustainable soya sourcing policies, while only 26% of companies involved in the supply chains of beef and leather have been found to have specific commodity policies. Conversely, 59% and 62% of companies acting in the palm oil and timber supply chains respectively have been found to have commodity-specific policies.
Figure 10. Percentage of companies with commodity-specific policies across the five commodity supply chains.
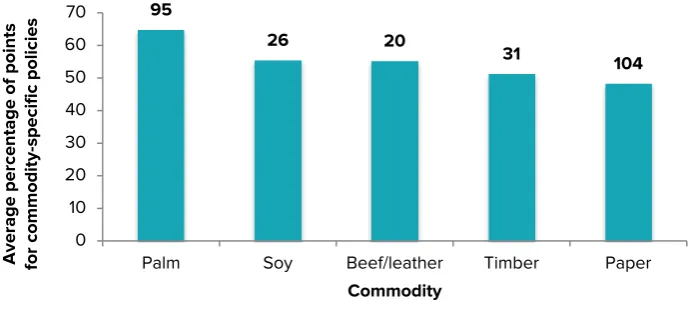
Despite differences in the number of commodity-specific policies across companies active in different supply chains, the analysis shows that there is little variation in the average scores awarded for each type of commodity-specific policy. Of the companies with specific palm oil policies, the average percentage score was 64.8% while the average percentage score for paper was 48.3%. Furthermore, the 26 companies with a sustainable soya sourcing policy scored on average 55.5% of the points available, and the 31 companies with a sustainable timber policy scored on average 51.3%.
Figure 11. Average percentage of points awarded to companies for their commodity-specific policies across the five commodity supply chains.
Numbers above bars represent the number of companies with commodity-specific policies for each of the commodities.
Taken together, these results suggest that although the number of companies with commodity-specific policies varies between the different supply chains, where companies do have policies, they tend to score similarly regardless of the supply chain in which they operate.
0
Palm Soy Beef/leather Timber Paper
Companies with
Palm Soy Beef/leather Timber Paper
Average percentage of
points
for commodity-specific
policies
11
The impact of the Consumer Goods Forum
In recent years a number of companies have taken a more unified approach to addressing deforestation associated with commodity production through collective commitments to reducing forest loss. The two most important of these
initiatives with clearly established goals are the Consumer Goods Forum (CGF) and the New York Declaration on
Forests (NY Declaration). The CGF is a coalition of around 400 companies and other stakeholders in 70 countries, collectively employing around 10 million people and selling goods and services worth more than US$3 trillion. One of the key sustainability goals of the CGF is for its members to mobilise their resources to achieve net zero deforestation by 2020, removing deforestation from supply chains. Within the Forest 500, 50 companies are CGF members. The NY Declaration is a non-legally binding political declaration, initiated at the UN Climate Summit in 2014. It is supported by a number of corporations, national and sub-national governments, NGOs and indigenous peoples’ organisations. Endorsers of the declaration have committed collectively to halve the rate of loss of natural forests globally by 2020, strive to end it by 2030 and specifically, remove deforestation from agricultural supply chains by 2020. Within the Forest 500, 17 companies have endorsed the NY Declaration.
For this analysis, the focus is on CGF members since all but five of the corporate signatories to the New York
Declaration are also CGF members. Within the Forest 500, the CGF members are headquartered in 15 countries with a near equal split of companies located in Europe, North America and the Asia-Pacific region. The US contains the largest share of CGF companies included with 17, followed by Japan with nine and France with five. The progress that members of the CGF and signatories to the NY declaration make towards achieving their goal is a critical measure of progress towards a zero deforestation economy.
CGF vs non CGF members
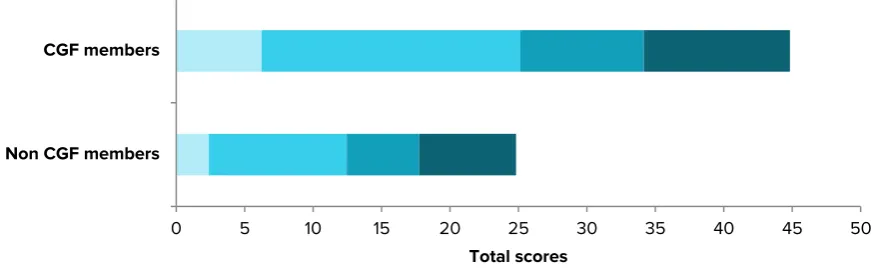
When comparing the overall scores of CGF members globally, it is clear that these companies do indeed achieve higher scores than non-CGF members. Overall, CGF members achieve nearly twice the total scores of non-members and when it comes to the adoption of zero or net zero deforestation policies, companies that are part of the CGF score on
average 80% higher than companies that are not part of the initiative, suggesting significant progress is being made. In addition, more than two thirds of the 250 companies that have been identified as having overall zero or net zero deforestation policies are CGF members. However, this also means that of the CGF members included only about one fifth have adopted such policies.
The largest differentiation between CGF and non-CGF members occurs in the area of the overall forest polices where CGF members score 2.5 times higher than non-CGF members. When it comes to indicators of reporting and
transparency, the difference is much less pronounced, with CGF members scoring 1.5 times higher than non-members.
Figure 12: CGF members vs non-CGF members
0 5 10 15 20 25 30 35 40 45 50
Non CGF members CGF members
Total scores
Regional breakdown within the CGF
Comparisons of these scores can be further broken down by looking at the regional performance of CGF members (note: companies based in Latin America and Africa are not included due to the small sample size of each). It is clear that companies based in the Asia-Pacific region have much weaker and fewer policies than their counterparts in North America and Europe. This discrepancy is so pronounced that CGF members based in the Asia-Pacific region score below the global average of non-CGF members in all policy areas, with the exception of the overall forest policy. These figures suggest that while North American and, to a lesser extent, European CGF members are in the process of
adopting policies that put them on the path towards zero or net zero deforestation, more effort is required overall and in particular, it appears that progress of the CGF as a whole is being held back by the performance of its members based in the Asia-Pacific.
Figure 13: CGF member scores by region
It should be pointed out that this analysis only includes a small percentage of the total CGF member companies globally. While the companies included are those with the highest exposure to forest risk commodities, it is predicted that should all CGF members be assessed, scores would drop significantly in all policy areas as many CGF members less exposed to forest risk commodity supply chains are likely to have fewer policies in place. Despite the progress made by CGF members, the data provided by this research suggests that not enough is being done by individual members to adopt zero and net zero deforestation policies; an explicit goal of the organisation as a whole.
0 10 20 30 40 50 60 70
Asia-Pacific Europe North America
Total scores
Region
13
For more information visit: www.forest500.org
Contact us at: [email protected]
Follow us on Twitter: @Forest500
To find out about GCP’s work visit: www.globalcanopy.org