LAMPIRAN 3
IDENTITAS DAN KUESIONER PERILAKU PENCEGAHAN MALARIA DI
KLINIK dr. MARTINI PUJIATMIKA KECAMATAN PANYABUNGAN
KOTA KABUPATEN MANDAILING NATAL
TAHUN 2015
I.
Identitas
1)
Pendidikan Rendah
2)
Pendidikan Tinggi
6.
Pekerjaan:
1)
Bekerja
2)
Tidak Bekerja
7.
Pendapatan
:
1)
< Rp. 1.625.000.-
87
II.
Kuesioner Perilaku Pencegahan Malaria
1.
Apakah saudara/i memiliki kebiasaan menggunakan anti nyamuk?
a.
Ya
b.
Tidak
2.
Apakah saudara/i memiliki kebiasaan menggantung pakaian di dalam rumah?
a.
Ya
b.
Tidak
3.
Apakah saudara/i selalu menggunakan kelambu pada saat tidur?
a.
Ya
b.
Tidak
4.
Apakah saudara/i memiliki kebiasaan keluar rumah di malam hari?
a.
Selalu
LAMPIRAN 4
LEMBAR OBSERVASI LINGKUNGAN FISIK RUMAH RESPONDEN DI
KLINIK dr. MARTINI PUJIATMIKA KECAMATAN PANYABUNGAN
KOTA KABUPATEN MANDAILING NATAL
TAHUN 2015
No Komponen yang diobservasi
Hasil Observasi
1
Apakah terdapat genangan air yang
berpotensi
menjadi
tempat
perindukan
nyamuk
di
dalam
maupun diluar rumah
responden?
a.
Ya
b.
Tidak
2
Jika ya, jenis genangan air seperti
apa yang ditemukan?
a.
Galian
b.
Kubangan
c.
Selokan
d.
Kolam
e.
Sungai
f.
Mata Air
g.
Lainnya ...
2
Apakah terdapat kandang hewan
milik responden?
a.
Ya
b.
Tidak
3
Apakah ventilasi rumah responden
terdapat kawat kasa untuk
menghalangi nyamuk masuk
kedalam rumah responden?
LAMPIRAN 5
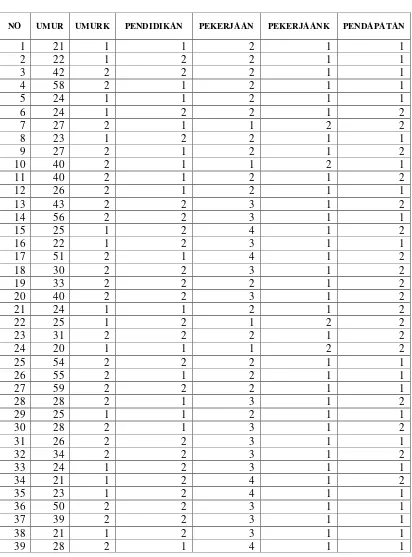
Tabel Master Data Penelitian
NO UMUR UMURK PENDIDIKAN PEKERJAAN PEKERJAANK PENDAPATAN
91
NO UMUR UMURK PENDIDIKAN PEKERJAAN PEKERJAANK PENDAPATAN
LAMPIRAN 6
Output Hasil Penelitian
ANALISIS UNIVARIAT
Frequency Table
Kejadian Malaria
Frequency Percent Valid Percent Cumulative Percent
Valid Positif 107 90.7 90.7 90.7
Kategori Umur
Kategori Umur Responden
Frequency Percent Valid Percent
Cumulative
Percent
Valid < 26 Tahun 50 42.4 42.4 42.4
> = 26 Tahun 68 57.6 57.6 100.0
Total 118 100.0 100.0
Kategori Pendapatan Responden
Frequency Percent Valid Percent Cumulative Percent
Valid <= Rp. 1.650.000,- 60 50.8 50.8 50.8
> Rp. 1.650.000,- 58 49.2 49.2 100.0
Total 118 100.0 100.0
Kategori Pendidikan Responden
40 33,9 33,9 33,9
78 66,1 66,1 100,0
118 100,0 100,0
Pendidikan Rendah Pendidikan Tinggi Total
Valid
Frequency Percent Valid Percent
Cumulative Percent
Kategori Pekerjaan Responden
110 93,2 93,2 93,2
8 6,8 6,8 100,0
118 100,0 100,0
Bekerja Tidak Bekerja Total
Valid
Frequency Percent Valid Percent
Cumulative Percent
Kebiasaan Penggunaan Anti Nyamuk Responden
Frequency Percent Valid Percent Cumulative Percent
Valid Tidak 87 73.7 73.7 73.7
Ya 31 26.3 26.3 100.0
97
Kebiasaan Menggantung Pakaian
Frequency Percent Valid Percent Cumulative Percent
Valid Ya 92 78.0 78.0 78.0
Tidak 26 22.0 22.0 100.0
Total 118 100.0 100.0
Kebiasaan Menggunakan Kelambu Responden
Frequency Percent Valid Percent Cumulative Percent
Valid Tidak 75 63.6 63.6 63.6
Ya 43 36.4 36.4 100.0
Total 118 100.0 100.0
Kebiasaan Keluar Rumah di Malam Hari Responden
Frequency Percent Valid Percent Cumulative Percent
Valid Ya 89 75.4 75.4 75.4
Tidak 29 24.6 24.6 100.0
Total 118 100.0 100.0
Genangan Air Responden
Frequency Percent Valid Percent Cumulative Percent
Valid Ada 104 88.1 88.1 88.1
Tidak ada 14 11.9 11.9 100.0
Jenis Genangan Air Responden
104 100,0 100,0
Galian
Frequency Percent Valid Percent
Cumulative Percent
Kandang Hewan Ternak Responden
Frequency Percent Valid Percent Cumulative Percent
Valid Ada 92 78.0 78.0 78.0
Tidak ada 26 22.0 22.0 100.0
Total 118 100.0 100.0
Penggunaan Kawat Kasa Responden
Frequency Percent Valid Percent Cumulative Percent
Valid Tidak 95 80.5 80.5 80.5
Ya 23 19.5 19.5 100.0
99
ANALISIS BIVARIAT
Crosstabs
Penggunaan Anti Nyamuk Responden * Kejadian Malaria
Crosstab
Kejadian Malaria
Total Positif Negatif
Penggunaan Anti Nyamuk
Responden
Tidak Count 82 5 87
Expected Count 78.9 8.1 87.0
% within Penggunaan Anti
Nyamuk Responden 94.3% 5.7% 100.0%
% within Kejadian Malaria 76.6% 45.5% 73.7%
% of Total 69.5% 4.2% 73.7%
Ya Count 25 6 31
Expected Count 28.1 2.9 31.0
% within Penggunaan Anti
Nyamuk Responden 80.6% 19.4% 100.0%
% within Kejadian Malaria 23.4% 54.5% 26.3%
% of Total 21.2% 5.1% 26.3%
Total Count 107 11 118
Expected Count 107.0 11.0 118.0
% within Penggunaan Anti
Nyamuk Responden 90.7% 9.3% 100.0%
% within Kejadian Malaria 100.0% 100.0% 100.0%
Risk Estimate
Value
95% Confidence Interval
Lower Upper
Odds Ratio for Penggunaan Anti
Nyamuk Responden (Tidak / Ya) 3.936 1.107 13.994
For cohort Kejadian Malaria =
Positif 1.169 .976 1.399
For cohort Kejadian Malaria =
Negatif .297 .097 .904
N of Valid Cases 118
Chi-Square Tests
Value
Df
Asymp. Sig.
(2-sided)
Exact Sig. (2-sided) Exact Sig. (1-sided)
Pearson Chi-Square
5.007
a1
.025
Continuity Correction
b3.526
1
.060
Likelihood Ratio
4.409
1
.036
Fisher's Exact Test
.036
.036
Linear-by-Linear Association
4.964
1
.026
McNemar Test
b.000
cN of Valid Cases
118
a. 1 cells (25,0%) have expected count less than 5. The minimum expected count is 2,89.
b. Computed only for a 2x2 table
c. Binomial distribution used.
Symmetric Measures
Value Asymp. Std. Errora Approx. Tb Approx. Sig.
Measure of Agreement Kappa .172 .092 2.238 .025
N of Valid Cases 118
a. Not assuming the null hypothesis.
101
Kebiasaan Menggantung Pakaian * Kejadian Malaria
Crosstab
Kejadian Malaria
Total Positif Negatif
Kebiasaan Menggantung
Pakaian
Ya Count 88 4 92
Expected Count 83.4 8.6 92.0
% within Kebiasaan
Menggantung Pakaian 95.7% 4.3% 100.0%
% within Kejadian Malaria 82.2% 36.4% 78.0%
% of Total 74.6% 3.4% 78.0%
Tidak Count 19 7 26
Expected Count 23.6 2.4 26.0
% within Kebiasaan
Menggantung Pakaian 73.1% 26.9% 100.0%
% within Kejadian Malaria 17.8% 63.6% 22.0%
% of Total 16.1% 5.9% 22.0%
Total Count 107 11 118
Expected Count 107.0 11.0 118.0
% within Kebiasaan
Menggantung Pakaian 90.7% 9.3% 100.0%
% within Kejadian Malaria 100.0% 100.0% 100.0%
Symmetric Measures
Value Asymp. Std. Errora Approx. Tb Approx. Sig.
Measure of Agreement Kappa .285 .105 3.496 .000
N of Valid Cases 118
a. Not assuming the null hypothesis.
b. Using the asymptotic standard error assuming the null hypothesis.
Chi-Square Tests
Value df
Asymp. Sig.
(2-sided) Exact Sig. (2-sided) Exact Sig. (1-sided)
Pearson Chi-Square 12.222a 1 .000
Continuity Correctionb 9.697 1 .002
Likelihood Ratio 9.945 1 .002
Fisher's Exact Test .002 .002
Linear-by-Linear Association 12.118 1 .000
McNemar Testb .003c
N of Valid Cases 118
a. 1 cells (25,0%) have expected count less than 5. The minimum expected count is 2,42.
b. Computed only for a 2x2 table
c. Binomial distribution used.
Risk Estimate
Value
95% Confidence Interval
Lower Upper
Odds Ratio for Kebiasaan
Menggantung Pakaian (Ya /
Tidak)
8.105 2.155 30.486
For cohort Kejadian Malaria =
Positif 1.309 1.032 1.660
For cohort Kejadian Malaria =
Negatif .161 .051 .509
103
Kebiasaan Menggunakan Kelambu * Kejadian Malaria
Crosstab
Kejadian Malaria
Total Positif Negatif
Kebiasaan Menggunakan
Kelambu Responden
Tidak Count 72 3 75
Expected Count 68.0 7.0 75.0
% within Kebiasaan
Menggunakan Kelambu
Responden
% within Kebiasaan
Menggunakan Kelambu
Responden
% within Kebiasaan
Menggunakan Kelambu
Responden
90.7% 9.3% 100.0%
% within Kejadian Malaria 100.0% 100.0% 100.0%
Chi-Square Tests
Value df
Asymp. Sig.
(2-sided) Exact Sig. (2-sided) Exact Sig. (1-sided)
Pearson Chi-Square 6.896a 1 .009
Continuity Correctionb 5.277 1 .022
Likelihood Ratio 6.633 1 .010
Fisher's Exact Test .017 .012
Linear-by-Linear Association 6.838 1 .009
McNemar Testb .000c
N of Valid Cases 118
a. 1 cells (25,0%) have expected count less than 5. The minimum expected count is 4,01.
b. Computed only for a 2x2 table
c. Binomial distribution used.
Symmetric Measures
Value Asymp. Std. Errora Approx. Tb Approx. Sig.
Measure of Agreement Kappa .174 .074 2.626 .009
N of Valid Cases 118
a. Not assuming the null hypothesis.
b. Using the asymptotic standard error assuming the null hypothesis.
Risk Estimate
Value
95% Confidence Interval
Lower Upper
Odds Ratio for Kebiasaan
Menggunakan Kelambu
Responden (Tidak / Ya)
5.486 1.370 21.958
For cohort Kejadian Malaria =
Positif 1.179 1.015 1.371
For cohort Kejadian Malaria =
Negatif .215 .060 .768
105
Kebiasaan Keluar Rumah di Malam Hari * Kejadian Malaria
Crosstab
Kejadian Malaria
Total Positif Negatif
Kebiasaan Keluar di Malam Hari
Responden
Ya Count 86 3 89
Expected Count 80.7 8.3 89.0
% within Kebiasaan Keluar di
Malam Hari Responden 96.6% 3.4% 100.0%
% within Kejadian Malaria 80.4% 27.3% 75.4%
% of Total 72.9% 2.5% 75.4%
Tidak Count 21 8 29
Expected Count 26.3 2.7 29.0
% within Kebiasaan Keluar di
Malam Hari Responden 72.4% 27.6% 100.0%
% within Kejadian Malaria 19.6% 72.7% 24.6%
% of Total 17.8% 6.8% 24.6%
Total Count 107 11 118
Expected Count 107.0 11.0 118.0
% within Kebiasaan Keluar di
Malam Hari Responden 90.7% 9.3% 100.0%
% within Kejadian Malaria 100.0% 100.0% 100.0%
Chi-Square Tests
Value df
Asymp. Sig.
(2-sided)
Exact Sig.
(2-sided)
Exact Sig.
(1-sided)
Pearson Chi-Square 15.173a 1 .000
Continuity Correctionb 12.444 1 .000
Likelihood Ratio 12.742 1 .000
Fisher's Exact Test .001 .001
Linear-by-Linear Association 15.045 1 .000
McNemar Testb .000c
N of Valid Cases 118
a. 1 cells (25,0%) have expected count less than 5. The minimum expected count is 2,70.
b. Computed only for a 2x2 table
c. Binomial distribution used.
Symmetric Measures
Value Asymp. Std. Errora Approx. Tb Approx. Sig.
Measure of Agreement Kappa .306 .100 3.895 .000
N of Valid Cases 118
a. Not assuming the null hypothesis.
b. Using the asymptotic standard error assuming the null hypothesis.
Risk Estimate
Value
95% Confidence Interval
Lower Upper
Odds Ratio for Kebiasaan Keluar di
Malam Hari Responden (Selalu /
Tidak)
10.921 2.666 44.733
For cohort Kejadian Malaria = Positif 1.334 1.062 1.676
For cohort Kejadian Malaria = Negatif .122 .035 .430
107
Genangan Air Responden * Kejadian Malaria
Crosstab
Kejadian Malaria
Total Positif Negatif
Genangan Air Responden Ada Count 100 4 104
Expected Count 94.3 9.7 104.0
% within Genangan Air
Responden 96.2% 3.8% 100.0%
% within Kejadian Malaria 93.5% 36.4% 88.1%
% of Total 84.7% 3.4% 88.1%
Tidak ada Count 7 7 14
Expected Count 12.7 1.3 14.0
% within Genangan Air
Responden 50.0% 50.0% 100.0%
% within Kejadian Malaria 6.5% 63.6% 11.9%
% of Total 5.9% 5.9% 11.9%
Total Count 107 11 118
Expected Count 107.0 11.0 118.0
% within Genangan Air
Responden 90.7% 9.3% 100.0%
% within Kejadian Malaria 100.0% 100.0% 100.0%
Chi-Square Tests
Value df
Asymp. Sig.
(2-sided) Exact Sig. (2-sided) Exact Sig. (1-sided)
Pearson Chi-Square 31.094a 1 .000
Continuity Correctionb 25.874 1 .000
Likelihood Ratio 19.825 1 .000
Fisher's Exact Test .000 .000
Linear-by-Linear Association 30.831 1 .000
McNemar Testb .549c
N of Valid Cases 118
a. 1 cells (25,0%) have expected count less than 5. The minimum expected count is 1,31.
b. Computed only for a 2x2 table
c. Binomial distribution used.
Symmetric Measures
Value Asymp. Std. Errora Approx. Tb Approx. Sig.
Measure of Agreement Kappa .509 .128 5.576 .000
N of Valid Cases 118
a. Not assuming the null hypothesis.
b. Using the asymptotic standard error assuming the null hypothesis.
Risk Estimate
Value
95% Confidence Interval
Lower Upper
Odds Ratio for Genangan Air Responden
(Ada / Tidak ada) 25.000 5.877 106.352
For cohort Kejadian Malaria = Positif
1.923 1.137 3.252
For cohort Kejadian Malaria = Negatif
.077 .026 .230
109
Kandang Hewan * Kejadian Malaria
Crosstab
Kejadian Malaria
Total Positif Negatif
Kandang Hewan Ternak
Responden
Ada Count 89 3 92
Expected Count 83.4 8.6 92.0
% within Kandang Hewan Ternak
Responden 96.7% 3.3% 100.0%
% within Kejadian Malaria 83.2% 27.3% 78.0%
% of Total 75.4% 2.5% 78.0%
Tidak ada Count 18 8 26
Expected Count 23.6 2.4 26.0
% within Kandang Hewan Ternak
Responden 69.2% 30.8% 100.0%
% within Kejadian Malaria 16.8% 72.7% 22.0%
% of Total 15.3% 6.8% 22.0%
Total Count 107 11 118
Expected Count 107.0 11.0 118.0
% within Kandang Hewan Ternak
Responden 90.7% 9.3% 100.0%
% within Kejadian Malaria 100.0% 100.0% 100.0%
Chi-Square Tests
Value df
Asymp. Sig.
(2-sided) Exact Sig. (2-sided) Exact Sig. (1-sided)
Pearson Chi-Square 18.147a 1 .000
Continuity Correctionb 15.038 1 .000
Likelihood Ratio 14.606 1 .000
Fisher's Exact Test .000 .000
Linear-by-Linear Association 17.993 1 .000
McNemar Testb .001c
N of Valid Cases 118
a. 1 cells (25,0%) have expected count less than 5. The minimum expected count is 2,42.
b. Computed only for a 2x2 table
c. Binomial distribution used.
Symmetric Measures
Value Asymp. Std. Errora Approx. Tb Approx. Sig.
Measure of Agreement Kappa .347 .106 4.260 .000
N of Valid Cases 118
a. Not assuming the null hypothesis.
b. Using the asymptotic standard error assuming the null hypothesis.
Risk Estimate
Value
95% Confidence Interval
Lower Upper
Odds Ratio for Kandang Hewan Ternak
Responden (Ada / Tidak ada) 13.185 3.186 54.565
For cohort Kejadian Malaria = Positif
1.397 1.079 1.810
For cohort Kejadian Malaria = Negatif
.106 .030 .371
111
Penggunaan Kawat Kasa Responden * Kejadian Malaria
Crosstab
Kejadian Malaria
Total Positif Negatif
Penggunaan Kawat Kasa
Responden
Tidak Count 91 4 95
Expected Count 86.1 8.9 95.0
% within Penggunaan Kawat
Kasa Responden 95.8% 4.2% 100.0%
% within Kejadian Malaria 85.0% 36.4% 80.5%
% of Total 77.1% 3.4% 80.5%
Ya Count 16 7 23
Expected Count 20.9 2.1 23.0
% within Penggunaan Kawat
Kasa Responden 69.6% 30.4% 100.0%
% within Kejadian Malaria 15.0% 63.6% 19.5%
% of Total 13.6% 5.9% 19.5%
Total Count 107 11 118
Expected Count 107.0 11.0 118.0
% within Penggunaan Kawat
Kasa Responden 90.7% 9.3% 100.0%
% within Kejadian Malaria 100.0% 100.0% 100.0%
Chi-Square Tests
Value Df
Asymp. Sig.
(2-sided) Exact Sig. (2-sided) Exact Sig. (1-sided)
Pearson Chi-Square 15.065a 1 .000
Continuity Correctionb 12.122 1 .000
Likelihood Ratio 11.706 1 .001
Fisher's Exact Test .001 .001
Linear-by-Linear Association 14.937 1 .000
McNemar Testb .012c
N of Valid Cases 118
a. 1 cells (25,0%) have expected count less than 5. The minimum expected count is 2,14.
b. Computed only for a 2x2 table
c. Binomial distribution used.
Symmetric Measures
Value Asymp. Std. Errora Approx. Tb Approx. Sig.
Measure of Agreement Kappa .327 .112 3.881 .000
N of Valid Cases 118
a. Not assuming the null hypothesis.
b. Using the asymptotic standard error assuming the null hypothesis.
Risk Estimate
Value
95% Confidence Interval
Lower Upper
Odds Ratio for Penggunaan Kawat Kasa
Responden (Tidak / Ya) 9.953 2.610 37.953
For cohort Kejadian Malaria = Positif 1.377 1.047 1.810
For cohort Kejadian Malaria = Negatif .138 .044 .433
113
ANALISIS MULTIVARIAT
Logistic Regression
Notes
Output Created 21-Aug-2016 05:27:19
Comments
Input Data D:\IKA HSB\awal\spss ika malaria1.sav
Active Dataset DataSet1
Filter <none>
Weight <none>
Split File <none>
N of Rows in Working Data File 118
Missing Value Handling Definition of Missing User-defined missing values are treated as
missing
Syntax LOGISTIC REGRESSION VARIABLES
MALARIA
/METHOD=BSTEP(WALD) PAN KMP KMK
KKMH GA KHT PKK
/PRINT=CI(95)
/CRITERIA=PIN(0.05) POUT(0.10)
ITERATE(20) CUT(0.5).
Resources Processor Time 00:00:00.031
Elapsed Time 00:00:00.017
Case Processing Summary
Unweighted Casesa N Percent
Selected Cases Included in Analysis 118 100.0
Missing Cases 0 .0
Total 118 100.0
Unselected Cases 0 .0
Total 118 100.0
a. If weight is in effect, see classification table for the total number of cases.
Dependent Variable Encoding
Original
Value Internal Value
Positif 0
115
Block 1: Method = Backward Stepwise (Wald)
Omnibus Tests of Model Coefficients
Chi-square df Sig.
a. A negative Chi-squares value indicates that the Chi-squares value
has decreased from the previous step.
Model Summary
Step -2 Log likelihood
Cox & Snell R
Square
Nagelkerke R
Square
a. Estimation terminated at iteration number 8 because parameter
Omnibus Tests of Model Coefficients
b. Estimation terminated at iteration number 7 because parameter
117
Classification Tablea
Observed
Predicted
Kejadian Malaria
Percentage Correct Positif Negatif
Step 1 Kejadian Malaria Positif 104 3 97.2
Negatif 4 7 63.6
Overall Percentage 94.1
Step 2 Kejadian Malaria Positif 104 3 97.2
Negatif 4 7 63.6
Overall Percentage 94.1
Step 3 Kejadian Malaria Positif 104 3 97.2
Negatif 4 7 63.6
Overall Percentage 94.1
Step 4 Kejadian Malaria Positif 105 2 98.1
Negatif 6 5 45.5
Overall Percentage 93.2
Step 5 Kejadian Malaria Positif 104 3 97.2
Negatif 5 6 54.5
Overall Percentage 93.2
Variables in the Equation
B
S.E.
Wald
Df
Sig.
Exp(B)
95,0% C.I.for EXP(B)
119
Step 5
aKMP
2.323
.936
6.155
1
.013
10.204
1.629
63.940
KKMH
2.152
.894
5.786
1
.016
8.598
1.489
49.636
GA
3.372
.961
12.321
1
.000
29.125
4.432
191.374
Constant
-13.071
2.965
19.437
1
.000
.000
a. Variable(s) entered on step 1: PAN, KMP, KMK, KKMH, GA, KHT, PKK.
Variables not in the Equation
Score df Sig.
a. Variable(s) removed on step 2: KHT.
b. Variable(s) removed on step 3: PKK.
c. Variable(s) removed on step 4: KMK.
Block 0: Beginning Block
Classification Tablea,b
Observed
Predicted
Kejadian Malaria
Percentage Correct Positif Negatif
Step 0 Kejadian Malaria Positif 107 0 100.0
Negatif 11 0 .0
Overall Percentage 90.7
a. Constant is included in the model.
b. The cut value is ,500
Variables in the Equation
B S.E. Wald df Sig. Exp(B)
Step 0 Constant -2.275 .317 51.622 1 .000 .103
Variables not in the Equation