14
ELECTRICITY AND ECONOMIC GROWTH IN INDONESIA’S
PROVINCE OF ACEH
Fahrul Rizal
Department of Mining and Energy of Indonesia’s Province of Aceh
Jl. T. Nyak Arief 195 Banda Aceh-Indonesia Coresponding Author: [email protected]
Abstract: This paper is distinguished from previous research in term of using sectoral electricity consumption data (residential, commercial, public, and industrial) rather than of using aggregate electricity consumption data in order to examine the relationship between electricity and economic growth. The vector error correction model is employed to scrutinize the linkage based on data covering time span 1995-2031 in Indonesia’s Province of Aceh. The empirical evidences indicate that the long-run bidirectional relationship exists between, (1) commercial electricity consumption and economic growth and, (2) public electricity consumption and economic growth. In addition, the short-run bidirectional relationship exists between economic growth and all of the sectoral electricity consumption. The results imply that the government policy for power development is purposed to maintain the bidirectional causality between economic growth and electricity consumption.
Keywords: Sectoral Electricity Consumption, Economic Growth, Aceh, Vector Error Correction Model.
Introduction
The role of electricity in productivity growth is very perceptible; moreover, many new techniques and new arrangements which are able to increase labor productivity and to reduce capital needs have been introduced since 20th century as a result from rapid electrification in so many industries
(Rosenberg, 2010). Even though electricity has an elastic energy form so that it may perform multiple tasks together in once time than if any other type of energies is used directly; recent empirical evidences that have observed electricity and economic growth are still presenting mixed result on causal relationship, see Ozturk (2010) and Payne (2010a,b) for a survey of the international evidence.
The interaction between electricity consumption and economic growth is crucial for policy implication; interestingly, the causation for the specific countries surveyed by Payne (2010a) found that 27.87% supported the conservation hypothesis where the economic growth causes electricity consumption, 22.95% the unidirectional causality from electricity to economic growth, 18.03% the bidirectional causality between economic growth and electricity consumption, and 31.15% supported the neutrality hypothesis where no causal relationship between the two variables.
To our knowledge, the previous studies both in Indonesia and in Aceh have only analyzed the relationship between electricity and economic growth at aggregate level (see Yoo (2006), Rizal and Nasir (2010)). The objective of this study is to examine such a relationship for Province Aceh, Indonesia between different sectors electricity consumption and economic growth. This is conducted by verifying cointegration and causality test by using time series data on sectoral electricity consumption and real gross regional domestic product in constant 2000 prices from 1995 to 2031. It is motivated by: firstly to our knowledge Governor Aceh is the pioneer in carry out the mandate as regulator in the power development affairs at provincial level than other regions in Indonesia; secondly, the projected electricity needs and real gross regional domestic product in the governor policy can express how local government see the role of electricity in the local economy.
15
previous researches especially in Aceh; section four presents the data sources; section five discusses econometric methodology; section six reveals the empirical results; and the final section presents the summary of this study along with its conclusions and recommendations.
Overview of Electricity Condition and its Legislation
Recently, awareness of the importance of the electricity sector to the national economy has been increasingly grown in Indonesia. The new paradigm had been enacted through the national regulation no. 30 year 2009 (Government of Indonesia (GOI), 2009) in which designing electricity provision to be available in reasonable price without reducing its efficiency and reliability. This was probably driven by the condition before 2009 when the government spent more on electricity subsidies than it did on strategically expenditures such as defense spending, health, and social securities (IISD, 2012). By this legislation the central government believe that electricity is the key role in achieving a sustainable economic growth as one of the national goals; moreover, sufficient electricity supply is believed as the medium to create multiplier effect on economic development. the national regulation no. 30 year 2009 also puts the responsibility on local government shoulder to make sure the establishment of the national goals by power development project.
In 2012, the roadmap of power development at provincial level had been drawn by Aceh government through governor policy no. 95 year 2012 (Government of Province Aceh, (GOPA), 2012) in which was drawn the estimated electricity needs and real gross regional domestic product for period 2013-2031 base on the actual data from period 1995-2012. The relationship between the two variables from the actual and the estimated data may show how strong the Aceh government believes that electricity will affect its economy and vice versa.
Furthermore, recent data shows that 10.7% of households still have not been touched by electricity services; however, Aceh electricity consumption in 2012 is dominated by residential consumption about 1057 GWh; along with industrial, commercial, and public consumption respectively are around 58 GWh, 300 GWh, and 250 GWh (GOPA, 2012). It implies that the impacts of electricity used on economic growth is more relying on its ability to improve the labor efficiency through the direct impact on well-being rather than the direct impact on productive activity. The policy makers ought to thus consider it carefully if the national goals are to be achieved.
Literature Review
The econometric study of causality relationship between energy consumption and economic growth has fascinated extensive interest in the energy economics literature. The earliest study is conducted by Kraft and Kraft (1978) who has found unidirectional causality from GNP to energy consumption in US; unfortunately, the further studies show the miscellaneous empirical evidences. According to Payne (2010a), around 31% of studies on causality relationship between electricity and economic growth found that there is no relationship between them while only 18% of studies confirm bi-directional causality, the rest of studies merely prove unidirectional causality from electricity to economic growth or vice versa.
16
aggregate level, Sami (2012) studied the causal relationship between different consumers of electricity and economic growth in Philippines using data from 1973-2008; moreover, the result confirm that unidirectional causality running from commercial electricity consumption to economic growth while economic growth causes industrial and residential electricity consumption without the feedback effect.
In particular, the most recent study regarding the relationship between electricity and economic growth in Aceh had been conducted by Rizal and Nasir (2010); moreover, using aggregate electricity consumption data from 1975-2007, they found the bidirectional between electricity consumption and economic growth in Aceh. In addition, they estimated that each 1 MWh increases in electricity consumption will be followed by the increase in GRDP around 0.36 to 19.03 Million IDR and each 1 Million IDR increases in GRDP will be followed by the increases in electricity consumption around 0.04 to 0.07 MWh
Data
Following Sami (2012) this study uses four variables, specifically, real gross regional domestic product (GRDP) per capita for Province Aceh, industrial electricity consumption, public electricity consumption, commercial electricity consumption, and residential electricity consumption obtained from the governor policy no. 95 year 2012 (GOPA, 2012). The time span of actual data is from 1995 to 2012 while during the period 2013-2031 as the government projection data. The unit of real GRDP is in 2000 Indonesian Rupiah per capita and electricity consumption is in KWh per costumer; furthermore, all variables are transformed into natural logarithm. The time period of study is from 1995-2031 combined the actual data and the government projection data as previously mentioned. The choice of the period was constrained by the availability of time series data on governor policy no. 95 year 2012 (GOPA, 2012).
Figure 1. Evolution of Economic Growth and Electricity Consumption in
Indonesia’s Province of Aceh
Years
log of GRDP per Capita
log of Residential Electricity per Costumer
log of Commercial Electicity per Costumer
log of Public Electricity per Costumer
17 Empirical Framework
Stationarity
Using non-stationary data in VECM or traditional Granger causality test is forbidden since it may turn the regression to become spurious. Non-stationarity or the presence of a unit root in this study is tested using Augmented Dickey Fuller test. For each variable in this study, ADF test is as follows:
∆ �= + �−1+ ∑��=1∆ �−�+ �� (1)
The core of this test is the null hypothesis that β=0,only if β≠0 the hypothesis that X
contains a unit root is rejected. The optimum lag is obtained from SIC value.
Cointegration Test
The Johansen methodology is used in this study in order to prove the existence of a long-term equilibrium between dependent variable and independent variables. Johansen test has two test means. One is trace test and the other is max Eigen-value test. The summary of the test may conclude that if the variables are cointegrated, the causality test may reparametrize the model in the equivalent vector error correction model Asteriou and Hall (2007).
Sectoral Electricity Consumption and Regional Economic Growth Model
In this paper, the dynamic linear relationship between sectoral electricity consumption and real GRDP can be captured from the vector error correction model (VECM) as follows:
Model 1: Residential Electricity Consumption and Economic Growth ∆ �= ��+ ∑��=1 ���∆ �−�+ ∑��=1 ���∆���−�+ �������−1 (2)
∆���= �+ ∑��=1 ��∆ �−�+ ∑��=1 ��∆���−�+ ������−1 (3)
Model 2: Commercial Electricity Consumption and Economic Growth ∆ �= ��+ ∑��=1 ���∆ �−�+ ∑��=1 ���∆���−�+ ������−1 (4)
∆��� = �+ ∑��=1 ��∆ �−�+ ∑��=1 ��∆���−�+ ������−1 (5)
Model 3: Public Electricity Consumption and Economic Growth
∆ �= ��+ ∑��=1 ���∆ �−�+ ∑��=1 ���∆���−�+ ������−1 (6)
∆���= �+ ∑��=1 ��∆ �−�+ ∑��=1 ��∆���−�+ ������−1 (7)
Model 4: Industrial Electricity Consumption and Economic Growth ∆ �= ��+ ∑��=1 ��∆ �−�+ ∑��=1 ��∆���−�+ ������−1 (8)
∆��� = �+ ∑��=1 �∆ �−�+ ∑��=1 �∆���−�+ ������−1 (9)
Model 5: Aggregate Electricity Consumption and Economic Growth ∆ �= ��+ ∑��=1 ��∆ �−�+ ∑��=1 ��∆���−�+ ������−1 (10)
∆��� = �+ ∑��=1 �∆ �−�+ ∑��=1 �∆���−�+ ������−1 (11)
18 Empirical Findings
Results from ADF Test
Table 1 shows the results of the ADF tests of the integration properties of the series, Y, CR, CC, CP, CI, and CE for Province Aceh. Results of the tests reveal that the series in their levels are non-stationary but they are non-stationary in their first differences. This implies that the integration of Y&CR, Y&CC, Y&CP, Y&CI, and Y&CE for Province Aceh is of order one.
Table 1. Unit Root Test
Notes: Significance at 1%/5%/10% denoted by a/b /c
Results from Johansen Cointegration Test
As the ADF test confirmed that all variables are non-stationary and integrated order 1, I(0), the foregoing step for causality test is to scrutinize whether the combined series in Model 1, Model 2, Model 3, and Model 4 are cointegrated. Table 2 shows the results of the Johansen cointegration test for all model in which the null hypothesis of r=0 can be rejected in any case at 10% level of significance. It implies that there is cointegration relationship in all of the series.
Table 2. Cointegration Test Notes: Significance at 1%/5%/10% denoted by a/b /c
Multicollinearity Test
19 Multicollinearity Test for Model 1
The following table presents the correlation coefficient among explanatory variables in model 1 and it justifies that multicollinearity problems do not exist among those variables.
Table 3. The Correlation Matrix for Model 1
∆Yt-1 ∆Yt-2 ∆Yt-3 ∆Yt-4 ∆Yt-5 ∆CRt-1 ∆CRt-2 ∆CRt-3 ∆CRt-4 ∆CRt-5
∆Yt-1 1.000 0.474 0.184 0.356 0.410 0.123 0.279 0.266 -0.243 -0.180 ∆Yt-2 0.474 1.000 0.497 0.184 0.342 0.299 0.304 -0.221 -0.124 0.463 ∆Yt-3 0.184 0.497 1.000 0.485 0.164 0.333 -0.115 -0.089 0.506 0.223 ∆Yt-4 0.356 0.184 0.485 1.000 0.478 -0.108 -0.070 0.509 0.231 -0.124 ∆Yt-5 0.410 0.342 0.164 0.478 1.000 -0.075 0.485 0.228 -0.124 0.245 ∆CRt-1 0.123 0.299 0.333 -0.108 -0.075 1.000 -0.032 -0.291 0.268 0.068 ∆CRt-2 0.279 0.304 -0.115 -0.070 0.485 -0.032 1.000 -0.083 -0.312 0.237 ∆CRt-3 0.266 -0.221 -0.089 0.509 0.228 -0.291 -0.083 1.000 -0.118 -0.421 ∆CRt-4 -0.243 -0.124 0.506 0.231 -0.124 0.268 -0.312 -0.118 1.000 -0.150 ∆CRt-5 -0.180 0.463 0.223 -0.124 0.245 0.068 0.237 -0.421 -0.150 1.000
Multicollinearity Test for Model 2
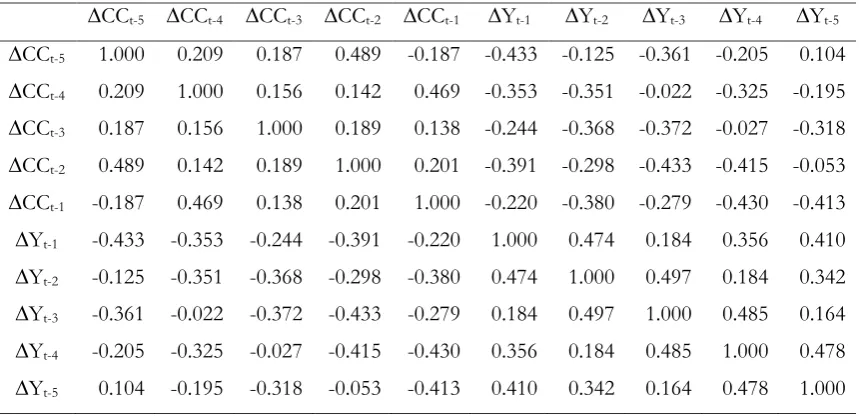
Table 4 presents the correlation coefficient among explanatory variables in model 2 and it also proves that multicollinearity problems do not exist among those variables.
Table 4. The Correlation Matrix for Model 2
∆CCt-5 ∆CCt-4 ∆CCt-3 ∆CCt-2 ∆CCt-1 ∆Yt-1 ∆Yt-2 ∆Yt-3 ∆Yt-4 ∆Yt-5
20 Multicollinearity Test for Model 3
As presented in Table 5, the multicollinearity problems do not exist among explanatory variables in model 3.
Table 5. The Correlation Matrix for Model 3
∆CPt-1 ∆CPt-2 ∆CPt-3 ∆CPt-4 ∆CPt-5 ∆Yt-1 ∆Yt-2 ∆Yt-3 ∆Yt-4 ∆Yt-5
∆CPt-1 1.000 0.364 0.147 0.077 -0.045 -0.306 0.018 -0.066 -0.523 -0.302 ∆CPt-2 0.364 1.000 0.380 0.165 0.071 -0.427 -0.236 0.103 -0.040 -0.504 ∆CPt-3 0.147 0.380 1.000 0.415 0.160 -0.238 -0.387 -0.177 0.119 -0.033 ∆CPt-4 0.077 0.165 0.415 1.000 0.459 -0.376 -0.285 -0.434 -0.225 0.089 ∆CPt-5 -0.045 0.071 0.160 0.459 1.000 -0.405 -0.365 -0.266 -0.429 -0.220 ∆Yt-1 -0.306 -0.427 -0.238 -0.376 -0.405 1.000 0.474 0.184 0.356 0.410 ∆Yt-2 0.018 -0.236 -0.387 -0.285 -0.365 0.474 1.000 0.497 0.184 0.342 ∆Yt-3 -0.066 0.103 -0.177 -0.434 -0.266 0.184 0.497 1.000 0.485 0.164 ∆Yt-4 -0.523 -0.040 0.119 -0.225 -0.429 0.356 0.184 0.485 1.000 0.478 ∆Yt-5 -0.302 -0.504 -0.033 0.089 -0.220 0.410 0.342 0.164 0.478 1.000
Multicollinearity Test for Model 4
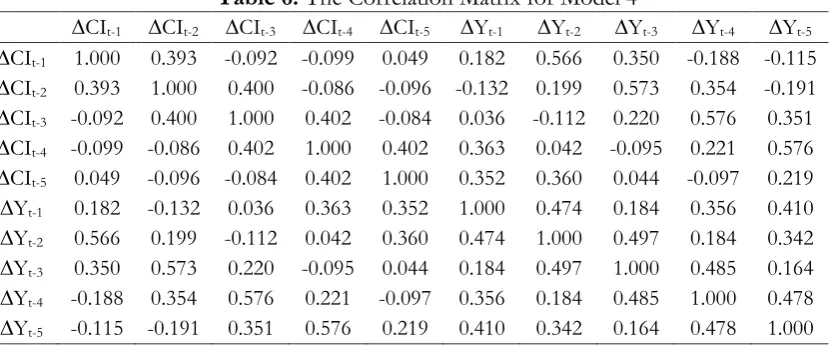
The multicollinearity test for Model 4 as presented by Table 6 also justifies that the problems do not exist among explanatory variables in model 4.
Table 6. The Correlation Matrix for Model 4
∆CIt-1 ∆CIt-2 ∆CIt-3 ∆CIt-4 ∆CIt-5 ∆Yt-1 ∆Yt-2 ∆Yt-3 ∆Yt-4 ∆Yt-5
∆CIt-1 1.000 0.393 -0.092 -0.099 0.049 0.182 0.566 0.350 -0.188 -0.115 ∆CIt-2 0.393 1.000 0.400 -0.086 -0.096 -0.132 0.199 0.573 0.354 -0.191 ∆CIt-3 -0.092 0.400 1.000 0.402 -0.084 0.036 -0.112 0.220 0.576 0.351 ∆CIt-4 -0.099 -0.086 0.402 1.000 0.402 0.363 0.042 -0.095 0.221 0.576 ∆CIt-5 0.049 -0.096 -0.084 0.402 1.000 0.352 0.360 0.044 -0.097 0.219 ∆Yt-1 0.182 -0.132 0.036 0.363 0.352 1.000 0.474 0.184 0.356 0.410 ∆Yt-2 0.566 0.199 -0.112 0.042 0.360 0.474 1.000 0.497 0.184 0.342 ∆Yt-3 0.350 0.573 0.220 -0.095 0.044 0.184 0.497 1.000 0.485 0.164 ∆Yt-4 -0.188 0.354 0.576 0.221 -0.097 0.356 0.184 0.485 1.000 0.478 ∆Yt-5 -0.115 -0.191 0.351 0.576 0.219 0.410 0.342 0.164 0.478 1.000
Multicollinearity Test for Model 5
21
Table 6. The Correlation Matrix for Model 5
∆CE
t-VECM can be applied only if two variables are non-stationary, but they become stationary after first-differencing, and co-integrated. The optimum lag is determined by the lowest AIC value as shown by the bold font in Table 7 so that the causality test is performed only on the chosen number of lagged variables.
Table 7. AIC Value from different lag
AIC Value
No. Model 1 Model 2 Model 3 Model 4 Model 5
∆CR→∆Y ∆Y→∆CR ∆CC→∆Y ∆Y→∆CC ∆CP→∆Y ∆Y→∆CP ∆CI→∆Y ∆Y→∆CI ∆CE→∆Y ∆Y→∆CE
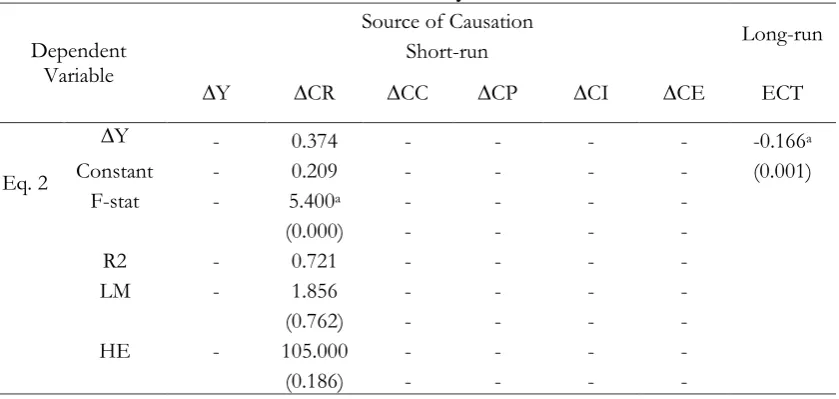
5 -3.327 -4.758 -3.437 -3.078 -3.232 -3.503 -2.960 -2.624 -4.503 -4.381 respect to Eq. (2) and Eq. (3), residential electricity consumption has a positive and statistically
significance impact in the short-run on economic growth whereas economic growth to residential electricity consumption is statistically insignificance. Moreover, the error correction term is statistically significant at 1% level with 16.6% adjustment to the short-run disequilibrium running from residential electricity to economic growth, but it is insignificant for the vise versa.
23 independent variables. Probability values are in parentheses. F-stat is partial F-statistic. LM is the multiplier test for serial correlation. HE is White's heteroscedasticity test. Significance at the 1%
level is denoted by “a”.
24
Regarding Eq. (8) and Eq. (9), both industrial electricity consumption and economic
growth have a positive and statistically significant impact to each other in both short-run and long-run. In regards to industrial electricity to economic growth relationship, the rate of adjustment toward to equilibrium is about 4.5% and 12.5% in the feedback effect.
On the subject of Eq. (10), it is not surprising that the aggregate electricity consumption has a positive and statistically significant impact on economic growth in the short-run with rate of adjustment to long-run equilibrium is about 29.1%. In Eq.(11), economic growth has statistically significant impact aggregate electricity consumption in the short-run but it is insignificant in the long-run.
Finally, the short-run and long-run causality tests reveal several interesting results. First, there is bidirectional causality from electricity consumption and economic growth in the short-run. Second, the long-run equilibrium running from electricity consumption to economic growth exists in all models except for public electricity consumption. Third, the long-run equilibrium running from economic growth to electricity consumption only exists in public and industrial electricity consumption. Fourth, the government policy for power development in Aceh supports the feedback hypothesis. This implies that the future energy policies will not reducing electricity consumption because of its adverse impact on economic growth.
Conclusions and Recommendation
In this paper, the short-run and the long-run causality between electricity consumption and economic growth in Aceh are examined by employing sectoral data covering the period 1995-2031. Tests for unit roots, cointegration, and vector error-correction model are provided. In the midst of the key results, it is found there is long-run bidirectional relationship between, (1) public electricity consumption and economic growth and, (2) industrial electricity consumption and economic growth. The short-run bidirectional relationship exists between, (1) residential electricity consumption and economic growth, (2) commercial electricity consumption and economic growth, (3) public electricity consumption and economic growth, (4) industrial electricity consumption and economic growth and, (5) aggregate electricity consumption and economic growth.
The government policy for power development is purposed to maintain the bidirectional causality between economic growth and electricity consumption. To preserve the local economy, electricity generation capacity must increase in step of the estimated increase in electricity consumption.
References
Adebola, S.S. (2011), “Electricity consumption and economic growth: trivariate investigation in Botswana with capital formation”, International Journal of Energy Economics and Policy, Vol. 1 No. 2, pp. 32-46.
Adom, P.K. (2011), “Electricity consumption-economic growth nexus: the Ghanaian case.”
International Journal of Energy Economics and Policy, Vol. 1 No. 1, pp. 18-31
Aktas, C. and Yilmas, V. (2008), “Causal Relationship Between Electricity Consumption and
Economic Growth in Turkey.” International Journal Management Economics and Business, Vol. 4 No. 8, pp. 45-54.
Asteriou, D. and Hall, S.G. (2007). Applied Econometrics, Palgrave Macmillan, Revised Edition. GOI. (2009), Undang-undang No 30 Tahun 2009 tentang Ketenagalistrikan, Government of Indonesia
(GOI).
GOPA, (2012), Peraturan Gubernur No. 95 Tahun 2012 tentang Rencana Umum Ketenagalistrikan Aceh, Government of Province Aceh (GOPA).
Hou, Q. (2009), “The Relation between Energy Consumption Growths and Economic Growth in
25
ISSD, (2012). A Citizen’s Guide to Energy Subsidies in Indonesia, International Institute for Sustainable Development (ISSD), Canada and Switzerland, pp. 4-5.
Khan, S., Jam, F.A. and Shahbaz, M. (2012), “Electricity Consumption and Economic Growth in Kazakhstan: Fresh Evidence from a Multivariate Framework Analysis.” Munich Personal RePEc Archive Paper, No. 43460, pp. 1-38.
Kraft, J. and Kraft, A. (1978), “On the relationship between energy and GNP”, Journal of Energy and Development, Vol. 3, 401-403.
Masuduzzaman, M. (2012), “Electricity Consumption and Economic Growth in Bangladesh: Co
-Integration and Causality Analysis”, Global Journal of Management and Business Research, Vol. 12 No. 11, pp. 47-56.
Ozturk, I. (2010), “A literature survey on energy-growth nexus”, Energy Policy, Vol. 38, pp. 340– 349.
Payne, J.E., (2010a), “A survey of the electricity consumption-growth literature”,Applied Energy, Vol. 87 No. 3, pp. 723–731.
Payne, J.E. (2010b), “Survey of the international evidence on the causal relationship between energy consumption and growth”, Journal of Economic Studies, Vol. 37 No. 1, pp. 53–95. Yoo, S.-H., (2006), “The causal relationship between electricity consumption and economic
growth in the ASEAN countries”, Energy Policy, Volume 34, Issue 18, pp. 3573-3582. Rosenberg, N. (2010), The Effects of Energy Supply Characteristics on Technology and Economic Growth,
Inside The Black Box: Technology and Economics, Cambridge University Press.
Rizal, F. and Nasir, M. 2010. “A Dynamic Linear Equilibrium between Electricity Used and Economic Growth in Aceh”, In: Malaysia-Indonesia International Conference In Economics, Management and Accounting (MIICEMA), 2010, Bangi, 25-26 November. Paper ID: MIICEMA2010-042
Sami, J. (2012), “Sectoral Electricity Consumption and Economic Growth in Philippines: New Evidence from Cointegration and Causality Results”, Working Paper Series, Fiji National
University, Working Paper Series Vol. 3 No. 12, pp. 1-23
Sarker, A.R. and Alam, A. (2010) “Nexus between Electricity Generation and Economic Growth in Bangladesh”, Asian Social Science, Vol. 6 No. 12, pp. 16-22
Shahbaz, M., Mutaschu, M. and Tiwari, A.K. (2012) “Revisiting The Relationship Between Electricity Consumption, Capital and Economic Growth: Cointegration and Causality