Mandatory Menu Labeling in One Fast-Food
Chain in King County, Washington
Eric A. Finkelstein, PhD, Kiersten L. Strombotne, BA,
Nadine L. Chan, PhD, MPH, James Krieger, MD
Background:As part of a comprehensive effort to stem the rise in obesity, King County, Washing-ton, enforced a mandatory menu-labeling regulation requiring all restaurant chains with 15 or more locations to disclose calorie information at the point of purchase beginning in January 2009.
Purpose:The purpose of this study is to quantify the impact of the King County regulation on transactions and purchasing behavior at one Mexican fast-food chain with locations within and adjacent to King County.
Methods:To examine the effect of the King County regulation, a difference-in-difference approach was used to compare total transactions and average calories per transaction between seven King County restaurants and seven control locations focusing on two time periods: one period immedi-ately following the law until the posting of drive-through menu boards (January 2009 to July 2009) and a second period following the drive-through postings (August 2009 through January 2010). Analyses were conducted in 2010.
Results:No impact of the regulation on purchasing behavior was found. Trends in transactions and calories per transaction did not vary between control and intervention locations after the law was enacted.
Conclusions:In this setting, mandatory menu labeling did not promote healthier food-purchasing behavior.
(Am J Prev Med 2011;40(2):122–127) © 2011 American Journal of Preventive Medicine
Introduction
T
he growing prevalence of obesity during the past several decades is now well documented.1 Also documented are increases in caloric intake, espe-cially for obesity-promoting energy-dense foods.2 One reason for this increase is a trend toward consumption of food-away-from-home (FAFH). Since 1972, the propor-tion of total food expenditures spent on FAFH increased from 34% to roughly 50%.3 FAFH meals are generally higher in calories, salt, and fats than home-cooked meals,4 – 6and there is evidence that increased consump-tion of restaurant foods, and primarily fast foods, is partly responsible for rising obesity.4,7–10As part of more comprehensive efforts to stem the rise in obesity prevalence, several state and local govern-ments, including New York City (NYC), San Francisco, and King County WA, have enacted or proposed manda-tory menu labeling. Adoption of these regulations was in part justifıed by evidence from experimental studies11,12 that demonstrated that the provision of nutrition infor-mation positively influenced the choice of menu items. Because these laws are relatively new, to date only three published studies have attempted to quantify the effect of menu labeling in restaurants.
The fırst was a 2007 study by the NYC Department of Health and Mental Hygiene13that examined food pur-chases at Subway restaurants, a chain that voluntarily posted calorie information prior to enactment of the city’s menu-labeling law. The study found that customers who looked at nutritional information before ordering purchased meals with fewer overall calories. Although this suggests that mandatory postings may be effective, because Subway is known to offer entrées seen as health-ier, and many consumers may choose to eat there for this reason, the extent to which results from Subway would From the Department of Health Services and Systems Research,
Duke-National University of Singapore Graduate Medical School (Finkelstein, Strombotne), Singapore; Assessment, Policy Development and Evaluation (Chan) and Prevention (Krieger), Public Health-Seattle and King County, Seattle, Washington
Address correspondence to: Eric A. Finkelstein, PhD, Duke-NUS Grad-uate Medical School, Health Services and Systems Research, 8 College Road, Level 4, Singapore, 169857. E-mail: eric.fı[email protected].
0749-3797/$17.00
generalize to other chains is unknown. Elbel et al.14 stud-ied the effect of the NYC menu-labeling law at 14 fast-food restaurants in low-income, minority neighborhoods in NYC. They found no signifıcant effects of the legisla-tion on caloric intake.
A recent pilot study15quantifıed the impact of volun-tary menu labeling in Pierce County WA. The study showed that the average calories purchased in 6 full-service restaurants fell by about 15 calories per entrée. However, this study was based on only 1 month of data postlabeling, so it is unclear whether these results would be sustained. Moreover, the analyses looked solely at en-trees. If a customer orders a healthier entrée, it is possible that he compensates with a caloric beverage or dessert. As a result, net calories could increase even if entrée calories decline. In order to test the net effect of the legislation on calories purchased, all foods and drinks should be in-cluded in the analysis. Based on the studies to date, it remains uncertain whether or not mandatory menu la-beling will lead to signifıcant reductions in caloric intake from restaurants.
The present study complements prior studies by providing evidence of the impact of mandatory menu labeling in King County WA on one fast-food chain of Mexican restaurants. King County includes Seattle and several outlying cities. King County’s menu-labeling law went into effect on August 1, 2008, and became mandatory (fınes imposed) on January 1, 2009. The legislation states that restaurants that are part of chains with 15 or more outlets nationwide and have annual gross sales of at least $1 million must provide nutrition labels (calories, saturated fat, carbohydrates, and so-dium) for all standard food and beverage items at the point of purchase. Quick-service restaurants are re-quired to display calories on menu boards or on signs adjacent to menu boards and must make information on carbohydrate, sodium, saturated fat, and daily rec-ommended caloric intake readily available in pam-phlets, brochures, or posters. Additionally, restaurants were required to post calories on drive-through menu boards beginning in August 1, 2009. This latter re-quirement is signifıcant given that drive-through or-ders represent more than 70% of revenue for many fast-food outlets.16
The King County regulation thus provides a unique opportunity to evaluate the effect of in-store and drive-through menu posting on consumer behavior. Pre–post data from one regional Mexican fast-food chain, Taco Time Northwest, with locations within and beyond King County, were used to test the impact of mandatory menu labeling on transactions and calories purchased from these locations. It is hypothesized here that as a result of the legislation:
● Total transactions at locations within King County will decrease after the legislation goes into effect compared with locations outside King County. This hypothesis is based on the assumption that some consumers of high-calorie entrees, on disclosure of the high-calorie informa-tion, will opt to dine at other establishments.
● Average calories per transaction will also decrease rel-ative to non–King County locations as some consum-ers switch to lower-calorie food and drink options in efforts to reduce their caloric intake.
● The effects of the policy will be greater after August 1, 2009, when calorie information appears on drive-through menu boards.
These results may provide useful information for the development of the federal menu-labeling law, details of which are still being considered.
Methods
This analysis is based on sales data from Taco Time Northwest restaurants. Of the chain restaurants contacted, Taco Time was the only quick-service chain that agreed to provide transaction data. Taco Time Northwest is a Mexican fast-food restaurant chain with more than 70 locations across the state of Washington. The menu includes a variety of Tex–Mex options like burritos, tacos, salads, and fries. Menu items span a wide range of calories. For example, a beef Roma burrito is 843 calories whereas a regular chicken taco salad is 196 calories. Notably, Taco Time highlights several low-calorie entrée options on their “healthy highlights” menu.17
The store-level data include total monthly transactions and monthly sales for every menu item between January 2008 and January 2010, which was 13 months after the law was enacted and the menu boards were updated to include the nutritional information. Fourteen stores were included in the analysis. These include all seven stores located in counties adjacent to King County and whose data were available in the company database for the entire period of analysis and a randomly selected subset of 21 King County stores that also had complete sales and transactions data for the study period. Monthly sales for each menu item were converted to monthly calories sold based on calorie data for each menu item available from the company’s website and, for a few discontinued or nonstandard items, directly from company management. The resulting data set provides greater than 80% power to detect differ-ences of 25 calories or more per monthly transaction as a result of the legislation.
Specifıcally, the regressions were estimated in the following form:
yst⫽ 0⫹ 1KC⫹ 2POST1⫹ 3
共
KC⫻POST1兲
⫹ 4POST2⫹ 5共
KC⫻POST2兲
t⫹ st,where ystis the dependent variable for each storesin montht (either transactions or calories per transaction), KC is a dummy variable equal to 1 if storesis located in King County, POST1 is a dummy variable for Period 1 (equal to 1 when monthtfalls be-tween January 2009 and July 2009), POST2 is a dummy variable for Period 2 (equal to 1 when monthtfalls between August 2009 and January 2010). The interaction terms, KC⫻POST1 and KC⫻ POST2, test the key hypotheses, that pre–post changes in average monthly transactions and average monthly calories per transaction are different in King County locations than in surrounding loca-tions as a result of the menu-labeling legislation and drive-through postings. Negative coeffıcients on these variables are consistent with the primary hypotheses of smaller growth (or larger reduc-tions) in these outcomes. Seasonal dummy variables were included to control for temporal effects. Regressions were estimated for total calories per transactions and separately for food and drink calories. Regressions that include monthly dummy variables and that break the POST1 and POST2 time periods into smaller increments to test for temporary effects of the calorie postings also were explored. Results (available on request) were robust to all specifıcations modeled.
Additional analyses were run to test whether those who fre-quented King County locations may have been making healthier purchases before the law took effect. Lower-calorie food options were identifıed as the Healthy Highlights listed on the company’s menu and website. On average, these entrees were 42% lower in calories than other entrees. Healthy Highlights entrees showed a mean number of calories of 281, compared to a mean of 480 in all
taco, burrito, and salad entrees. The lower-calorie drink options included diet sodas, water, iced tea, and other low-calorie drink options.
All analyses were conducted using Stata, version 11. SEs for all regression analyses were adjusted for repeated observations within restaurants over time.
Results
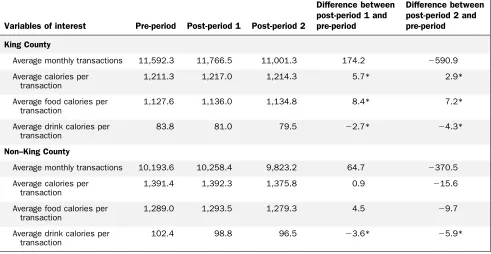
Table 1 compares the results from the pre- and post-periods and shows no signifıcant trend in monthly trans-actions for either King County or non–King County lo-cations. The table reveals that the number of monthly transactions per store is, on average, greater in King County than in non–King County locations both before and after the legislation went into effect. Table 1 also presents results for (1) average monthly calories per transaction; (2) average monthly food calories per trans-action; and (3) average monthly drink calories per transaction.
Average calories per transaction are roughly 180 calories greater in the non–King County, compared with the King County locations, both before and after the menu-labeling law went into effect. This difference is largely driven by lower average food calories per transaction (roughly 160 calories lower) but also by lower drink calories per transaction (roughly 20 calo-ries higher) in King County locations. King County locations show slight increases in overall calories and in calories from food and slight decreases in drink Table 1. Unadjusted mean differences in transaction data (per store, per month)
Variables of interest Pre-period Post-period 1 Post-period 2
Difference between post-period 1 and pre-period
Difference between post-period 2 and pre-period
King County
Average monthly transactions 11,592.3 11,766.5 11,001.3 174.2 ⫺590.9
Average calories per transaction
1,211.3 1,217.0 1,214.3 5.7* 2.9*
Average food calories per transaction
1,127.6 1,136.0 1,134.8 8.4* 7.2*
Average drink calories per transaction
83.8 81.0 79.5 ⫺2.7* ⫺4.3*
Non–King County
Average monthly transactions 10,193.6 10,258.4 9,823.2 64.7 ⫺370.5
Average calories per transaction
1,391.4 1,392.3 1,375.8 0.9 ⫺15.6
Average food calories per transaction
1,289.0 1,293.5 1,279.3 4.5 ⫺9.7
Average drink calories per transaction
102.4 98.8 96.5 ⫺3.6* ⫺5.9*
calories between the pre- and each post-period, with no change in total calories. Non–King County restau-rants show slight decreases in average drink calories per transaction only. Although these differences are signifıcant, they are extremely small.
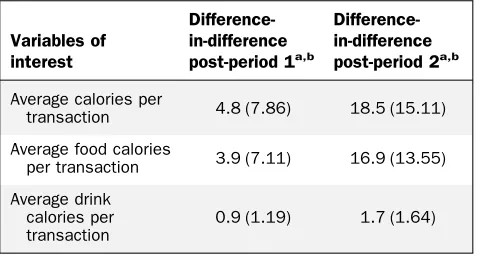
Tests of the key hypotheses are summarized by the difference-in-difference estimates inTable 2. These esti-mates are not statistically different from zero, suggesting the hypothesis that the legislation did not reduce calories per transaction (either before or after calorie information was posted on the drive-through menu boards) could not be rejected.
Table 3 compares the sales mix across King County and non–King County locations. These results reveal no signifıcant differences in the mix of sales across major categories of foods/drinks. However,Table 4shows that King County consumers were making healthier pur-chases prior to enactment of the law. The percentage of transactions that involved “healthy entrees” were 11.7% in King County versus 9.4% in the non–King County locations. Moreover, whereas 45.4% of transactions
in-volved a low-calorie drink in King County, this fıgure was 39.4% for restaurants outside King County. These differ-ences, which were signifıcant, explain why average calo-ries per transaction were greater in stores outside King County and may explain the lack of effect of the legisla-tion; King County patrons already were consuming healthier options.
Discussion
The results for this chain of Mexican fast-food outlets show no signifıcant impact of mandatory menu labeling on monthly transactions and calories sold per transaction as implemented in King County WA. Neither total monthly transactions nor calories per transaction were affected immediately by the legislation or affected later when calorie information was added to the drive-through menu boards.
Given the pending federal legislation, it is important to consider possible explanations of the lack of effectiveness of the King County legislation at this chain. One possible explanation is that customers already were aware of the calorie content of the menu items. This is possible for Taco Time and for most other fast-food outlets as this information is almost universally available on the com-pany websites. If consumers are already aware of the calorie content of fast-food menu items, then posting this information on the menu boards is likely to have little added value.
Although this explanation is plausible, numerous studies18,19have shown that consumers tend to be poor judges of the caloric content of restaurant foods, and infrequently access web-based nutrition information. Therefore, having the information on the menu boards is likely to convey new information to consumers. How-ever, it is possible that consumers do not understand or internalize the information on the menu board and the links among a poor diet, obesity, and adverse health out-comes. If consumers are unable to understand or inter-nalize the menu postings, then mandatory menu labeling without an accompanying public health or education Table 2. Difference-in-difference regression results and
SEs
transaction 4.8 (7.86) 18.5 (15.11)
Average food calories
per transaction 3.9 (7.11) 16.9 (13.55)
Average drink calories per transaction
0.9 (1.19) 1.7 (1.64)
aThere were no significant differences in results.
bSeasonal dummy variables (winter, spring, summer) were included
as covariates.
Table 3. Differences in overall purchasing behaviors in the pre-period, %
Pre-period
Items sold King County Non–King County Differencea
Entrees 47.0 47.3 ⫺0.4
Drinks 28.0 27.2 1.0
Desserts 1.0 1.0 ⫺0.1
Sides 21.4 21.6 ⫺0.3
Kid meals 2.6 2.8 ⫺0.2
100.0 100.0
aThere were no significant differences in results.
Table 4. Differences in healthy purchasing behaviors prior to the menu-labeling law, %
Pre-period
Healthy entrees 11.7 9.4 2.3*
Diet drinks 45.4 39.4 6.0*
campaign is unlikely to be successful. This should be an area for future research.
It is also possible that even when confronted with all relevant health and nutrition information at the point of purchase, taste, price convenience and variety remain more salient factors in the purchasing decision for many consumers than do the potentially adverse health effects of consuming a particular menu option. Understanding the extent to which select subgroups of consumers are willing to trade off taste, price, convenience, and variety for improved health content should also be an area for future research.
It is worth noting that even before the King County law went into effect, on average, customers of the King County locations were eating healthier than customers outside King County. Seattle is known to be a health conscious city, so this result is not surprising. However, it raises the question of how customers identifıed the healthier entrees. It is possible that the more health con-scious consumers went to the website for this informa-tion, but more likely is that they relied on information available at the point of purchase. This information in-cluded the Healthy Highlights logo displayed on the menu board and also the identifıcation of drinks as “diet” or “sugar-free.” All are strong cues for which menu op-tions are lower-calorie and suggest that these types of logos may be as effective or perhaps even more effective than detailed nutrition information in encouraging healthier food purchases. This too should be an area for future research.
This analysis has several limitations. The primary limitation is that it is limited to one fast-food chain with 13 months of data postlegislation. And although the results are generally consistent with the lack of calorie reduction seen from previous studies, future studies should replicate these results for other estab-lishments and over longer time periods before strong conclusions can be made concerning the overall im-pact of mandatory menu labeling. Ideally, these studies will include several of the largest national fast-food chains. An additional limitation of this analysis is that because it was at the store level, it was not possible to identify whether certain subgroups (e.g., more health conscious, parents ordering for children, or those with chronic illnesses who are more motivated to choose healthier options) differentially benefıted from the leg-islation. Future studies allowing for subgroup analyses would be benefıcial.
As noted above, there were differences in average calories per transaction between King County and non–King County stores prior to enactment of the legislation. As a result, it is possible that the non–King County stores were not appropriate controls.
How-ever, the lack of any signifıcant reduction in transac-tions, and signifıcant increases, as opposed to de-creases, in calories per transaction in King County stores, suggests that contamination is unlikely to be masking a real positive effect of the legislation. Finally, this analysis focused solely on demand responses to menu-labeling legislation. Future studies should ex-amine the extent to which mandatory menu labeling encourages supply-side changes and their subsequent impact on fast-food purchases. Supply-side effects may involve changes in in-store promotions, product mix, or reformulation of existing products.
Conclusion
These results do not provide evidence that mandatory menu labeling, as implemented in King County, Wash-ington positively influenced food-purchasing behavior at one type of fast-food chain. In lieu of the pending federal legislation, future qualitative and quantitative studies should be undertaken to identify the circumstances un-der which mandatory menu labeling is likely to be most effective.
The authors greatly appreciate the data and assistance provided by the management at Taco Time Northwest.
This research was funded by an internal grant from Duke-NUS Graduate Medical School.
No fınancial disclosures were reported by the authors of this paper.
References
1. Flegal KM, Carroll MD, Ogden CL, Curtin LR. Prevalence and trends in obesity among U.S. adults, 1999 –2008. JAMA 2010;303(3):235– 41. 2. Finkelstein EA, Strombotne K. The economics of obesity. Am J Clin
Nutr 2010;91(5):1520S– 4.
3. Rydell SA, Harnack LJ, Oakes JM, Story M, Jeffery RW, French SA. Why eat at fast-food restaurants: reported reasons among frequent consumers. J Am Diet Assoc 2008;108(12):2066 –70.
4. Lin B, Frazao E, Guthrie J. Away-from-home foods increasingly im-portant to quality of American diet. Washington DC: U.S. Department of Agriculture, 1999 (Agric Info Bull 749):1–22.
5. Young LR, Nestle M. The contribution of expanding portion sizes to the U.S. obesity epidemic. Am J Public Health 2002;92(2):246 –9. 6. Young LR, Nestle M. Expanding portion sizes in the U.S.
market-place: implications for nutrition counseling. J Am Diet Assoc 2003;103(2):231– 4.
7. French S, Harnack L, Jeffery R. Fast food restaurant use among women in the Pound of Prevention study: dietary, behavioral and demographic correlates. Int J Obes Relat Metab Disord 2000;24(10):1353–9. 8. Niemeier HM, Raynor HA, Lloyd-Richardson EE, Rogers ML, Wing
RR. Fast food consumption and breakfast skipping: predictors of weight gain from adolescence to adulthood in a nationally representa-tive sample. J Adolesc Health 2006;39(6):842–9.
10. Thompson O, Ballew C, Resnicow K, et al. Food purchased away from home as a predictor of change in BMI z-score among girls. Int J Obes Relat Metab Disord 2004;28(2):282–9.
11. Ippolito PM, Pappalardo JK. Advertising, nutrition, and health: evi-dence from food advertising 1977–1997. Bureau of Economics Staff Report, Federal Trade Commission, 2002.
12. Variyam JN, Cawley J. Nutrition labels and obesity. Cambridge MA: National Bureau of Economic Research, 2006. NBER Working Paper No. 11956. 13. Bassett M, Dumanovsky T, Huang C, et al. Purchasing behavior and
calorie information at fast-food chains in New York City, 2007. Am J Public Health 2008;98(8):1457–9.
14. Elbel B, Kersh R, Brescoll V, Dixon L. Calorie labeling and food choices: a fırst look at the effects on low-income people in New York City. Health Aff 2009;28(6):w1110 –21.
15. Pulos E, Leng K. Evaluation of a voluntary menu-labeling prog-ram in full-service restaurants. Am J Public Health 2010;100(6): 1035–9.
16. Hughlett M. Drive-thoughts done right ring up returns. Chicago Tri-bune. articles.chicagotribune.com/2008-11-28/news/0811270365_ 1_drive-through-restaurant-technologies-competitive-advantage. 17. Taco Time full nutritional guide. .www.tacotimenw.com/tacotimemenu.
aspx.
18. Burton S, Creyer EH, Kees J, Huggins K. Attacking the obesity epi-demic: the potential health benefıts of providing nutrition information in restaurants. Am J Public Health 2006;96(9):1669 –75.
19. Krukowski RA, Harvey-Berino J, Kolodinsky J, Marsana RT, Desisto TP. Consumers may not use or understand calorie labeling in restau-rants. J Am Diet Assoc 2006;106(6):917–20.
Did you know?
The latestAJPMnews is available online.