A new method to diagnose the environmental sustainability of specifi c orchard management practices was derived and tested. As a signifi cant factor for soil quality, the soil carbon (C) management in the topsoil of the tree-row of an integrated and organic apple orchard was selected and compared. Soil C management was defi ned as land management practices that maintain or increase soil C. We analyzed the impact of the soil C management on biological (microbial biomass C, basal respiration, dehydrogenase activity, respiratory quotient) and physical (aggregate stability, amount of plant-available water, conductive mean pore diameter near water saturation) soil properties. Soil in the alley acted as a reference for the managed soil in the tree row. h e total and hot-water–extractable C amounts served as a combined proxy for the soil C management. h e soil C management accounted for 0 to 81% of the degradation or enhancement of biophysical soil properties in the integrated and organic system. In the integrated system, soil C management led to a loss of C in the top 0.3 m of the tree row within 12 yr, causing a decrease in microbial activities. In the tree row of the organic orchard, C loss occurred in the top 0.1 m, and the decrease in microbial activities was small or not signifi cant. Regarding physical soil properties, the C loss in the integrated system led to a decrease of the aggregate stability, whereas it increased in the organic system. Generally, the impact of soil C management was better correlated with soil microbial than with the physical properties. With respect to environmental soil functions that are sensitive to the decrease in microbial activity or aggregate stability, soil C management was sustainable in the organic system but not in the integrated system.
A New Method to Quantify the Impact of Soil Carbon Management on Biophysical Soil
Properties: The Example of Two Apple Orchard Systems in New Zealand
Markus Deurer* and Siva Sivakumaran HortResearch Ltd.
Stefanie Ralle University of Hannover
Iris Vogeler, Ian McIvor, Brent Clothier and Steve Green HortResearch Ltd.
Jörg Bachmann University of Hannover
I
n New Zealand, most horticultural systems are managed according to the guidelines of organic or integrated fruitproduction. h e overall environmental sustainability of organic and integrated apple production systems in New Zealand was assessed with a life-cycle analysis by Mila i Canals et al. (2006). h e generic impact of conservative, integrated, and organic apple production systems on soil quality has also been compared (Glover et al., 2000). We sought to diagnose the environmental sustainability of specifi c management practices. We focused on two production systems: an integrated apple orchard and an organic apple orchard.
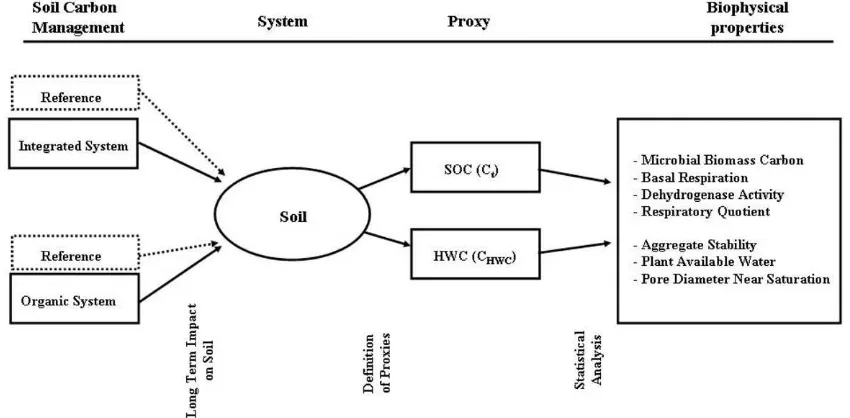
We focused on soil C management as a specifi c management practice. Soil C management is defi ned as “land management prac-tices that maintain or increase soil C” (Kimble et al., 2007). h e soil C management cannot be identifi ed as one particular management practice. Several management practices and other variables, such as soil type and climate, infl uence a soil’s C status. We used the total soil organic C (Ct) and the hot-water–extractable soil C (CHWC) as a combined proxy for the soil’s C status. h e Ct describes the size of the entire soil C pool. h e CHWC characterizes the labile C fraction that is well correlated with microbial activities (Ghani et al., 2003). Soil C is a key property for many environmental soil func-tions (e.g., fi ltering excessive plant nutrients or contaminants from water) (Pierzynski et al., 2007). Following the soil quality framework (Karlen et al., 2001, 2003), management practices would be sustainable if key soil functions did not degrade. h e relationship between soil functions and soil organic C is often indirect. Soil organic C is correlated with biophysical soil prop-erties, which in turn govern soil functions. For example, higher soil C might lead to higher microbial biomass (Sparling, 1992), which accelerates the degradation of organic contaminants.
h e performance of the soil functions usually depends on several soil properties and on the initial and boundary conditions for the specifi c site. For example, the degradation of organic con-taminants in the root zone with high microbial biomass might be prevented by an atmospheric boundary condition that leads to preferential fl ow. In that case, the contaminants would be rapidly
Abbreviations:CHWC, hot-water–extractable soil C; Ct, total soil organic C.
M. Deurer, S. Sivakumaran, I. Vogeler, I. McIvor, B. Clothier, and S. Green, Sustainable Land Use Team, HortResearch Ltd., Palmerston North, New Zealand. S. Ralle and J. Bachmann, Inst. of Soil Science, Univ. of Hannover, Hannover, Germany. Copyright © 2008 by the American Society of Agronomy, Crop Science
Society of America, and Soil Science Society of America. All rights reserved. No part of this periodical may be reproduced or transmitted in any form or by any means, electronic or mechanical, including pho-tocopying, recording, or any information storage and retrieval system, without permission in writing from the publisher.
Published in J. Environ. Qual. 37:915–924 (2008). doi:10.2134/jeq2007.0508
Received 24 Sept. 2007.
*Corresponding author ([email protected]). © ASA, CSSA, SSSA
677 S. Segoe Rd., Madison, WI 53711 USA
transferred from the soil surface to below the root zone. h e microbes in the root zone would not interact with the organic contaminants, and, therefore, degradation is low. Under these conditions, there would be no relation between a variation of microbial biomass in the bulk soil and contaminant decay.
Biophysical properties in topsoils of organic and conven-tional production systems have been compared (Carpenter-Boggs et al., 2000; Castillo and Joergensen, 2001; Fliessbach et al., 2007; Goh et al., 2001; Gunapala and Scow, 1998; Mo-nokrousos et al., 2006; Werner, 1997). However, the change in values of biophysical properties of integrated, conventional, and organic systems have not been quantitatively attributed to a specifi c set of management practices. We quantifi ed the impact of soil C management on biophysical soil properties in two apple production systems. Our objectives were (i) the presentation of a framework to quantify the impact of soil C management on selected environmentally relevant biophysical soil properties and (ii) the application of the framework to the topsoils of an organic and integrated orchard system.
In this study, the microbial biomass, basal respiration, re-spiratory quotient, and dehydrogenase activity were used as microbiological soil characteristics. Microbial biomass and basal respiration were selected as key variables to represent C and nitrogen (N) dynamics in soils (Grant et al., 1993a,b). h e sequestration of C and N, the emission of CO2 and N2O, and the degradation of organic contaminants are environmentally relevant soil functions that result from C and N turnover pro-cesses. h e respiratory quotient combines basal respiration and microbial biomass. It quantifi es the effi ciency of the C turnover
by the soil’s microbial biomass. h e dehydrogenase activity is a sensitive measure of the microbiological status of a soil (Taylor et al., 2002) and is often used to indicate the impact of land use on the soil’s microbiological properties (Parham et al., 2002; Quilchano and Marañón, 2002). It is also well correlated with environmentally relevant soil functions, such as the emission of CO2 and N2O (Włodarczyk et al., 2002).
For describing the soil physical properties, we chose the ag-gregate stability, the amount of plant-available water, and the conductive pore diameter close to water saturation. Aggregate stability is a key property preventing soil erosion (Le Bissonais and Arrouays, 1997) and loss of phosphorus to surface waters (de Jonge et al., 2004). Higher amounts of plant-available water in the root zone enable a more effi cient irrigation management, avoiding the leaching of excessive nutrients below the root zone. We measured the conductive pore diameter near water saturation (Sauer et al., 1989) as an indirect indicator for preferential fl ow.
Materials and Methods
Study Sites
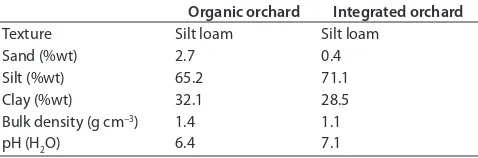
We conducted the case study on an organic and a neighbor-ing integrated apple production system in the Hawke’s Bay region on the east coast of New Zealand’s North Island (Fig. 1). Both orchards have the same general soil characteristics (Table 1). h e soils are Fluvisols and have a silt-loam texture. h e organic orchard system had been under organic management (BioGro) since 1997. h e apple trees in the orchard were 13 yr old. h e apple variety was ‘Braeburn’, and the rootstock variety was ‘MM.106’. h e tree spacing was 4.6 m within the rows and 4.4 m between the rows. Green-waste compost was applied to the topsoil of the tree rows once a year at a rate of 5 to 10 t ha−1, and lime was added at a rate of 300 kg ha−1 every 4 yr.
Lime-sulfur and copper were used as fungicides if needed. h e apple trees in the adjacent integrated orchard system were 12 yr old. h e apple variety was Pacifi c Rose, and the rootstock variety was ‘MM.106’. h e tree spacing was 3.4 m within the rows and 4.5 m between the rows. A 0.5-m wide
Fig. 1. View of the integrated and organic orchards in Hawke’s Bay. (A) Aerial view. (B) A tree row in the organic and (C) in the integrated orchard.
Table 1. General soil characteristics of the topsoil (0–0.3 m) of the organic and integrated orchard systems.
Organic orchard Integrated orchard
Texture Silt loam Silt loam
Sand (%wt) 2.7 0.4
Silt (%wt) 65.2 71.1
Clay (%wt) 32.1 28.5
Bulk density (g cm−3) 1.4 1.1
strip under the trees was kept bare by regular herbicide applica-tions. h e apple trees were drip-irrigated during the vegetative period. h e irrigation, nutrient, and pest management followed the guidelines of integrated fruit production (Wiltshire, 2003).
Framework to Quantify the Impact of Soil Carbon
Management on Biophysical Soil Properties
h e observation time (Δt) for performing the following statistical treatment should be long enough to represent the interaction of the local climate with the biophysical soil prop-erty (f). In our case, we suggest a minimum measurement period of 1 yr for the biological soil properties.
Formal Setup of Variables
We compared the values of a biophysical soil property f at lo-cation x
i and xj over a time interval Δt. h e location xj served as a
reference and did not receive all management practices but was in all other respects comparable to x
i. h is meant, for example, that
x
i and xj had the same soil type, texture, and climatic conditions
and the same initial conditions such as recent land use history.
Calculation of the Impact
h e impact of the C management on the biophysical soil property at x
i and over the time interval Δt, f(xi;Δt), was
calcu-lated in fi ve steps (Fig. 2).
Step 1. Are the proxies of soil C management, C
• t and CHWC,
in the managed treatment and the reference statistically diff erent (checked by step 1)? When this applies, then step 2. We selected a measurable proxy for the soil C management
P in the soil at x. For our study, we used C
t and the CHWC
divided by the total C contents (CHWC Ct−1) as a combined
proxy for the soil C management at x. If P(x
i;Δt) and P(xj;Δt)
were statistically signifi cantly diff erent, then a potential im-pact of the soil C management on the biophysical soil
prop-erty f(x
i;Δt) was probable, and we proceeded to the next step.
Step 2: Are the selected biophysical parameters between
•
managed treatment and reference statistically diff erent? When this applies, then step 3:
We tested if the soil biophysical property of the managed soil f(x
i;Δt) and of the reference f(xj;Δt) were statistically
sig-nifi cantly diff erent. Only if this was the case did we assume there was an impact of any management on f(x
i;Δt), and we
proceeded to the next step.
Step 3: What is the impact of all management on the
•
biophysical soil property in the managed treatment? h e ratio Φ of the biophysical soil property measured at x
i
and x
j and averaged over Δt yielded the overall impact of all
management practices on f(x
i;Δt):
,
( ; ) ( ; ) 1
( ; ) i i j
j
f x t
f x t
f x t
⎡ Δ ⎤
⎢ ⎥
⎡ ⎤
Φ⎢⎣ Δ ⎥⎦=− −⎢ ⎥
Δ
⎢ ⎥
⎣ ⎦ [1]
h e value of Φ multiplied by 100 denoted the percentage diff erence (larger = positive value and smaller = negative value) in the biophysical soil property at x
i compared with the
reference x
j. h erefore, Φ is a measure of the impact of the
management practices on the biophysical soil property at x
i.
Step 4: What is the correlation between the proxy for soil
•
C management and the biophysical soil property? We performed a regression of the biophysical soil property
f(x
i,j;Δt) (dependent variable) versus the respective
manage-ment proxy values P(x
ij;Δt) (independent variable). h is
yielded the variance fraction (R2) that could be explained by
the proxy. We denoted it by R(f(x
i,j;Δt);P). h e proxy had to
be a statistically signifi cant variable in the regression.
Step 5: What is the impact of soil C management on the
•
biophysical soil property in the managed treatment?
h e correlation between the biophysical soil property and the proxy for the soil C management, R(f(x
i,j;Δt);P) (step 4),
was multiplied by the impact of all management practices on the biophysical soil property Φ (step 3). By this we estimated the partial impact I of the soil C management P on the
bio-physical soil property at x
i:
, , ,
( i j; ); ( i j; ) ( i j; );
I f x⎢⎡⎣ Δt P⎦⎤⎥=Φ⎣⎡⎢f x Δt R f x⎥ ⎢⎤ ⎡⎦ ⎣ Δt P⎤⎥⎦ [2]
h e value of Ι multiplied by 100 denoted the percentage increase in the partial impact of the soil C management P on
the particular biophysical soil property at x
i.
Reference for the Managed Tree Rows
We used the soil in the alley of each apple orchard as the ref-erence for the managed soil in the tree row (Fig. 1). We selected the top 0.3 m. h is was the depth of the plow layer of the pre-vious land use (market gardening). For analysis, we separated the top 0.3 m into three increments (0–0.1, 0.1–0.2, 0.2–0.3 m). h is enabled us to estimate the depth of the impact of soil C management on the biophysical soil properties.
Measurement Methods
Measurements for all properties, with the exception of the conductive pore diameters near water saturation, were taken from three depths (0–0.1, 0.1–0.2, and 0.2–0.3 m) at three randomly selected locations of the tree rows and alleys (be-tween the marks of the wheel-tracks) of both orchards.
Total Carbon
h e soil samples were analyzed by the Dumas Method for %C using a LECO CNS-2000 Analyzer (Laboratory Equipment Cor-poration Ltd, Castle Hill, NSW, Australia). h e C contents were measured in January and November 2006. h e CHWC (Ghani et al., 2003) was measured monthly from April to December 2006.
Microbiological Measurements
h e microbiological functioning of the soil was character-ized by taking monthly measurements from January to De-cember 2006. We measured microbial biomass according to the method of Höper (2006) and basal respiration following Őhlinger et al. (1996).
Dehydrogenase Activity
We used 5 g of soil to perform a dehydrogenase assay with 2,3,5-triphenyltetra-zolium chloride as a substrate (Chandler and Brookes, 1991). h e resulting triphenylformazan con-centrations of the extracted solutions were measured with a spectrophotometer at 485 nm (DU-640; Beckman, Krefeld, Germany). Using bulk density measurements, the results were transformed to represent soil layers of a unit area of 1 m2.
Physical Measurements
h e physical functioning of the soil was analyzed by measur-ing water retention (Dane and Hopmans, 2002) and aggregate stabilities (Le Bissonais, 1996) in the laboratory and by measur-ing water infi ltration rates with tension disk infi ltrometers in the fi eld (Deurer et al., 2008). From the water retention curves,
we estimated the plant-available water content as the amount of water that is retained in the soil between −0.064 and −15 bar. h e aggregate stabilities were expressed as a mean weighted aggregate diameter (Le Bissonais, 1996). From the infi ltration rates at −80 and −10 mm tension, we derived the equivalent conductive macropore diameter (CMD) (Sauer et al., 1989).
Statistical Methods
h e results of each production system (organic, integrated) were analyzed with a two-way ANOVA with the Genstat 9.1.0.150 software. We selected the treatment (tree row versus alley) as the fi rst and the soil depth (0.0–0.1, 0.1–0.2, or 0.2–0.3 m) as the second factor. h e monthly measurements of microbial properties were represented as blocks. h ere were three randomly selected replicates for each combination of the two factors within each block. We interpreted the diff erences between averages of properties to be signifi cant if they were larger than their respec-tive least signifi cant diff erences (P ≤ 0.05).
Results
Proxies for the Soil Carbon Management
In both systems, more C was sequestered in the alley than in the tree rows (P = 0.05). For the organic system, the diff er-ence was signifi cant only in the top 0.1 m (Fig. 3A). For the integrated orchard, all three depths under the tree row had signifi cantly less C than under the alley (Fig. 3B).
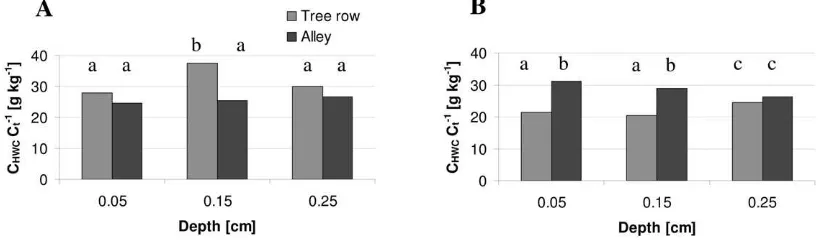
h e soil under the tree row of the organic system had a higher CHWC fraction (P = 0.05) than under the alley (Fig. 4A). h e oppo-site was the case for the integrated orchard (Fig. 4B). In summary, we found signifi cant diff erences between tree row and alley for at least one of the proxies for C management in 0 to 0.2 m for the organic orchard and in 0 to 0.3 m for the integrated orchard.
Soil Microbiological Functioning: Comparison of Tree
Row and Alley
h e C mineralization potential is indicated by the basal respiration. It was signifi cantly lower in the fi rst depth of the tree row in both production systems compared with the alley. Large diff erences in the microbial activity are indicated by a signifi cant diff erence in the microbial biomass. h is could be found for the fi rst two depths of the integrated orchard and did not occur in any depth of the organic orchard (Table 2).
h e respiratory quotients of the organic and integrated tree rows were not signifi cantly diff erent from the values of the al-leys. h erefore, no shift in the effi ciency of C turnover by the microbes had occurred in either system. h e dehydrogenase activity was signifi cantly smaller in the tree row than in the al-ley of both production systems irrespective of depth (Table 2).
Physical Functioning of the Soil: Comparison of Tree Row
and Alley
the tree row. h e tree row management of both systems tended to decrease the plant-available water in the topsoil and increased it in the subsoil. Generally, the diff erences of physical properties be-tween the tree row and the reference of both systems were largest in the 0- to 0.1-m and 0.2- to 0.3-m depths (Table 3).
Correlation of Biophysical Soil Properties with Proxies
for Soil Carbon Management
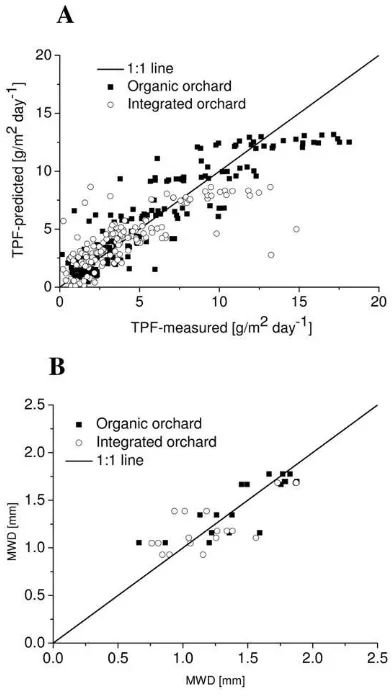
h e proxies for soil C management explained diff erent frac-tions of the variability of the biophysical soil properties in the two systems. For example, the proxies were not signifi cant for the conductive pore diameter near water saturation in either system but explained 81% of the variation of the dehydrogenase activity in the integrated production system (Fig. 5A). h e regressions diff ered between the production systems (Fig. 5). h e total C, Ct, and CHWC Ct−1 explained 81% of the variation of the
dehy-drogenase activity in the integrated system but only 58% in the organic system (Fig. 5). For the aggregate stability, Ct and CHWC Ct−1 explained a higher fraction of the variation in the organic
(R2 = 0.68) than in the integrated system (R2 = 0.54) (Fig. 5B).
h e Ct was a signifi cant variable for all biophysical soil prop-erties apart from the conductive pore diameter near water satura-tion (Tables 4 and 5). h e CHWC was not a signifi cant variable in the regression for several biophysical properties, including the mi-crobial biomass in the integrated system and the basal respiration in the organic system (Table 3) and the amount of plant-available
water and the conductive pore diameter near water saturation in both systems (Table 5). Generally, the proxies for the soil C man-agement explained more of the variability in the microbial soil properties than in the physical soil properties.
Total and Partial Impact of the Soil Carbon Management
on the Microbiological Functioning of the Soil
h e microbial properties decreased between 0 and 33% in the soil of the tree row of the organic system compared with the refer-ence (Table 4). We could explain 0 to 81% of the variation in mi-crobial properties by the proxies of soil C management (Table 4). h erefore, the impact of the soil C management on the microbial properties was always smaller than the impact of all management. For example, the basal respiration in the tree row of the organic orchard decreased in total by 15%, but we attributed only a reduc-tion of 6% to the soil C management. h e decrease in microbial properties in the tree row compared with the alley was much higher in the integrated system than in the organic system, ranging from 0 to 62% (Table 4). For example, the dehydrogenase activity in the tree row of the integrated system decreased by more than 30% in all depths as a result of soil C management.
Total and Partial Impact of the Soil Carbon Management
on the Physical Functioning of the Soil
h e physical properties showed no clear general trend in the tree row of the organic system compared with the
refer-Fig. 3. Average (N = 6) total C contents in the top 0.3 m of the soils under the tree row and the alley of the apple orchards. (A) Organic system. The LSD between the tree row and the alley is 0.48 kg C m−2. (B) Integrated system. The LSD between the tree row and the alley is 0.25 kg C m−2. The C contents refer to 0.1-m-thick layers that are centered at 0.05, 0.15, and 0.25 m depth. Values with dif erent letters were signii cantly dif erent (P = 0.05).
Fig. 4. Average (N = 9) hot-water–extractable C fractions (CHWC Ct−1) in the top 0.3 m of the soils under the tree row and the alley of the apple orchards. (A) Organic system. The LSD between the tree row and the alley is 3.48 g kg−1. (B) Integrated system. The LSD between the tree row and the alley is 2.98 g kg−1. The C
HWC Ct
−1 relate C
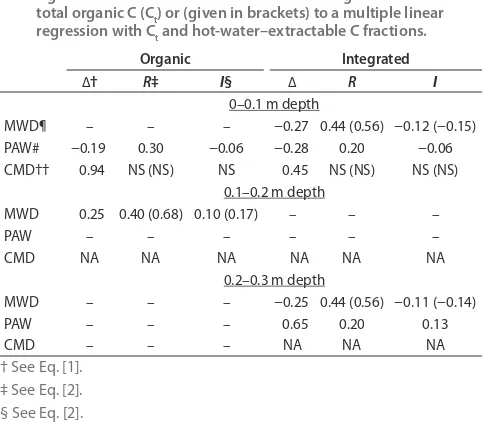
ence (Table 5). h e impact of the soil C management on the physical properties in both systems was smaller than on the microbial properties (range, −15 to +17%) (Table 5). h e conductive pore diameter near water saturation increased by 94 and 45% in the top 0.1 m of the tree row of the organic and integrated systems, respectively. However, we could not attribute this increase to the soil C management. In the inte-grated orchard, we observed a considerable degradation of the soil structure (aggregate stability) in the 0- to 0.1-m and 0.2- to 0.3-m depths in the tree row. We estimated that C manage-ment explained about half of the loss of aggregate stability.
Discussion
Selection of a Suitable Reference
We measured the impact of soil C management on the bio-physical soil properties by comparing their values with a reference. h e defi nition criteria for a reference to measure a soil’s overall quality are controversial (Karlen et al., 2003; Letey et al., 2003; Soijka et al., 2003). However, the alley seemed the obvious choice for a reference to quantify the impact of soil C management in the tree row. We could assume that the soil under the alley and the tree row had the same initial C status (i.e., at the time of the establish-ment of the orchard). Compared with the tree row, the soil under the alley received very little management. h e alley is a long-term pasture system, albeit with tree roots. Pasture systems are consid-ered the optimal land use for soil C accumulation in the topsoil (Davis and Condron, 2002; Ross et al., 2002). Also, the soil under the alley had the same soil type and climate as in the tree row.
Table 2. Yearly averages of microbial soil properties for the tree row and the alley of the organic and integrated orchard systems and the respective LSDs.
Organic Integrated
Row Alley LSD† Row Alley LSD† 0–0.1 m depth
MB-C‡ 143.5 148.5 11.3 73.0 112.3 6.7
BR-C§ 4.0 4.7 0.5 2.9 3.8 0.4
DHYD¶ 10.0 14.9 1.1 4.2 9.7 1.0
qCO2# 1.2 1.4 0.5 1.7 1.4 0.4
0.1–0.2 m depth
MB-C 60.7 62.6 11.3 43.0 53.6 6.7
BR-C 2.5 2.4 0.5 2.0 2.4 0.4
DHYD 4.7 6.4 1.1 2.1 5.4 1.0
qCO2 1.9 1.7 0.5 2.1 2.0 0.4
0.0–0.3 m depth
MB-C 38.5 37.3 11.3 26.3 32.3 6.7
BR-C 1.5 1.4 0.5 1.4 1.5 0.4
DHYD 1.8 2.8 1.1 1.2 2.8 1.0
qCO2 2.0 1.7 0.5 2.3 2.1 0.4
† LSD at the P ≤ 0.05 level.
‡ Microbial biomass C in a layer of soil (g C m−2).
§ Basal respiration in a layer of soil (g C m−2 d−1).
¶ Dehydrogenase activity in a layer of soil (g triphenylformazan m−2 d−1).
# Respiratory quotient in a layer of soil (mg BR-C/g MB-C m−2 d−1).
Table 3. Averages of soil physical soil properties for the tree row and the alley of the organic and integrated orchard systems and the respective LSDs.
Organic Integrated
Row Alley LSD Row Alley LSD
0–0.1 m depth
MWD† 1.818 1.753 0.292 1.328 1.823 0.278
PAW‡ 17.16 21.22 3.016 22.79 31.62 4.421
CMD§ 0.475 0.245 0.052 0.435 0.300 0.121
0.1–0.2 m depth
MWD 1.567 1.257 0.292 0.876 1.044 0.278
PAW 13.62 16 3.016 14.05 16.86 4.421
CMD NA¶ NA NA NA NA NA
0.2–0.3 m depth
MWD 1.391 0.910 0.292 0.965 1.289 0.278
PAW 18.78 11.16 3.016 23.95 14.5 4.421
CMD NA NA NA NA NA NA
† Aggregate stability indicated by the mean weighted diameter (MWD) (mm). ‡ Plant available water (PAW) content (mm).
§ Conductive macro-pore diameter (CMD) between −80 and −10 mm tension (mm).
¶ Not available.
Fig. 5. Regression of soil biophysical properties versus the proxies for the soil C management. (A) Dehydrogenase activity
(triphenylformazan [TPF] with N = 216 for each system). The R2 for the organic orchard is 0.81 (RMSE = 1.97), and for the integrated orchard the R2 is 0.58 (RMSE = 1.99). Total soil organic C (C
t) and the hot-water–extractable C fractions (CHWC Ct−1) were signii cant
We assumed that the tree roots contributed equally to the C status of the soil of the tree row and of the alley. Con-sequently, the alley soil reference would not be suited to quantify the impact of any tree-specifi c management (e.g., pruning) on the soil’s C status. However, our objective was to quantify the impact of a set of soil C management practices that applied only to the soil of the tree rows (e.g., compost application, irrigation, or herbicide application).
Another reason to select the soil in the alley as the refer-ence was to make the application of our method practically feasible for growers and regulatory agencies. To be meaning-ful, the reference soil has to meet the following conditions: Condition 1, same soil type; Condition 2, same climatic boundary conditions; and Condition 3, same initial soil C status as the soil of the tree row.
It is improbable to identify a soil neighboring an orchard that is used as a pasture (i.e., suitable as a reference) and simultane-ously fulfi ls all three conditions. h e greatest problem is Condi-tion 3. CondiCondi-tion 3 requires not only that the orchard and the neighboring pasture have the same initial soil carbon status but also that it was analyzed and documented at the time.
h e soil quality framework off ered no guidance as to which soil depths should be selected (Letey et al., 2003). We chose the depth of the plow layer (0.3 m) of the previous land use. For this layer we could assume that the ploughing cre-ated the same initial C amounts for the soil under the alley as under the tree row. Other studies comparing the soil quality of organic and integrated apple production systems character-ized the 0- to 0.15-m depth (Glover et al., 2000) or the 0- to 0.3-m depth (Goh et al., 2001). An investigation of the qual-ity of soils across New Zealand and under various land uses focused on the top 0.1 m (Sparling and Schipper, 2004).
Soil Carbon Management
In contrast to the unknown contributions of several soil-C–related management practices, our proxy for soil C man-agement (Ct and CHWC) can be directly quantifi ed. By relating our impact analysis to the soil C status, our results can be generalized and should apply to other land uses and sites.
h e soil C amount (Ct, CHWC) under the tree row was sig-nifi cantly smaller than under the alley of the integrated or-chard. Soil C conservation was not an objective of integrated orchard management. h e tree row without pasture received little input of root-biomass C and no input of C via compost. Additionally, the drip irrigation in the tree row led to con-tinuously favorable moisture conditions for C mineralization and might promote the leaching of dissolved organic C. h e lack of C conservation, and thus a loss of C over time in the tree rows of integrated production systems such as apple, kiwifruit, and grapes, are rarely considered. By contrast, the use of pasture as understorey vegetation for C conservation is avoided because it competes with the crops for water and nutrients (Tworkoski and Glenn, 2001). Economic incentives such as C credits (Sparling et al., 2006) or market access regu-lations that reward environmental stewardship similar to the EurepGAP framework might change this in the future.
In the organic orchard, the management conserved soil C. Soil C inputs into the soil are generally higher in organic than
Table 4. Impact of all management practices (∆) and of the soil organic C management (I) on soil microbial parameters. No values are given if the dif erences of the parameters and/or the proxies between the tree row and the alley were not statistically signii cant. The value ofR refers to a linear regression with total organic C (Ct) or (given in brackets) to a multiple linear regression with Ct and hot-water–extractable C fractions.
Organic Integrated
∆† R‡ I§ ∆ R I
0–0.1 m depth
MBC¶ – – – −0.35 0.69 (NS) −0.24 (−0.24)
BR# −0.15 0.40 (NS) −0.06 (−0.06) −0.23 0.31 (0.41) −0.07 (−0.09)
DHYD†† −0.33 0.70 (0.81) −0.23 (−0.27) −0.57 0.56 (0.58) −0.32 (−0.36)
qCO2‡‡ – – – – – –
0.1–0.2 m depth
MBC – – – −0.20 0.69 (NS) −0.14 (NS)
BR – – – −0.17 0.31 (0.41) −0.05 (−0.07)
DHYD −0.26 0.70 (0.81) −0.18 (−0.21) −0.62 0.56 (0.58) −0.34 (−0.36)
qCO2 – – – – – –
†† Dehydrogenase activity in a layer of soil (g triphenylformazan m−2 d−1).
‡‡ Respiratory quotient in a layer of soil (mg BR-C/g MB-C m−2 d−1).
Table 5. Impact of all management practices (Δ) and of the soil organic C management (I) on soil physical parameters. No values are given if the dif erences of the parameters and/or the proxies between the tree row and the alley were not statistically signii cant. The value of R refers to a linear regression with total organic C (Ct) or (given in brackets) to a multiple linear regression with Ct and hot-water–extractable C fractions.
Organic Integrated
∆† R‡ I§ ∆ R I
0–0.1 m depth
MWD¶ – – – −0.27 0.44 (0.56) −0.12 (−0.15)
PAW# −0.19 0.30 −0.06 −0.28 0.20 −0.06
CMD†† 0.94 NS (NS) NS 0.45 NS (NS) NS (NS)
¶ Aggregate stability indicated by the mean weighted diameter (MWD) (mm). # Plant available water (PAW) content (mm).
in integrated or conventional production systems (Fliessbach et al., 2007; Gunapala and Scow, 1998).
h e pasture and regular compost applications in the tree row of the organic system not only conserved Ct but also led to more labile C (as CHWC) in the tree row than in the alley.
Soil Microbial Functioning
h e degradation of the soil C status in the tree row of the integrated orchard translated, in general, to a substantial de-crease in microbial activities. Most measures of microbial ac-tivity decreased in the tree row to 0.2 m depth. In the organic orchard, the decrease in microbial activities in the tree row was small and often not signifi cant. For example, there was no signifi cant diff erence between the microbial biomass in the tree row compared with the alley.
A correlation of microbial activities and the soil C status is expected (Fliessbach et al., 2007; Ghani et al., 2003; Spar-ling, 1992). We quantifi ed the correlations between microbial activities and soil C status separately for the integrated and the organic system. h e correlation of the C status with the basal respiration was similar and low for both systems. h e soil C status could explain 58% of the variability of the dehy-drogenase activities in the integrated system and 81% in the organic system. Soil C seemed to be of diff erent importance for the enzyme activities in the two systems. Another explana-tion could be that the total and CHWC pools in the soil of the integrated and the organic orchards have not only diff erent sizes but also diff erent qualities.
h e basal respiration decreased in the soils under the tree row in both systems. We attributed less than half of this decrease to the change in the soil C status. It is diffi cult to interpret the decrease of a soil property with respect to the environmental sustainability of the soil C management. For example, the decrease of basal respiration would be positive if less basal respiration indicated a reduction in CO2 emissions. Conversely, it would be negative if it indicated a smaller deg-radation potential for C-rich organic contaminants, such as herbicides.
A quantifi cation of “positive” and “negative” could be achieved by numerically modeling those functions based on the measured basal respiration. In the soil-quality framework, the sum of positive and negative changes of all environmen-tally relevant functions would quantify sustainability (Karlen et al., 2003). Consequently, a zero net change of soil quality could then indicate the overall environmental sustainability of C management. h e scientifi c merit of such lumped sums is controversial (Letey et al., 2003; Soijka et al., 2003).
In the integrated system, the dehydrogenase activities decreased by about 60% down to 0.3 m depth. h e same order of magnitude was found in another study comparing conventional arable systems without soil C management with organic systems (Fliessbach et al., 2007). However, we could now show that only about half of this decrease was due to the degradation of the soil C status. h erefore, other management practices combined are equally important. h e respiratory quotient was recommended as a sensitive indicator for the
im-pact of land-use–related change in soil C status on the micro-bial functioning of soil (Anderson and Domsch, 1990, 1993; Sparling, 1992). However, the considerable change in the soil C status in the integrated orchard did not have any signifi cant impact on the respiratory quotient. We concluded that the C management of the topsoil of the integrated orchard was not sustainable with respect to environmental soil functions that are sensitive to the soil’s microbial functioning, whereas that of the organic orchard was sustainable.
Soil Physical Functioning
h e degradation of the soil C status in the tree row of the integrated orchard led to a decrease in the aggregate stability in the topsoil. Less C on the same soil usually leads to lower aggregate stability (Le Bissonais and Arrouays, 1997). How-ever, we could attribute only about half of the decrease in the aggregate stability in the tree row of the integrated orchard to the soil C management.
Compared with the alley, the aggregate stability in the tree row of the organic orchard improved in the 0.1- to 0.2-m depth. We attributed about 70% of this eff ect to the soil’s C status. h e amount of CHWC was signifi cantly diff erent be-tween the tree row and the reference at this depth. h erefore, the diff erence might be an eff ect of the quality rather than the total quantity of the soil C. For example, compost was applied only to the tree row and not to the alley.
h e tendency for preferential fl ow in the top 0.1 m in-creased in both systems compared with the alley. However, this was not correlated with soil C status. Another study com-paring soils in the tree row and the alley in a New Zealand orchard reported higher infi ltration rates in the tree row (Goh et al., 2001). h e authors attributed the higher infi ltration rates to the compaction by vehicles in the alley. In the apple orchards of our study, the vehicle traffi c was confi ned and created clearly visible wheel-tracks. We sampled the alley be-tween the wheel-tracks.
Many studies that evaluated soil quality in organic and conventional or integrated production systems focused only on biochemical soil properties (Anderson, 2003; Bending et al., 2004; Castillo and Joergensen, 2001; Fliessbach et al., 2007; Gil-Sortres et al., 2005; Monokrousos et al., 2006; Ruf et al., 2003; Schloter et al., 2003). In some studies it was argued that the soil’s physical parameters can be neglected in diagnosing soil quality because they have little sensitivity for land use change (Filip, 2002; Gil-Sortres et al., 2005).
physical soil quality is macroporosity in the top 0.05 to 0.1 m (Sparling et al., 2004). Other physical properties, such as the hydraulic conductivity and the plant-available water, were not considered for reasons of high variability and high cost (Schipper and Sparling, 2000).
In a forthcoming paper, we plan to use the biophysical soil properties to parameterize a numerical model and evaluate the performance of various environmental soil functions. h en, we will compare the performance of the modeled soil func-tions in the tree row with its reference (alley) and assess the sensitivity of the performance to the underlying biophysical soil properties. From the study presented here, we know how sensitive the biophysical soil properties are to soil C manage-ment. h erefore, we will be able to quantify how sustainable the soil C management is with respect to individual soil envi-ronmental functions.
Conclusions
Our proposed statistical framework was successful at dis-criminating between the impact of two contrasting C man-agement strategies on the soil’s biophysical properties. Impor-tant implications of this research are:
We have found that the impact of C management
•
extended further down the soil profi le in the integrated orchard than in the organic orchard.
h e degradation of the soil C status in the tree row of the
•
integrated orchard caused a decrease in microbial activity. For example, the dehydrogenase activity in the tree row decreased by about 60% down to 0.3 m depth compared with the reference. In the tree row of the organic orchard, the decrease in microbial activity was small. h ere was no decrease for microbial biomass.
h e degradation of the soil C status in the tree row of the
•
integrated orchard led to a decrease in aggregate stability. h e soil C conservation in the organic orchard improved the aggregate stability.
With respect to environmental soil functions that are
•
sensitive either to the decrease in microbial activity or aggregate stability the soil C management was sustainable in the organic system but not in the integrated system. For the integrated production system, we recommend the introduction of regular compost applications and the growth of pasture in the tree rows. h is could prevent a degradation of the soil’s biophysical functioning, and soil quality could be enhanced.
Acknowledgments
h is research was carried out under the SLURI programme (FRST contract CO2X0405). We thank the German Academic Exchange Service (DAAD) for fi nancial support that enabled Stefanie Ralle to carry out her internship in New Zealand.
References
Anderson, T.-H. 2003. Microbial eco-physiological indicators to asses soil quality. Agric. Ecosyst. Environ. 98:285–293.
Anderson, T.-H., and K.H. Domsch. 1990. Application of eco-physiological
quotients (qCO2 and qD) on microbial biomasses from soils of diff erent cropping histories. Soil Biol. Biochem. 22:251–255. Anderson, T.-H., and K.H. Domsch. 1993. h e metabolic quotient for
CO2 (qCO2) as a specifi c activity parameter to assess the eff ects of
environmental conditions, such as pH, on the microbial biomass of forest soils. Soil Biol. Biochem. 25:393–395.
Bending, G.D., M.K. Turner, F. Rayns, M.-C. Marx, and M. Wood. 2004. Microbial and biochemical soil quality indicators and their potential for diff erentiating areas under contrasting agricultural management practices. Soil Biol. Biochem. 36:1785–1792.
Carpenter-Boggs, L., A.C. Kennedy, and J.P. Reganold. 2000. Organic and biodynamic management: Eff ects on soil biology. Soil Sci. Soc. Am. J. 64:1651–1659.
Castillo, X., and R.G. Joergensen. 2001. Impact of ecological and conventional arable management systems on chemical and biological soil quality indices in Nicaragua. Soil Biol. Biochem. 33:1591–1597. Chandler, K., and P.C. Brookes. 1991. Is the dehyrogenase assay invalid as a method to estimate microbial activity in copper contaminated soils? Soil Biol. Biochem. 23:909–915.
Dane, J. H., and Hopmans, J. W., 2002. Water retention and storage. p. 617–720. In: Dane, J.H., and Topp, G.C. (eds.) Methods of soil analysis. Part 4: Physical methods. SSSA Book Series: No. 5, SSSA, Madison, WI. Davis, M.W., and L.M. Condron. 2002. Impact of grassland aff orestation on
soil C in New Zealand: A review of paired site studies. Aust. J. Soil Res. 40:675–690.
de Jonge, L.W., P. Moldrup, G.H. Rubaek, K. Schelde, and J. Djurhuus. 2004. Particle leaching and particle-facilitated transport of phosphorus at fi eld scale. Vadose Zone J. 3:462–470.
Deurer, M., B.E. Clothier, S. Green, and G.W. Gee. 2008. Infi ltration rate, hydraulic conductivity, and preferential fl ow. In S.D. Logsdon et al. (ed.) Soil science: Step-by-step fi eld analyses. SSSA, Madison, WI (in press). Filip, Z. 2002. International approach to assessing soil quality by
ecologically-related biological parameters. Agric. Ecosyst. Environ. 88:169–174. Fliessbach, A., H.-R. Oberholzer, L. Gunst, and P. Mäder. 2007. Soil organic
matter and biological soil quality indicators after 21 years of organic and conventional farming. Agric. Ecosyst. Environ. 118:273–284. Ghani, A., M. Dexter, and K.W. Perrot. 2003. Hot-water extractable C in
soils: A sensitive measurement for determining impacts of fertilisation, grazing and cultivation. Soil Biol. Biochem. 35:1231–1243.
Gil-Sortres, F., C. Trasar-Cepeda, M.C. Leirós, and S. Seoane. 2005. Diff erent approaches to evaluating soil quality using biochemical properties. Soil Biol. Biochem. 37:877–887.
Glover, J.D., J.P. Reganold, and P.K. Andrews. 2000. Systematic method for rating soil quality of conventional, organic, and integrated apple orchards in Washington State. Agric. Ecosyst. Environ. 80:29–45. Goh, K.M., D.R. Pearson, and M.J. Daly. 2001. Eff ects of apple orchard
production systems on some important soil physical, chemical, and biological quality parameters. Biol. Agric. Hortic. 18:269–292. Grant, R.F., N.G. Juma, and W.B. McGill. 1993a. Simulation of carbon
and nitrogen transformations in soil: Microbial biomass and metabolic products. Soil Biol. Biochem. 25:1331–1338.
Grant, R.F., N.G. Juma, and W.B. McGill. 1993b. Simulation of C and nitrogen transformations in soil: Mineralization. Soil Biol. Biochem. 25:1317–1329. Gunapala, N., and K.M. Scow. 1998. Dynamics of soil microbial biomass
and activity in conventional and organic farming systems. Soil Biol. Biochem. 30:805–816.
Höper, H. 2006. Substrate-induced respiration. p. 84–92. In J. Bloem et al. (ed.) Microbiological methods for assessing soil quality. CAB International, Wallingford, UK.
Jarvis, N., M. Larsbo, S. Roulier, A. Lindahl, and L. Persson. 2007. h e role of soil properties in regulating non-equilibrium macropore fl ow and solute transport in agricultural topsoils. Eur. J. Soil Sci. 58:282–292. Karlen, D.L., S.S. Andrews, and J.W. Doran. 2001. Soil quality: Current
concepts and applications. p. 1–40. In D.L. Sparks (ed.) Advances in agronomy, Vol. 74. Academic Press, San Diego, CA.
Karlen, D.L., S.S. Andrews, B.J. Weinhold, and J.W. Doran. 2003. Soil quality: Humankind’s foundation for survival. J. Soil Water Conserv. 58:171–179. Kimble, J.M., C.W. Rice, D. Reed, S. Mooney, R.F. Follet, and R. Lal. 2007.
erodibility: I. h eory and methodology. Eur. J. Soil Sci. 47:425–437. Le Bissonais, Y., and D. Arrouays. 1997. Aggregate stability and assessment
of soil crustability and erodibility: II. Application to humic loamy soils with various organic C contents. Eur. J. Soil Sci. 48:39–48.
Letey, J., R.E. Soijka, D.R. Upchurch, D.K. Cassel, K.R. Olson, W.A. Payne, S.E. Petrie, G.H. Price, R.J. Reginato, H.D. Scott, P.J. Smethurst, and G.B. Triplett. 2003. Defi ciencies in the soil quality concept and its application. J. Soil Water Conserv. 58:180–187.
Mila i Canals, L., G.M. Burnip, and S.J. Cowell. 2006. Evaluation of the environmental impacts of apple production using Life Cycle Assessment (LCA): Case study in New Zealand. Agric. Ecosyst. Environ.
114:226–238.
Monokrousos, N., E.M. Papatheodorou, J.D. Diamantopoulos, and G.P. Stamou. 2006. Soil quality variables in organically and conventionally cultivated fi eld sites. Soil Biol. Biochem. 38:1282–1289.
Őhlinger, R., T. Beck, B. Heilmann, and F. Beese. 1996. Soil respiration. p. 93–110. In F. Schinner et al. (ed.) Methods in soil biology. Springer-Verlag, Berlin, Germany.
Parham, J.A., S.P. Deng, W.R. Raun, and G.V. Johnson. 2002. Long-term cattle manure application in soil: I. Eff ect on soil phosphorus levels, microbial biomass C, and dehyrogenase and phosphatase activities. Biol. Fertil. Soils 35:328–337.
Pierzynski, G., D. Devlin, and D. Neel. 2007. Environmental and ecological benefi ts of soil C management: Surface water quality. p. 209–233. In
J.M. Kimble et al. (ed.) Soil C management: Economic, environmental, and societal benefi ts. CRC Press, Boca Raton, FL.
Quilchano, C., and T. Marañón. 2002. Dehydrogenase activity in Mediterranean forest soils. Biol. Fertil. Soils 35:102–107. Ross, D.J., K.R. Tate, N.A. Scott, H.A. Wilde, N.J. Rodda, and J.A.
Townsend. 2002. Aff orestation of pastures with Pinus radiata infl uences soil C and nitrogen pools and mineralization and microbial properties. Aust. J. Soil Res. 40:1303–1318.
Ruf, A., L. Beck, P. Dreher, K. Hund-Rinke, and J. Römbke. 2003. A biological classifi cation concept for the assessment of soil quality: “biological soil classifi cation scheme” (BBSK). Agric. Ecosyst. Environ. 98:263–271.
Sauer, T.J., B.E. Clothier, and T.C. Daniel. 1989. Surface measurements of the hydraulic properties of a tilled and untilled soil. Soil Tillage Res. 15:359–369. Schipper, L.A., and G.P. Sparling. 2000. Performance of soil condition
indicators across taxonomic groups and land uses. Soil Sci. Soc. Am. J. 64:300–311.
Schloter, M., O. Dilly, and J.C. Munch. 2003. Indicators for evaluating soil quality. Agric. Ecosyst. Environ. 98:255–262.
Soijka, R.E., D.R. Upchurch, and N.E. Borlaug. 2003. Quality soil management or soil quality management: Performance versus semantics. Adv. Agron. 79:1–68.
Sparling, G. 1992. Ratio of microbial biomass C to soil organic C as a sensitive indicator of changes in soil organic matter. Aust. J. Soil Res. 30:195–207. Sparling, G., and L.A. Schipper. 2004. Soil quality monitoring in New
Zealand: Trends and issues arising from a broad-scale survey. Agric. Ecosyst. Environ. 104:545–552.
Sparling, G.P., L.A. Schipper, W. Bettjeman, and R. Hill. 2004. Soil quality monitoring in New Zealand: Practical lessons from a 6-year trial. Agric. Ecosyst. Environ. 104:523–534.
Sparling, G.P., D. Wheeler, E.T. Vesely, and L.A. Schipper. 2006. What is soil organic matter worth? J. Environ. Qual. 35:548–557.
Taylor, J.P., B. Wilson, M.S. Mills, and R.G. Burns. 2002. Comparison of microbial numbers and enzymatic activities in surface soils and subsoils using various techniques. Soil Biol. Biochem. 34:387–401.
Tworkoski, T.J., and D.M. Glenn. 2001. Yield, shoot and root growth, and physiological responses of mature peach trees to grass competition. HortScience 36:1214–1219.
Werner, M.R. 1997. Soil quality characteristics during conversion to organic orchard management. Appl. Soil Ecol. 5:151–167.
Wiltshire, J.W. 2003. Integrated fruit production in the New Zealand pipfruit industry. Primary Industry Council/Kellogg Rural Leadership Programme, Lincoln University, Christchurch, New Zealand. Włodarczyk, T., W. Stepniewski, and M. Brezezińska. 2002. Dehydrogenase