Gadjah Mada International Journal of Business
Vol. 19, No. 3 (September-December 2017): 267-288
The Influence of Financial Literacy, Risk Aversion and
Expectations on Retirement Planning and
Portfolio Allocation in Malaysia
Nurul Shahnaz Mahdzan,
1*Amrul Asraf Mohd-Any,
2and
Mun-Kit Chan
31 Faculty of Business and Accountancy and Social Security Research Center, University Malaya 2 Faculty of Business and Accountancy, University of Malaya
3 Global Markets Department, United Overseas Bank (UOB) Malaysia
Abstract: The two objectives of this paper are to examine the effect of financial literacy, risk aversion and expectations on retirement planning; and, to investigate the effect of these antecedents on the retire-ment portfolio allocation. Data was collected via a self-administered questionnaire from a sample of 270 working individuals in Kuala Lumpur, Malaysia. Logistic and ordered probit regressions were employed to analyse the first and second objective, respectively. The results from the logistic regression indicate that future expectations significantly influence the probability of planning for retirement. Meanwhile, individu-als with higher financial literacy and lower risk aversion are more likely to hold risky assets in their retire-ment portfolios. Subsequently, two-sample t-test and one-way ANOVA tests were conducted to further examine the differences in financial literacy, risk aversion and expectations, across demographic sub-groups. The study contributes to the literature by holistically incorporating the behavioural aspects that affect retirement planning and by exploring an uncharted issue of retirement planning—namely, the re-tirement portfolio allocation.
Keywords:financial literacy; expectations; portfolio allocation; retirement planning; risk aversion.
Introduction
The issues of retirement planning and the adequacy of retirement savings remain at the forefront of academic research and public policy debates across many countries (e.g., Merton 2014; Boisclair et al. 2015). The importance of these issues lies in their rel-evance to numerous stakeholders, and par-ticularly to the ageing segments of society. Having inadequate retirement savings means that retirees will not be able to sustain their pre-retirement income, may have difficulty maintaining their pre-retirement standard of living, and will need to rely on welfare ben-efits. While this problem is more of a con-cern in countries with high rates of popula-tion ageing, other countries that are experi-encing similar demographic shifts —such as Malaysia— will also need to be prepared to face the consequences of these changes.
Much of the literature has highlighted that there is a growing trend around the world whereby the responsibility for providing suf-ficient retirement income has shifted from governments and employers to individuals (Lusardi and Mitchell 2007b; Tan and Folk 2011; Merton 2014). In particular, many countries have shifted from traditional de-fined benefit plans to dede-fined contribution plans. The shift from defined benefit plans to defined contribution plans implies that there is an increasing need for individuals to be adequately knowledgeable of the administra-tion of their own finances, as suggested by researchers who have found a strong link be-tween financial literacy and retirement plan-ning in many parts of the world (Sekita 2011; Boisclair et al. 2015; van Rooij et al. 2012; Brown and Graf 2013).
The literature also suggests that effec-tiveness in making financial decisions, includ-ing planninclud-ing for retirement, is linked to other
behavioral aspects, such as the attitude to risk expectations, and investment horizon (e.g. Junarsin and Tandelilin 2008; Rahardjo 2015). Kasten and Kasten (2011) assert that the emotional capacity to deal with risk and un-certainty is an important criterion in stra-tegic retirement planning, and empirical evi-dence shows that people who are less risk averse have higher levels of retirement con-fidence (Joo and Pauwels 2002). Further-more, empirical evidence shows that risk aversion is strongly related with participation in risky assets, such as mutual funds and stock market investments (e.g., Eeckhoudt et al. 2005; Shum and Faig 2006; Chen et al. 2006; Schooley and Worden 1996).
Future expectations are also important in the process of making financial decisions. Tarrazo and Gutierrez (2000) argue that agents incorporate uncertainty into their de-cision-making problems based on expecta-tions, and that practical financial planning models —which relate to how financial re-sources are allocated over time, must be flex-ible enough and incorporate uncertainty, to be more reflective of the financial planning process. Due to the continuous evolution of the external environment, the role of risk and expectations is crucial in the development of financial plans. This paper is thus built upon the premise that retirement planning involves a complex interaction of behavioral aspects —particularly of risk attitudes and expecta-tions, along with financial literacy— due to the influence of external factors on long-term planning.
of knowledge on retirement planning through a more holistic incorporation of behavioral aspects postulated to affect retirement plan-ning, and by exploring the rather unchartered issue of retirement planning —that is, retire-ment portfolio allocation. In this paper, we argue that the issue of a retirement portfolio allo-cation is imperative, because having retire-ment plans would naturally lead to the selec-tion of assets to ensure the successful attain-ment of future financial goals. In addition, this study makes a methodological contribu-tion by employing a nonparametric ordered probit regression method to examine retire-ment portfolio allocations, given the unique measurement of the proportion of risky as-sets allocated in the portfolios.
This paper focuses on the question of retirement in the context of Malaysia, as the percentage of its elderly population shows an increasing trend and by 2050, 20 percent-24 percent of the Malaysian population will be senior citizens (Global Age Watch Index 2015). In addition, reports have indicated that 90 percent of households in rural areas and 86 percent of urban Malaysians have zero savings (Shagar 2016), implying that senior citizens have to continue working past retire-ment age (Chin 2015). These factors exem-plify the seriousness of the retirement issue in Malaysia.
The remainder of this paper proceeds as follows: Section Two presents the relevant literature and hypothesis development, Sec-tion Three presents the research methods, Section Four discusses the results, and Sec-tion Five concludes the paper.
Literature Review
Retirement Planning
The theoretical underpinning of retire-ment saving is based on the Life-Cycle Hy-pothesis (LCH) of Modigliani and Brumberg (1954). According to the LCH, individuals will smooth their expenditure patterns over their life-cycle in order to ensure that real consumption trends are kept constant. Dur-ing times when earnDur-ing capabilities are high, individuals will save a portion of their income as a reserve to sustain their lives during low earning periods, such as retirement. Since the earning’s potential normally increases over the working-life, due to career progression, the ability to save increases over time. How-ever, once retirement age is reached, individu-als will have to sustain their lives by using up their accumulated savings.
The fact that the financial industry to-day offers a more complex selection of finan-cial products poses an even greater challenge to individuals’ financial decision making. Consumers who are not well versed in finan-cial knowledge and skills will find it difficult to understand the technicalities of financial products and the risks involved, and may suf-fer due to inaccurate investment choices. There are various factors contributing to in-dividuals’ decisions in regards to building their retirement income portfolio. The theo-retical notion underlying the assets’ selection and portfolio choices is the modern portfolio theory (Markowitz 1952), which suggests that the portfolio allocation decision is mainly driven by the trade-off between risk and ex-pected returns. For a given level of exex-pected return, the choice of portfolio will be one that minimizer risk exposure, or, for a given level of exposure to risk, the choice of portfolio will be one that offers the highest level of expected return. Thus, individuals’ risk aver-sion plays an important role in the financial asset’s selection. However, some studies have raised concern over individuals’ ability to make optimal investment decisions that match their risk–return preferences, which would lead to the successful maximization of retirement income (Gallery et al. 2011).
Financial Literacy
In the past decade, the role of financial literacy in retirement planning has sparked considerable research interest across many countries, in attempts to explain the lack of retirement planning and savings (e.g., Lusardi and Mitchell 2011; Huston 2010; Schmeiser and Seligman 2013; Boisclair et al. 2015; Sekita 2011; van Rooij et al. 2011a, 2011b). The intuition behind the relationship between the two variables is that retirement planning
involves a complex process of collecting and processing information (van Rooij et al. 2012). Therefore, individuals need to be suit-ably knowledgeable in financial matters if they are to have the ability to process numeri-cal and financial information that pertains to their own financial goals.
Among the early works on financial lit-eracy and financial planning was that con-ducted by Lusardi (1999). Using data from the 1992 US Health and Retirement Survey (HRS), Lusardi showed that individuals aged between 51 and 61 had not yet started to plan, or even think, about retirement. Subse-quently, using the 2004 HRS, Lusardi and Mitchell (2007b) showed that those who were more financially knowledgeable were more likely to have thought about retirement. The positive link between financial literacy and retirement planning has also been observed in other countries such as Canada (Boisclair et al. 2015), Japan (Sekita 2011) and the Netherlands (van Rooij et al. 2012). Perplexingly, studies have also found that fi-nancial illiteracy is prevalent even in coun-tries that have well developed financial mar-kets (e.g., Germany, the Netherlands, Italy, Sweden, Japan, and New Zealand) (Lusardi and Mitchell 2011).
In view of the evidence from the litera-ture, this study posits that:
H1a: Financial literacy positively influences both the probability of planning for retirement, and H1b: allocations into high risky assets in the
retire-ment portfolio.
Risk Aversion
Studies of personal financial behavior emphasize that an individual’s risk attitude plays an important role in their financial de-cision making (e.g. Robiyanto and Puryandani 2015). Financial risk aversion refers to the individuals’ attitude towards financial risk and reflects the level of uncertainty he or she is willing to take when making financial deci-sions. Kimball (1990, 54) explains that risk aversion describes how much one dislikes and avoids risk. In order to take a risk, risk-averse individuals would require sufficient compen-sation for the assumed risk. While the mod-ern portfolio theory (Markowitz 1952) pro-poses that investors’ portfolio allocation choices are driven by the trade-off between risk and return, investors are heterogeneous and differ in their risk-taking attitudes. For a given level of risk, investors with relatively higher levels of risk aversion will need to be compensated by higher returns than those with lower levels of risk aversion. Eeckhoudt et al. (2005) demonstrated that an individual who is more risk averse holds lower propor-tions of risky assets, and vice versa. This notion has been empirically supported by other researchers (e.g., Shum and Faig 2006; Chen et al. 2006; Schooley and Worden 1996). Joo and Pauwels (2002) showed evi-dence that individuals with lower levels of risk aversion were more confident in facing retirement. This evidence implies that individual’s risk taking attitudes are crucial in understanding their financial behavior.
While the individual’s financial goals are usually the main criterion in determining their financial plans, the formulation and imple-mentation of the plans are more dependent on the individual’s tolerance to risk (Grable and Carr 2014). Risk-averse individuals are expected to allocate their assets more con-servatively, resulting in less accumulated as-sets for retirement (Bajtelsmit and Van Derhei 1997). Hence, the association between risk aversion and certain groups provides a link to understanding groups of individuals with more conservative or more aggressive ap-proaches to retirement investment.
In this study, we argue that one who is more risk averse and dislikes risk is more likely to take the necessary precautions to ensure that their future finances are taken care of, than those who are more risk averse, who will have a higher likelihood of holding rela-tively lower levels of risky assets in their port-folios. Hence, this study hypothesizes the fol-lowing:
H2a: Risk aversion positively impacts the probabil-ity of planning for retirement, but
H2a: negatively affects the allocations into high risky assets in the retirement portfolio.
Future Expectations
Individuals’ expectations regarding the overall outlook of the economy are critical factors when an individual is making his or her financial decisions. Tarrazo and Gutierrez (2000) argue that financial planning models must take into consideration uncertainty and need to be built on the basis of expectations. This is because financial plans are forward looking, and involve agents allocating sources over time and anticipating future re-turns on their investments.
expectations of the future. Among the con-cerns are expectations regarding future inter-est rates, inflation rates, and anticipated re-turns on assets (Hanna et al. 2008). If the inflation rate is high, some investors may suf-fer from negative real returns on their sav-ings (Fintan 2014). Such negative returns on savings will adversely affect the real income of regular savers, especially retirees, who rely heavily on savings in bank accounts. Thus, an individual’s expectations regarding the fu-ture economy will affect his or her savings and investment choices. In the context of retirement planning, when expectations of the economy are positive, individuals will save less and hence, allocate lower amounts to retirement savings. Meanwhile, good expec-tations of the economy would increase the probability of having risky assets in their port-folios. Conversely, if expectations of the economy are negative, individuals will logi-cally save more for their retirement and hold a lower proportion of risky assets in their portfolios. Therefore, in this study, the effect of expectations on retirement planning is ex-amined:
H3a: future expectations are negatively related to the probability of planning for retirement, H3b: positively related to the allocations of risky
as-sets in the retirement portfolio.
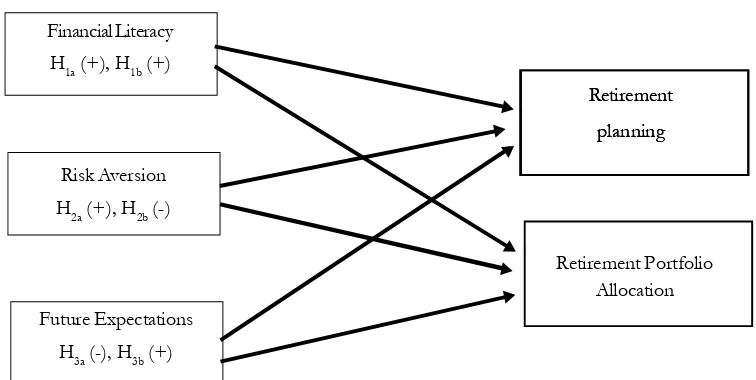
Figure 1 shows the conceptual frame-work of this study, which also summarizes the hypotheses to be tested. The three inde-pendent variables (financial literacy, risk aver-sion, and future expectations) are posited to have a direct effect on our outcome variables — namely, retirement planning and retirement port-folio allocation.
Methods
Data, Sample, and Instrument
The data for this study were collected using a self-administered questionnaire, dis-tributed via a nonrandom convenience sam-pling approach among working individuals in Kuala Lumpur, Malaysia. The respondents were recruited through the researchers’ per-sonal contacts, and consisted of profession-als from various industries such as manufac-turing, banking, retail, and education. Asur-Figure 1. Conceptual Framework
Financial Literacy H1a (+), H1b (+)
Risk Aversion H2a (+), H2b (-)
Future Expectations H3a (-), H3b (+)
Retirement planning Retirement
planning
Retirement Portfolio Allocation
vey approach is not uncommon in financial services and retirement planning studies, and such a method of sample selection has been used among college students (e.g., Limet al. 2014), as well as working adults and profes-sionals (e.g., Grable and Lytton 2003; Sabri and Zakaria 2015). Approximately 300 con-tacts were invited, via email, to participate in the study, with a link to the questionnaire hosted on Google Docs. After a month, a to-tal of 282 responses were received; 12 were incomplete, leaving 270 usable responses for analysis. The questionnaire was worded in English and contained three main sections covering the variables in the study.
Measurement of Variables
The measurements used in this study were adapted from established scales and from the work of scholars in the area of be-havioral finance and retirement studies, as follows.
Dependent Variable
Retirement planning
Retirement planning was measured us-ing a simple binary scale modified from van Rooij et al. (2011), who used a simple mea-sure as a rough indication of whether or not respondents had thought about and had begun planning for retirement. In this study, we ask whether or not the respondent has started to plan for retirement (yes = 1; no = 0). This type of simple measure has also been argued to be more reliable than dollar values of re-tirement savings, given that respondents usu-ally do not recall or understand their own fi-nances, leading to erroneous reporting (Athey and Kennickell 2005). Moreover, the use of a binary scale is not uncommon in financial decisions and retirement studies (e.g.,
Chatterjee and Zahirovic-Herbert 2010; Win-chester et al. 2011; Alhenawi and Elkhal 2013).
Retirement portfolio allocation
Retirement portfolio allocation was measured using an ordinal scale adapted from Hochguertel et al. (1997). The question was worded as follows: “If you have started plan-ning for your retirement, which combination of fi-nancial assets below best describes your retirement portfolio?” The purpose of this question was to obtain a simple estimation of the propor-tion of retirement portfolios allocated to low-risk, rather than high-low-risk, assets. To aid re-spondents in answering this question, we pro-vide a two-category classification of assets to clarify the types of financial assets that would be categorized as low risk or safe and those that would be classified as risky: (i) safe financial assets: cash, saving accounts, cash-value life insurance; and (ii) risky financial as-sets: employees’ provident fund; stocks/ shares, unit trusts, investment-linked insur-ance, commodity futures/equities. This clas-sification was based on suggestions from past research (e.g., Hochguertel et al. 1997; Guiso et al. 1996; Bertaut and Haliassos1997).
The respondents could select one from among five categories that most appropriately describes his/her retirement portfolio: 1. All of my retirement portfolio is in safe
assets
2. About three-quarters of my retirement portfolio is in safe assets
3. My retirement portfolio is balanced be-tween safe and risky assets
4. About three-quarters of my retirement portfolio is in risky assets
Independent Variables
Risk aversion
A single item statement with a 7-point Likert scale reflecting risk aversion from van Rooij et al. (2011) measures the extent to which respondents agree or disagree with the statement that they prefer safe investments over taking on risk: ‘I think it is more important to have safe investments with low, guaranteed re-turns; as opposed to those with high risks with some potential for high returns’. This subjective in-formation on risk aversion, which was origi-nally suggested by Donkers and Van Soest (1999), is a direct measure that does not re-quire heavy cognitive processing (van Rooij et al. 2011).
Future expectations
The measure for expectations was adapted from the US National Opinion Re-search Centre (1996) Survey of Consumer Finances, which asks three questions about the respondents’ expectations regarding the inflation rate, income level, and expectations over the next 5 years. The responses were coded 3 if the expectations were higher, 2 if expectations were about the same, and 1 if expectations were lower. The scores for the three expectation questions were added up to compute a total score.
Financial literacy
The measurement for financial literacy was based on van Rooij et al. (2011b), where five questions were asked to test the respon-dents’ understanding and knowledge of ba-sic financial topics such as inflation and in-terest gained on investments. Each question answered correctly was coded 1, or 0 other-wise. The sum of correct answers produced a total score indicating the level of financial literacy, ranging between 0 and 5. The
ques-tions were as follows, with correct answers shown in bold:
1. Imagine that the interest rate on your sav-ings account was 1 percent per year and inflation was 2 percent per year. After 1 year, how much you would be able to buy with the money in this account? More than today / Exactly the same / Less than today
/ Do not know
2. Considering a long-term period (for ex-ample, 10 or 20 years), which assets nor-mally give the highest return? Saving ac-counts / Government bonds / Stocks / Do not know
3. If an investor who previously owned only two stocks decides now to spread his/her money among many different assets (i.e., more stocks, real estate), his/her risk of losing money on the entire portfolio will:
Increase / Decrease / Stay the same / Do not know
4. Suppose that, in the year 2015, your in-come has doubled and price of all goods has doubled too. In 2015, how much will you be able to buy with your income? More than today / The same / Less than today / Do not know
5. Normally, which asset displays the high-est fluctuations over time? Savings accounts / Bonds / Stocks / Do not know
Results
Descriptive Statistics
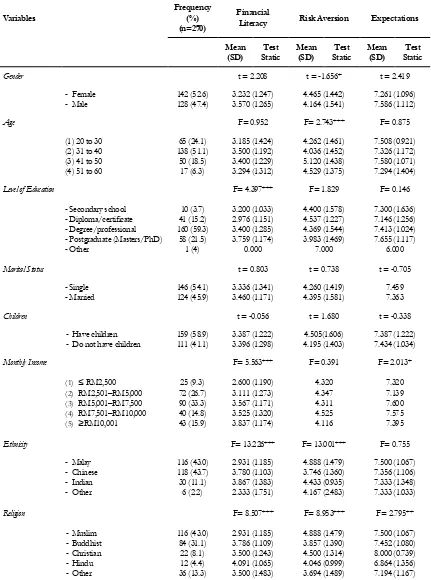
A summary of the descriptive statistics is shown in Table 1. As can be seen, the sample was approximately balanced in terms of its gender and marital status, with a ma-jority of the respondents holding a degree or professional qualification.
In regards to retirement planning, two-thirds of the sample indicated that they had already started to save for their retirement. As for the question regarding their retirement portfolios’ allocations, the results suggest that the respondents in the sample had a prefer-ence for low-risk assets, rather than more risky assets. Most respondents (46%) indi-cated that they held 75 percent of their re-tirement portfolio in low-risk assets and 25 percent in risky assets. Only 1.5 percent of respondents indicated that they held 100 per-cent of their retirement portfolio in risky as-sets. The statistics suggest that the respon-dents are generally conservative in their in-vestment choices and are risk averse.
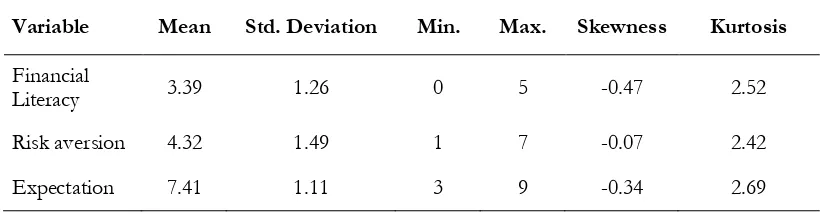
Table 2 presents the summary statistics for the three main independent variables. The mean for financial literacy is 3.39 (from a maximum of 5), indicating that respondents’ financial literacy is above average. The mean for risk aversion is 4.32 (from a maximum of 7), suggesting that the respondents in the sample are averse to risk. The financial ex-pectations is 7.41 (from a range of 3–9) sug-gesting that most respondents have high ex-pectations of the future economy. The skew-ness of the distribution for all three variables is within -0.5 to +0.5, suggesting that the distribution is approximately symmetrical.
Table 1.Descriptive Statistics of Demographic Variables and Mean Differences Among Categories for Financial Literacy, Risk Aversion and Expectations
Variables Frequency (%)
(n=270)
Financial
Literacy Risk Aversion Expectations
Table 1.Continued
Note:
(1) Two sample t-tests were conducted to test the differences in means for independent variables with two categories (t-values are reported).
(2) ANOVA tests were conducted to test the differences in means for independent variables with three or more categories (F-values are reported).
(3) ***, **, and * refer to p<0.01, p<0.05, and p<0.10, respectively.
Variable Mean Std. Deviation Min. Max. Skewness Kurtosis
Financial
Literacy 3.39 1.26 0 5 -0.47 2.52
Risk aversion 4.32 1.49 1 7 -0.07 2.42
Expectation 7.41 1.11 3 9 -0.34 2.69
Table 2. Summary Statistics for Independent Variables
groups also significantly differ, whereby the highest financial literacy scores were reported from the Hindu and Buddhist groups and the lowest financial literacy score was reported by the Muslim group [F(4,265) = 8.507, p < 0.01]. Some of our results were consistent with a study in the southern part of Italy by Bajo et al. (2015) in which financial literacy was found to be lower amongst women, the less educated and also, the less wealthy.
The ANOVA tests results also show sta-tistically significant differences in the risk
aversion levels between ethnic and religious groups. The Malays appear to have the high-est risk aversion scores compared to the other ethnic groups [F(3,266) = 13.001, p < 0.01]. Similarly, the Muslim group displays the high-est risk aversion score compared to the other religious groups (F(4,265) = 8.953, p < 0.01), suggesting that the Malays and Muslims are the ones most likely to avoid high risk invest-ments. The results of the ANOVA tests also imply significant differences in the risk aver-sion levels of respondents in different age
Variables Frequency (n = 270),
Percent (%)
Retirement Planning -Yes
-No 180 (66.7) 90 (33.3)
Retirement Portfolio
Allocation -- 100% safe 75% safe, 25% risky - 50% safe, 50% risky - 25% safe, 75% risky - 100% risky
26 (9.6) 125 (46.3)
groups [F(3,266) = 2.743, p < 0.01]. Respon-dents within the range of 41-50 display the highest risk aversion level, followed by the highest age range of 51-60.
Multivariate Analyses
Retirement planning
For the first research objective dealing with H1a, H2a, and H3a, we examined the fac-tors that influence the probability of plan-ning for retirement using a logistic regression model. This model seems to be suitable, given the nature of the dependent variable, which indicates whether or not the respondents had started saving for their retirement. Survey-based research commonly uses a binary lo-gistic regression, where the dependent vari-able is dichotomous in nature and denotes an event or nonevent. In studies of retire-ment planning and financial literacy, the use
of logistic models has also been widely em-ployed (e.g., Volpe and Chen 1998; Alhenawi and Elkhal 2013)
The logistic regression model estimates the effect of certain explanatory variables on a variable y*, which, in this case, is the pro-pensity of being prepared for retirement. The latent variable model can be expressed as:
yi* = + Z
i + i ...(1)
where yi* is the unobserved individual
pro-pensity to save for retirement, Zi is a vec-tor of the independent variables (financial lit-eracy, risk aversion, expectations, and the control variables) observed for individual i, and are the parameters to be estimated, and the i are the unobserved error terms assumed to be independent of the other explanatory vari-ables. We ran the logistic regression and the results are shown in Table 3.
Model 1: Retirement Planning
Model 2: Retirement Portfolio Allocation
Variable Odds Ratio
(S.E)
Coefficients (S.E)
Behavioural Factors
Literacy 1.136
(0.145)
0.126** (0.084)
Risk Aversion 0.979
(0.106)
-0.247*** (0.070)
Expectation 1.440***
(0.199)
-0.047 (0.080)
Demographic Variables
Gender (Male) 0.669
(0.209)
0.364** (0.184)
Education 1.086
(0.427)
-0.051 (0.130)
Marital 1.186 0.456*
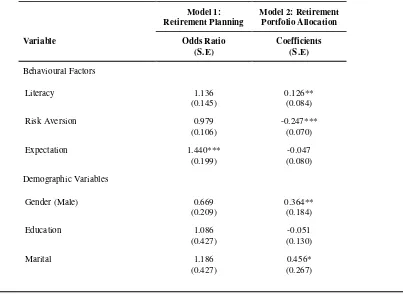
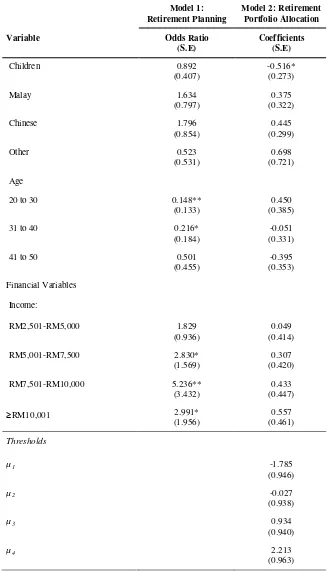
Table 3. Logistic Regression on Retirement Planning and Ordered Probit Regression
Model 1: Retirement Planning
Model 2: Retirement Portfolio Allocation
Variable Odds Ratio
(S.E)
Coefficients (S.E)
Children 0.892
(0.407)
-0.516* (0.273)
Malay 1.634
(0.797)
0.375 (0.322)
Chinese 1.796
(0.854)
0.445 (0.299)
Other 0.523
(0.531)
0.698 (0.721)
Age
20 to 30 0.148**
(0.133)
0.450 (0.385)
31 to 40 0.216*
(0.184)
-0.051 (0.331)
41 to 50 0.501
(0.455)
-0.395 (0.353)
Financial Variables
Income:
RM2,501-RM5,000 1.829
(0.936)
0.049 (0.414)
RM5,001-RM7,500 2.830*
(1.569)
0.307 (0.420)
RM7,501-RM10,000 5.236**
(3.432)
0.433 (0.447)
≥RM10,001 2.991*
(1.956)
0.557 (0.461)
Thresholds
µ1 -1.785
(0.946)
µ2 -0.027
(0.938)
µ3 0.934
(0.940)
µ4 2.213
(0.963)
Model 1: Retirement Planning
Model 2: Retirement Portfolio Allocation
Variable Odds Ratio
(S.E)
Coefficients (S.E)
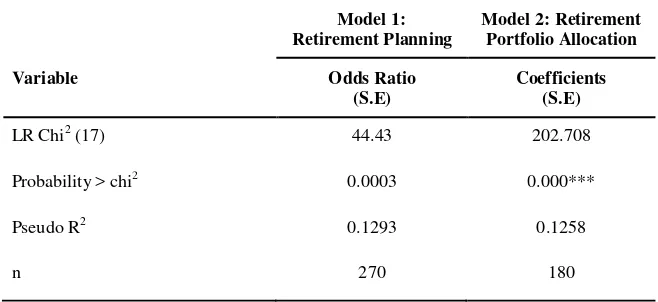
LR Chi2 (17) 44.43 202.708
Probability > chi2 0.0003 0.000***
Pseudo R2 0.1293 0.1258
n 270 180
Note:
(1) Model 1: Dependent variable is the odds ratio of planning for retirement versus not planning for retirement. (2) Model 2: Dependent variable is the portfolio allocation choice of 5 categories.
(3) Income 1 is the base group for Income, Age 4 is the base group for Age, Indian is the base group for Ethnicity. (4) ***, **, and * refer to p<0.01, p<0.05, and p<0.10, respectively.
Table 2.Continued
To test the overall goodness-of-fit of the model, we employed the Hosmer– Lemeshow test by collapsing the observations with the same predicted probabilities into ten groups (Hosmer et al. 2013). The results in-dicate that = 12.62. A probability > =
0.1255 indicates that the model cannot be rejected, and that the goodness-of-fit of the model is reasonable. The likelihood ratio of 44.43 (p < 0.01) suggests that the overall fit of the model is significantly better than that of a model with no explanatory variables. Out of the three main variables of in-terest, only expectations yielded significant re-sults. The results for expectations are posi-tive, suggesting that individuals with more positive expectations of the future economy are more likely to having started to plan for their retirement (OR = 1.44, p < 0.01). This contradicts the a priori notion that people who are more pessimistic about the future eco-nomic conditions are more likely to save for their future and have a retirement plan.
None-theless, a possible explanation is that the group of individuals with positive future ex-pectations may have more confidence in the financial system and would, hence, safely set aside their retirement savings in preparation for the future.
The relationship between the two other independent variables —financial literacy and
risk aversion— and the odds of being prepared for retirement were found to be statistically insignificant. Although the sign of the odds ratio for financial literacy supports our ear-lier prediction that higher financial literacy increases the odds of planning for retirement, the relationship is not significant (OR = 1.14,
private sector employees in Malaysia are still bound by defined benefit plans under the Employee Provident Fund (EPF), in which contributions by employees and employers are mandatory. Therefore, regardless of their fi-nancial literacy levels, the working respon-dents would already have a retirement plan implemented, via their mandatory contribu-tions to the Employees Provident Fund (EPF).
Similar insignificant results are seen for
risk aversion (OR = 0.979, p > 0.1). This re-sult suggests that the level of risk aversion does not appear to influence an individual’s retirement planning. The result contradicts that of Joo and Pauwels (2002), which indi-cated that individuals with lower levels of risk aversion are more confident about fac-ing retirement. This result may be due to the fact that the retirement funds of employees are mainly defined benefit plans managed through the EPF. Hence, the contributors’ risk aversion levels do not play a significant role in their level of planning. From the above results, we conclude that the evidence is in-sufficient to support H1a, H2a and H3a.
The results indicate some significant relationships between demographic variables and retirement preparedness. Of the control variables, income and age significantly impact the odds ratio of having a retirement plan. The results imply that higher income earners have a higher probability of having a retire-ment plan compared to the people in the low-est income category. The findings also reveal a significant impact of age on the odds of having a retirement plan. The results suggest that younger respondents were more likely to have a retirement plan than their older coun-terparts. These results support mass media reports that a significant number of elderly Malaysians are not financially prepared for retirement. A possible explanation is that
older individuals who are approaching retire-ment age perceive themselves as not having a plan for retirement, due to the imminent alarming reality of having no income to sup-port them during retirement.
Retirement portfolio allocation choice
To deal with the second objective of this study, we selected respondents who in-dicated a positive response to retirement planning, separating out those who did not. From the 270 responses, ninety observations were disregarded and 180 observations were used for further analysis. We employed an ordered probit regression model to examine the second research objective regarding the determinants of the retirement portfolio al-location choice. The ordered probit model is suitable for modelling dependent variables with categories of some qualitative rank or-der. In this case, respondents could have a retirement portfolio containing zero percent risky assets, about a quarter of their portfo-lio in risky assets, about half in risky assets, about three quarters in risky assets; or the entire portfolio in high-risk assets. These cat-egories represent an ordered form, but with no fixed magnitudes among the categories.
We estimate the ordered probit model using the following specification:
Ti* = z
i + i...(3)
where Ti* represents the dependent variable,
as the total portfolio equals 100 percent and the respondents may hold anything between 0 percent and 100 percent of risky assets in their retirement portfolio.
The portfolio allocation with ordered categories, Ti is determined from the model as follows:
where µ1 represents the thresholds to be esti-mated together with the parameter vector .
The results of the overall model indi-cate that the likelihood ratio is 202.70 (p
< 0.01) (Table 3). This suggests that the over-all model is acceptable, as it fits significantly better than a model with no predictors. The findings from the ordered probit model dem-onstrate that financial literacy and risk aversion
are significant determinants of the retirement portfolio allocation choice. The findings in-dicate that the marginal effect of a one unit increase in financial literacy increases the odds of having a higher allocation of risky assets ( = 0.13, p < 0.05), supporting H1b. The re-sults are consistent with other studies con-ducted in the context of other countries, such as the studies by van Rooij et al. (2011b), Yoong (2011), and Brown and Graf (2013), which show positive relationships between higher financial literacy and stock market participation. The results of this study imply that Malaysians who are more financially knowledgeable have a better understanding
of risky assets, and hence would have higher proportions of risky asset holdings in their portfolios than those who are financially il-literate.
Meanwhile, the results suggest that in-dividuals who are more risk averse will have a lower likelihood of holding a higher portion of risky assets in their portfolios, as shown by the negative sign of coefficient ( = -0.25,
p < 0.01). These results support H2b and are consistent with theoretical and empirical evi-dence that suggest a negative relationship between risk aversion and the holding of risky assets (e.g., Markowitz 1952; Eeckhoudt et al. 2005; Shum and Faig 2006; Chen et al. 2006; Schooley and Worden 1996; Bajtelsmit and Vanderhei 1997). The results of this study imply that individuals who are more risk averse have more confidence hold-ing risky assets in their portfolios. Meanwhile,
expectations of the future were found to be ir-relevant to the determination of a retirement portfolio allocation; there is thus no evidence to support H3b.
The positive coefficient for gender sug-gests that male respondents are more likely to have a higher proportion of risky assets in their retirement portfolios ( = 0.42, p < 0.01), supporting the findings of past re-searchers who demonstrated that men display more risk-taking behavior and have a higher probability of holding risky assets (e.g., Grable 2013, Sapienza et al. 2009; Bernasek and Shwiff 2001; Jianakoplos and Bernasek 1998; Palsson 1996).
or divorced individuals. However, those who had children had a lower probability of hold-ing risky assets in their portfolios ( = -0.52,
p < 0.1). The rationale behind this could be due to having more dependents under one’s care leads to more conservative investment strategies.
Discussion and Conclusion
In this study, the impact of behavioral factors on retirement planning decisions was investigated. This paper was built upon the notion that retirement planning involves a complex interaction of behavioral factors and financial skills; thus it contributes to the lit-erature by providing a comprehensive model that integrates these important elements that are required for long-term financial planning. Furthermore, the paper explored the deter-minants of retirement portfolio choice, which is still an under examined area, and intro-duced a simple ordinal measurement to pro-vide a rough indication of the proportion of risky assets held in a retirement savings port-folio.
In regards to the first research objective, the findings of this study reveal that income, age, and future expectations are significantly re-lated to the likelihood of having a retirement plan. In regards to the second research ob-jective, individuals with higher levels of fi-nancial literacy and risk aversion, as well as male and married individuals, have a higher likeli-hood of holding larger proportions of risky assets in their portfolios.
Contradicting prior expectations, this study reveals that those who are more posi-tive about the future, in terms of the economy, are the ones who are more likely to plan for their retirement. While the expected sign of relationship contradicts a priori, the
significance of this variable supports the lit-erature suggesting that individuals incorpo-rate uncertainty and expectations into their financial decision making and planning (Tarrazo and Gutierrez 2000). Expectations are important, as financial plans are long term in nature and are exposed to numerous inter-nal and exterinter-nal forces that may disrupt the intended objectives of these plans. A possible explanation for the positive impact of expec-tations and retirement planning is that indi-viduals with positive future expectations have more confidence in the financial system and can safely set aside their retirement savings in preparation for the future. In view of the indeterminate global economic environment, it is thus important for the government and policy makers to instill confidence in inves-tors regarding the future of the Malaysian economy, as this would also boost their con-fidence in saving for the long-term in the Malaysian financial market. It is also impor-tant for financial services marketers to edu-cate the public regarding long term invest-ments and the importance of planning for retirement, despite the volatile conditions of the economy. From the descriptive analyses, it is possible to identify the characteristics of respondents that have lower expectations of the economy, hence, policy makers should target these groups of people to boost their prospects and confidence and expectations of the Malaysian economy.
income groups and are Malays and Muslims. Hence, the regulators, policy makers and fi-nancial planners from the fifi-nancial services industry should target these groups of people to provide more financial education with the aim of improving their decisions on retire-ment allocations.
In view of the fact that the responsibil-ity for having adequate retirement savings has shifted from governments and employers to the individuals themselves, it is thus impor-tant for individuals to be equipped with more skills and financial knowledge, if they are to ensure that the plans they make meet their desired objectives. Defined contribution plans, such as the Private Retirement Scheme (PRS) is still considered to be in their initial stage in Malaysia. Hence, significant efforts should be implemented to increase individu-als’ participation in these plans to ensure that retirement goals are achieved.
Our results also indicate that those who are more risk averse are less likely to hold risky assets in their portfolios, supporting past studies (Shum and Faig 2006; Chen et al. 2006; Schooley and Worden 1996; Grable and Carr 2014). In addition, results also reveal that those who are more risk averse tend to be female, within the age group of 41-50 years old, and from the Malay ethnic group. Hence, financial services providers should try to attract these segment groups by designing medium-term fixed income investments to suit their risk tolerance levels. Introducing additional retirement savings instruments that are able to reduce the complexity of invest-ment decisions and offer some assurance and protection against economic uncertainties, may go a long way in giving financial security to those who are less risk tolerant. Malaysia’s Employees Provident Fund (EPF) should le-verage this information to properly assess investors according to their risk tolerance
lev-els, in order to encourage them to allocate their investments into the Private Retirement Scheme (PRS), which is a defined contribu-tion plan that offers a variety of funds for investors to select, according to their risk appetites. The scheme, which was introduced in 2011, can still be considered very new and remains relatively untapped, with much po-tential for growth.
This study has found that males were more likely to hold higher portions of risky assets in their portfolios, supporting the find-ings of other studies that have found men to be more risk tolerant than women (e.g., Chong et al. 2012; Duasa and Yusof 2013). This signals a good opportunity for financial marketers to target the female segment and educate them on the various financial prod-ucts according to risk and return. In fact, TheFinancialBrand.com (2013) indicates that marketing from financial institutions has fallen short, in terms of connecting with women on a more personal level, making them the least ventured market. The report further highlighted that boomer women may be a lu-crative segment, having not only an interest in financial services but also the resources to use them; however, financial marketers have failed to take this opportunity.
to hold high risk assets in their portfolios. With proper promotion and consumer edu-cation, investors should have the benefits of portfolio diversification explained to them, in order for them to meet their long term fi-nancial objectives.
Finally, no study is without limitations. Owing to the exploratory nature of the study, we acknowledge the fact that the sample was rather small and limited only to urban work-ing Malaysians in Kuala Lumpur. Hence, the respondents can be assumed to have been more exposed to financial matters than those in suburban or rural areas. Increasing the sample size to include different demograph-ics is certainly recommended for the purposes
of generalization and representation. In or-der to encapsulate the diversity of the coun-try, we recommend that the sample be ex-tended to a wider audience. For example, with regards to ethnicity, our study was limited only to the three main ethnic groups (Malaysians, Indians, and Chinese) whilst there are other ethnicities in East Malaysia. Besides that, future studies can also collaborate with policy makers, such as the government and the em-ployees’ provident fund agencies, to capture both public and private sector employees. This will not only benefit them, but also the nation as a whole, in ensuring the sustainability of the wealth and prosperity of its citizens.
Acknowledgements
We would like to acknowledge the financial support provided by the Ministry of Higher Education Malaysia under the Fundamental Research Grant Scheme (FRGS) No.FP025-2016, and also the Social Security Research Center (SSRC) (UM.E/SSRC/628/3/2) of University of Malaya, for guidance and support.
References
Alhenawi, Y., and K. Elkhal. 2013. Financial literacy of US households: Knowledge vs. long-term finan-cial planning. Financial Services Review 22: 211–244.
Athey, L. A., and A. B. Kennickell. 2005. Managing data quality on the 2004 survey of consumer finances. In Annual Meetings of the American Association for Public Opinion Research. Miami Beach, Florida, May 12–15.
Bajo, E., M. Barbi, and S. Sandri. 2015. Financial literacy, households’ investment behavior, and risk propensity. Journal of Financial Management, Markets and Institutions 3 (1): 157-174.
Bajtelsmit, V. L., and J. L. Van Derhei. 1997. Risk aversion and pension investment choices. Positioning Pensions for the Twenty-First Century 45: 66.
Bernasek, A., and S. Shwiff. 2001. Gender, risk, and retirement. Journal of Economic Issues 35 (2): 345–356. Bertaut, C. C., and M. Haliassos. 1997. Precautionary portfolio behavior from a life-cycle perspective.
Journal of Economic Dynamics and Control 21 (8): 1511–1542.
Brown, M., and R. Graf. 2013. Financial literacy and retirement planning in Switzerland. Numeracy 6 (2): 6. Burnett, J., K. Davis, C. Murawski, R. Wilkins, and N. Wilkinson. 2013. Measuring retirement savings
adequacy in Australia. JASSA 4: 28.
Chatterjee, S., and V. Zahirovic-Herbert. 2010. Retirement planning of younger baby-boomers: Who wants financial advice? Financial Decisions 22 (2): 1–12.
Chen, P., R. G. Ibbotson, M. A. Milevsky, and K. X. Zhu. 2006. Human capital, asset allocation, and life insurance. Financial Analysts Journal62 (1): 97-109.
Chin, Christina. 2015. Many senior citizens still cannot afford to retire. The Star Online. Retrieved from http://www.thestar.com.my/News/Nation/2015/08/02/Many-senior-citizens-still-cannot-afford-to-retire/
Chong, S. C., W. W. Cheong, B. K. Sia, and K. K. Ng. 2012. Perception of financial risk tolerance of older urban Chinese in Malaysia. International Journal of Academic Research 4: 28–23.
Duasa, J., and S. A. Yusof. 2013. Determinants of risk tolerance on financial assets ownership: A Case of Malaysia. International Journal of Business and Society 14 (1): 1–16.
Donkers, B., and A. van Soest. 1999. Subjective measures of household preferences and financial deci-sions. Journal of Economic Psychology 20: 613–642.
Eeckhoudt, L., C. Gollier, and H. Schlesinger. 2005. Economic and Financial Decisions under Risk. Princeton University Press.
Fintan, Ng. 2014. Savings now impacted by inflation. The Star Online (January 25). Retrieved from http:/ /www.thestar.com.my/Business/Business-News/2014/01/25/Savings-now-impacted-by-infla-tion-will-OPR-be-revised-with-expected-price-hikes/?style = biz
Gallery, N., G. Gallery, K. Brown, C. Furneaux, and C. Palm. 2011. Financial literacy and pension invest-ment decisions. Financial Accountability and Management 27 (3): 286–307.
Ghilarducci, T., J. Saad-Lessler, and K. Bahn. 2015. Are US workers ready for retirement? Trends in plan sponsorship, participation, and preparedness. Journal of Pension Benefits (Winter 2015. 25–39). Ferenczy Benefits Law Center. Available at http://ssrn.com/abstract = 2604299
Global AgeWatch Index 2015. Population Ageing Maps. Available at: http://www.helpage.org/global-agewatch/population-ageing-data/population-ageing-map/
Grable, J. E. 2013. Gender, wealth, and risk: Why are baby boomer women less risk tolerant than baby boomer men? Journal of Financial Service Professionals 67 (3): 7–9.
Grable, J. E., and N. A. Carr. 2014. Risk tolerance and goal-based financial planning. Journal of Financial Service Professionals 68 (1): 12–14.
Grable, J. E., and R. H. Lytton. 2003. The development of a risk assessment instrument: A follow-up study. Financial Services Review 12 (3): 257–274.
Guiso, L., T. Jappelli, and D. Terlizzese. 1996. Income risk, borrowing constraints, and portfolio choice. The American Economic Review 86 (1): 158–172.
Hanna, S. D., W. Waller, and M. S. Finke. 2008. The concept of risk tolerance in personal financial plan-ning. Journal of Personal Finance 7 (1): 96–108.
Hosmer Jr, D. W., S. Lemeshow, and R. X. Sturdivant. 2013. Applied Logistic Regression 398. John Wiley & Sons.
Hunt, S. D., R. D. Sparkman Jr. and J. B. Wilcox. 1982. The pretest in survey research: Issues and prelimi-nary findings. Journal of Marketing Research 19 (2): 269–273.
Huston, S. J. 2010. Measuring financial literacy. Journal of Consumer Affairs 44 (2): 296–316.
Jianakoplos, N. A., and A. Bernasek. 1998. Are women more risk averse? Economic inquiry 36 (4): 620–630. Joo, S. H., and V. W. Pauwels. 2002. Factors Affecting Workers’ Retirement Confidence: A Gender
Per-spective. Journal of Financial Counseling and Planning 13 (2).
Junarsin, E., and E. Tandelilin. 2008. Investment horizon to investment decision and mean reversion. Gadjah Mada International Journal of Business 10 (1): 77-112.
Kasten, G. W., and M. W. Kasten. 2011. The impact of aging on retirement income decision making. Journal of Financial Planning 24 (6).
Kimball, M. S. 1990. Precautionary saving in the small and in the large. Econometrica: Journal of the Economet-ric Society 53–73.
Lim, H., S. J. Heckman, C. P. Montalto, and J. Letkiewicz. 2014. Financial stress, self-efficacy, and financial help-seeking behavior of college students. Journal of Financial Counseling and Planning 25 (2): 148– 160.
Lusardi, A. 1999. Information, expectations, and savings for retirement. Behavioral Dimensions of Retirement Economics 81: 115.
Lusardi, A. 2003. Planning and saving for retirement. Working paper. Dartmouth College.
Lusardi, A., and O. S. Mitchell. 2007b. Financial literacy and retirement preparedness: Evidence and impli-cations for financial education. Business Economics 42 (1): 35–44.
Lusardi, A., and O. S. Mitchell. 2011. Financial literacy around the world: An overview. Journal of Pension Economics and Finance 10 (04): 497–508.
Markowitz, H. 1952. Portfolio selection. The Journal of Finance 7 (1): 77–91.
Merton, R. C. 2014. The crisis in retirement planning. Harvard Business Review 92 (7/8): 43-50.
Mitchell, O. S., and S. P. Utkus. 2003. Lessons from behavioral finance for retirement plan design. Philadel-phia: Pension Research Council. The Wharton School, University of Pennsylvania.
Modigliani, F., and R. H. Brumberg. 1954. Utility analysis and the consumption function: An interpretation of cross-section data. Franco Modigliani 1: 388–436.
Munnell, A. H., J. P. Aubry, and L. Quinby. 2011. Public pension funding in practice. Journal of Pension Economics and Finance 10 (2): 247–268.
National Opinion Research Center. 1996. Survey of Consumer Finances. Chicago: Federal Reserve Board. Pålsson, A. M. 1996. Does the degree of relative risk aversion vary with household characteristics? Journal
of Economic Psychology 17 (6): 771–787.
Poterba, J. M. 2014. Retirement security in an aging population. American Economic Review 104 (5): 1–30. Private Pension Administrator. 2014. About PRS. Private Retirement Scheme. Retrieved from http://
Sabri, M. F., and N. F. Zakaria. 2015. Financial well-being among young employees in Malaysia. In ZeynepCopur (Ed.), Handbook of Research on Behavioral Finance and Investment Strategies: Decision Mak-ing in the Financial Industry. Business Science Reference: 221.
Sapienza, P., L. Zingales, and D. Maestripieri. 2009. Gender differences in financial risk aversion and career choices are affected by testosterone. Proceedings of the National Academy of Sciences 106 (36): 15268–15273.
Schmeiser, M. D., and J. S. Seligman. 2013. Using the right yardstick: Assessing financial literacy measures by way of financial well being. Journal of Consumer Affairs 47 (2): 243–262.
Schooley, D. K., and D. Worden. 1996. Risk aversion measures: Comparing attitudes and asset allocation. Financial Services Review 5 (2): 87–99.
Sekita, S. 2011. Financial literacy and retirement planning in Japan. Journal of Pension Economics and Finance 10 (04): 637-656.
Shagar, L. K. 2016. Malaysians not saving enough for retirement. The Star Online (4 May). Retrieved from: http://www.thestar.com.my/news/nation/2016/05/04/malaysians-not-saving-enough-for-retire-ment/
Shum, P., and M. Faig. 2006. What explains household stock holdings? Journal of Banking & Finance 30 (9): 2579–2597.
Tan, H. K., and J. Y. Folk. 2011. Expected retirement age: A determinant of financial planning prepara-tion in Malaysia. African Journal of Business Management 5 (22): 9370.
Tarrazo, M., and L. Gutierrez. 2000. Economic expectations, fuzzy sets and financial planning. European Journal of Operational Research 126 (1): 89-105.
TheFinancialBrand.com. 2013. When Marketing to Women, Financial Brands Fall Way Short (December 4). Retrieved from http://thefinancialbrand.com/35365/marketing-financial-services-banking-to-women/
US National Opinion Research Center. 1996. Survey of Consumer Finances. Chicago: Federal Reserve Board. Van Rooij, M. C., A. Lusardi, and R. J. Alessie. 2011a. Financial literacy and retirement planning in the
Netherlands. Journal of Economic Psychology 32 (4): 593–608.
Van Rooij, M., A. Lusardi, and R. Alessie. 2011b. Financial literacy and stock market participation. Journal of Financial Economics 101 (2): 449–472.
Van Rooij, M. C., A. Lusardi, and R. J. Alessie. 2012. Financial literacy, retirement planning and household wealth. Economic Journal 122 (560): 449–478.
Volpe, R. P., and H. Chen. 1998. An analysis of personal financial literacy among college students. Financial Services Review 7: 107–128.
Winchester, D. D., S. J. Huston, and M. S. Finke. 2011. Investor prudence and the role of financial advice. Journal of Financial Service Professionals 65 (4): 43–51.
Yakoboski, P., and J. Dickemper. 1997. Increased saving but little planning. results of the 1997 retirement confidence survey. EBRI Issue Brief 191: 1-21.
Yuh, Y., P. C. Montalto, and S. D. Hanna. 1998. Are Americans prepared for retirement? Financial Counsel-ing and PlannCounsel-ing 9 (1): 13. Retrieved from http://ssrn.com/abstract = 132568