© The Author 2013. Published by Oxford University Press on behalf of the American Association for Public Opinion Research. All rights reserved. For permissions, please e-mail: [email protected]
Clarifying CategoriCal ConCepts in a
Web survey
Cleo Redline*
abstract Past research has shown that vague or ambiguous categorical concepts can be clarified through the use of definitions, instructions, or examples, but respondents do not necessarily attend to these clarifications. The present research investigates whether the presence of instructions or their placement modifies respondents’ concepts so that they are better aligned with research objectives. eight questions, modeled after major fed-eral surveys, were administered in one panel of a twelve-month Web panel survey to a nationally representative multistage area probability sample of addresses in the United States (n = 913 completed interviews). There is some evidence to suggest that, as predicted, respondents anticipate the end of a question and are more likely to ignore instructions placed after a question than before. Respondents answer more quickly when instructions come after the question, suggesting that they spend less time processing the instructions in this position, and their answers appear to be less consist-ent with research intconsist-entions. As predicted, implemconsist-enting instructions in a series of questions is more effective than the other approaches examined.
introduction
one reason that survey questions may not be clear (e.g., Belson 1981; Schober
and Conrad 1997) is that people categorize phenomena differently than
Cleo Redline is a senior research scientist with the national Center for education Statistics (nCeS), department of education, Washington, dC, USA. This work was conducted while she was a graduate student in the Joint Program for Survey Methodology at the University of Maryland. This work was supported by grants from the U.S. national Science Foundation [1024244 to Stanley Presser and C.R.] and the U.S. Bureau of the Census [YA1323-RFQ-06-0802 to Roger Tourangeau and C.R.]. data were collected in a study conducted under a national Science Foundation Major Research instrumentation Grant [0619956 to Jon A. Krosnick]. Any opinions, findings, conclu-sions, or recommendations expressed in this material are those of the author and do not necessarily reflect the view of the nSF, the Bureau of the Census, or the nCeS. The author would like to thank the editors, three anonymous reviewers, Roger Tourangeau, Katharine G. Abraham, Frederick G. Conrad, Kent l. norman, and norbert Schwarz for their many helpful comments and sugges-tions. *Address correspondence to Cleo Redline, nCeS, 1990 K Street, Room 9068, Washington, dC 20006, USA; e-mail: [email protected].
doi:10.1093/poq/nfs067
at Jordan University of Science and Technology on July 26, 2016
http://poq.oxfordjournals.org/
researchers intend (lakoff 1987; Smith 1995). To improve survey questions, researchers provide additional clarification, i.e., definitions, instructions, and examples (e.g., Conrad et al. 2006; Conrad, Schober, and Coiner 2007; Martin
2002; Tourangeau et al. 2010). For instance, allowing interviewers to give
defi-nitions has been shown to improve respondents’ understanding of researchers’ intentions (Schober and Conrad 1997; see also Conrad and Schober 2000).
Several factors may affect respondents’ use of such additional clarification. First, analysis of interviewer-respondent interaction has shown that respondents anticipate the end of a question and are more likely to interrupt information that comes after a question than information that comes before (e.g.,
Houtkoop-Steenstra 2002; oksenberg, Cannell, and Kalton 1991; Van der Zouwen and
dijkstra 2002). (See also Cannell et al. [1989] as discussed in Schaeffer [1991]).
This suggests that providing clarification before a question rather than after should lead to fewer interruptions and higher-quality data. However, the relation-ship between interruptions and data quality has proven inconsistent (dykema,
lepkowski, and Blixt 1997). one reason may be that when respondents’
situ-ations are straightforward (Conrad and Schober 2000; Conrad, Schober, and
Coiner 2007; Schober and Conrad 1997; Schober and Bloom 2004), not hearing
inapplicable clarification does not affect the quality of their answers.
Second, it has never been firmly established that respondents skip clarifi-cations at the end of a question when the clarification is presented visually, although eye-movement research has shown that respondents spend more time at the beginning of a question than at the end (Graesser et al. 2006). Providing clarification after a question may be genuinely more problematic in the audi-tory channel than in the visual (Martin et al. 2007); respondents can see that additional text follows the question in the visual channel, and they can read and reread it as needed (Just and Carpenter 1980).
Third, although clarification can improve respondents’ understanding of the intended meaning of a concept (e.g., Conrad, Schober, and Coiner 2007), it is possible that when this clarification is long and complex, it taxes work-ing memory or is ignored. Thus, it may be better to ask a series of questions rather than one question with clarification (Conrad and Couper 2004; Conrad
and Schober 2000; Couper 2008, p. 289; Fowler 1995, pp. 13–20; Schaeffer
and Presser 2003; Sudman, Bradburn, and Schwarz 1996, p. 31; Suessbrick,
Schober, and Conrad 2000; Tourangeau, Rips, and Rasinski 2000, pp. 38–40,
61). decomposition is one strategy in which the subcategories of a behavioral frequency report are requested in individual questions (e.g., Belli et al. 2000;
dykema and Schaeffer 2000; Means et al. 1994; Menon 1997). As Schaeffer
and dykema (2011) note, decomposing a general category into a set of more
specific categories and more specific questions is also a technique for imple-menting a definition and promoting clarity (see also Schaeffer and dykema
[2004]). one approach to decomposition would be to decompose a category
into more specific subcategories and provide these as instructions. Another approach would be to ask a series of questions.
at Jordan University of Science and Technology on July 26, 2016
http://poq.oxfordjournals.org/
This paper describes a Web survey experiment designed to investigate where and how to decompose general categorical concepts. The experiment examines whether decomposing categories into subcategories and presenting the subcategories as instructions affect how respondents interpret the general category; whether placing the instructions before the question is better than putting them after; and whether transforming the instructions into a series of questions yields answers more consistent with research objectives than asking one question with instructions.
Methods
deVeloPMenT And PRediCTionS
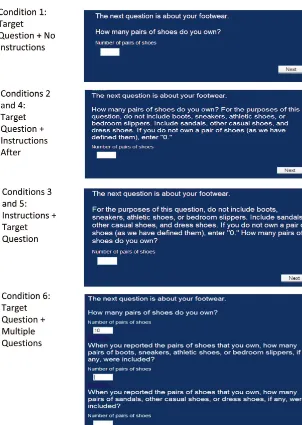
eight items, patterned after items from major federal surveys, were adminis-tered in a Web survey. The items asked about categorical concepts, including number of residents, shoes owned, coats owned, hours worked, number of trips, furniture purchases, number of bedrooms, and number of other rooms. The categories were decomposed into subcategories, and instructions were developed that directed respondents to exclude some of the subcategories that they might be likely to include in the category of interest. For example, as shown in figure 1, in the shoe question, respondents were instructed to exclude boots, sneakers, athletic shoes, and bedroom slippers. To increase the mag-nitude of the effect of the instructions, an attempt was made to exclude at least one subcategory that most people would possess and be likely to include unless told otherwise, so that the mean would be lower if respondents followed the instructions. For example, the instructions for the shoe question directed respondents to exclude sneakers because it was assumed that most people own sneakers and think of sneakers as shoes. The instructions were also intention-ally lengthy in order to provide a condition under which multiple questions might excel.
The multiple questions were developed by transforming the instructions into a series of questions, as recommended by Fowler (1995, p. 17). The method allowed for the manipulation of question structure while preserving the order and wording of the subcategories (except for inserting a phrase at the begin-ning of each of the follow-up questions to refer back to the first question in the series).1 Because the mean should be lower if respondents followed
instruc-tions and excluded subcategories, the mean for the control condition should be higher than the mean for the instruction condition, which in turn should be higher than the mean for the multiple-question condition.
1. The items underwent a number of revisions based on the advice of two outside expert reviewers and a small pretest (n = 12). (See appendix A for question wording.)
at Jordan University of Science and Technology on July 26, 2016
http://poq.oxfordjournals.org/
exPeRiMenTAl CondiTionS
Three main conditions were compared in this experiment: no instructions (the control condition), instructions, and a multiple-question approach. A facto-rial experiment was embedded within the instructions condition, with two orders of presenting the instructions (after/before) crossed with two font styles (same font as the question/italics). Thus, the overall design had six conditions; however, font was not shown to have any effect. some of the results collapse across the font condition, and in some analyses the font condition is retained to reflect the design.
Figure 1 shows how the information appeared on the screen for the six
con-ditions, combining those that varied font. Questions always began on a new line, so that questions and instructions were one continuous paragraph in the instruction conditions, and each new question started on a new line in the multiple-question condition. The multiple questions were presented on the same screen to ensure that respondents had the same opportunity to review subcategories in this condition as in the other conditions. The multiple tions were presented dynamically, such that only the relevant follow-up ques-tions were administered based on the prior responses. For example, if a person reported having five persons in a household, all of whom were adults, they were not then asked how many children were in the household. Prior ques-tions and responses remained on the screen, as subsequent quesques-tions were presented. The wording of these subsequent questions was not modified based on prior responses.
FolloW-UP QUeSTionS
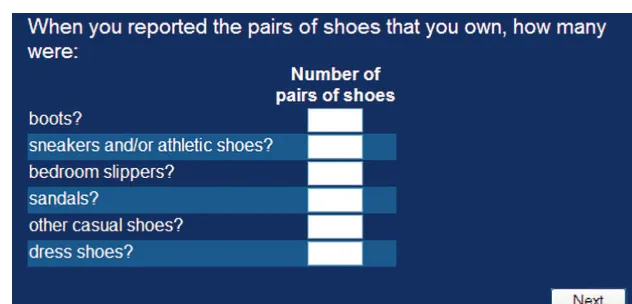
Two follow-up questions were also developed for the shoes and hours worked items. These questions asked respondents to further decompose their reports about shoes and hours worked into individual subcategories (see figure 2). Respondents were unable to return to the previous experimental items and change their answers. These follow-up questions provide a second measure for determining which of the conditions elicited the most consistent reporting (see
Conrad and Schober [2000] for a similar method).
dATA ColleCTion And SAMPle
This experiment was administered in the eleventh wave (August 1 through october 31, 2009) of a twelve-month Web panel survey to a national multi-stage area probability sample of addresses in the United States. in the summer of 2008, interviewers from Abt SRBi visited the selected addresses, randomly selected an adult member, conducted a brief interview, and offered a free laptop and high-speed connection in exchange for agreeing to complete a thirty-min-ute, secure internet survey once a month, beginning in october 2008. The tar-get population was adults, eighteen years or older, residing in the United States.
at Jordan University of Science and Technology on July 26, 2016
http://poq.oxfordjournals.org/
The overall unweighted response rate for the initial 1,000 recruits in the twelve-month panel survey was 42.5 percent (AAPoR RR4) (Sakshaug et al. 2009). of the 1,000 respondents who were recruited into the twelve-month panel, 913 responded in the eleventh wave, yielding a cumulative response rate of 38.8 percent (42.5 percent x 91.3 percent) (Callegaro and diSogra 2008).
figure 1. overview of the experimental Conditions using the Wording of the shoe Question to illustrate.
at Jordan University of Science and Technology on July 26, 2016
http://poq.oxfordjournals.org/
The items reported here were part of a larger questionnaire that included three other experiments and asked twenty-seven questions in all. The items reported about here appeared in fixed locations, as questions 1, 8, 9, 10, 12, 13, 17, 18, 26, and 27. Respondents were randomly assigned to one of the treatments for all items.
results
MeAn ReSPonSeS
Some respondents reported extreme numbers in response to the items. Responses that were above the upper first percentile for each item were dropped.2,3 in the multiple-question condition, responses were calculated from
respondents’ answers to the set of questions. For example, answers to the shoe question were derived by subtracting the number reported in the second ques-tion from the number reported in the first. Resulting negative values were set to missing.4
Table 1 displays the mean response for each of the items for the three main
experimental conditions, and table 2 displays select test statistics. A one-way figure 2. follow-up item to the shoe Question.
2. The cutoff and the number of responses removed for each item were: residents > 8 (9 values); shoes > 100 (5 values); coats > 35 (9 values); hours worked > 70 (9 values); trips > 24 (9 values); furniture > 8 (9 values); bedrooms > 6 (5 values); and rooms > 12 (9 values). The analysis was run with and without the outliers. The conclusions remain the same.
3. Top coding with the cutoff values did not change the conclusions.
4. This was deemed the most conservative approach because leaving them negative or setting them to zero advanced the hypothesis of lowering the mean for the wrong reason. The number of negative values set to missing for each item were: residents (1 value); coats (12 values); hours worked (4 values); trips (4 values); rooms (8 values).
at Jordan University of Science and Technology on July 26, 2016
http://poq.oxfordjournals.org/
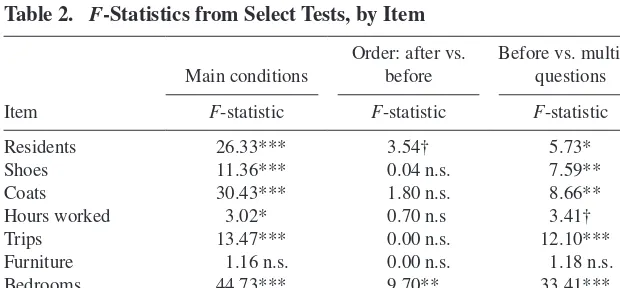
AnoVA tested whether the group means differed from each other. Seven of the eight items were significantly different. only one item, hours worked, revealed a nonsignificant reversal between the control and the instruction conditions. table 2. F-statistics from select tests, by item
item
F-statistic F-statistic F-statistic
Residents 26.33*** 3.54† 5.73*
Shoes 11.36*** 0.04 n.s. 7.59**
Coats 30.43*** 1.80 n.s. 8.66**
Hours worked 3.02* 0.70 n.s 3.41†
Trips 13.47*** 0.00 n.s. 12.10***
Furniture 1.16 n.s. 0.00 n.s. 1.18 n.s.
Bedrooms 44.73*** 9.70** 33.41***
Rooms 61.49*** 4.80* 30.17***
note.—F-statistics from the test of the main conditions are from one-way AnoVAS; all are based on two numerator degrees of freedom. F-statistics from the test of after vs. before are from two-way AnoVAS of the embedded experiment, order crossed with font; all are based on one degree of freedom. F-statistics from the test of before vs. multiple questions are from one-way AnoVAS; all are based on one degree of freedom.
***p < 0.001; **p < 0.01; *p < 0.05; †p < 0.10; n.s. denotes not significant table 1. Mean response (and sample sizes) for eight items by experimental Conditions
Residents 3.0 (174) 2.4 (572) 2.0 (148) 2.5 (293) 2.3 (279) Shoes 13.8 (176) 10.3 (576) 7.0 (151) 10.2 (297) 10.4 (279) Coats 6.0 (175) 4.1 (572) 2.6 (140) 4.3 (294) 3.8 (278) Hours worked 21.4 (177) 24.3 (572) 20.2 (147) 24.5 (292) 24.0 (280) Trips 2.9 (174) 2.2 (575) 1.3 (149) 2.2 (295) 2.2 (280) Furniture 0.7 (177) 0.6 (574) 0.5 (152) 0.6 (296) 0.6 (278) Bedrooms 3.0 (177) 2.7 (573) 1.8 (153) 2.8 (294) 2.5 (279) Rooms 4.5 (174) 3.4 (569) 2.0 (145) 3.6 (292) 3.2 (277)
note.—Responses that were greater than the upper first percentile for each individual item were dropped.
at Jordan University of Science and Technology on July 26, 2016
http://poq.oxfordjournals.org/
The means of the remaining seven items had the predicted decreasing pattern, and all but furniture had means that differed significantly across conditions. in these seven items, the results of pairwise t-tests (not shown here) between the control and the instructions conditions and between the instructions and multiple-question conditions are consistent with the predicted decreasing pat-tern in all but the furniture item.
Focusing just on the order in which the instructions were placed, table 1 also shows that the mean was lower when the instructions came before than after the question in five of the eight items, and table 2 shows that this dif-ference was significant in two of the eight and marginally significant in one of the eight. The overall effect of the order in which the instructions were placed was evaluated using repeated measures MAnoVA, after standardizing the responses to each question to have a mean of 0 and a standard deviation of 1. A two-way repeated measures MAnoVA on the standardized means with order and font as independent variables revealed a significant overall main effect for order (F (1,540) = 6.33, p < 0.05).
Finally, table 1 shows that the mean was lower when asking multiple questions than when the instructions were placed before the question in all eight of the items, and table 2 shows that this difference was significant for six of the items.
ReSPonSeS To THe FolloW-UP QUeSTionS
The second outcome variable was whether respondents excluded the subcate-gories they were instructed to exclude in the shoe and hours worked items. For example, respondents who reported no slippers, boots, sneakers, or athletic shoes in response to the shoe follow-up question were coded as consistent with the instructions. if respondents reported not owning any shoes (or not having worked) in response to the original questions, the follow-up questions were coded as consistent with the instructions (because the questions were worded such that zero was an acceptable response).
Table 3 reveals that answers to the shoe question were consistent with
researchers’ intentions nearly half the time in the presence of instructions. in the hours worked question, although the percentages were significantly different across all three groups, the percentages were not significantly dif-ferent between the control and instructions group: (χ2(1, N = 527) = 2.32,
n.s.). Thus, the addition of instructions did not improve consistency in this question.5 in addition, a logistic regression model was fitted in the instruction
conditions to test the consistency of respondents’ answers when controlling for the order and the font of the instructions; neither variable, nor their interac-tion, had an effect.
5. People who were not employed were excluded from the results presented here. However, the overall pattern looked similar when the unemployed were included. employment was based on respondents’ answers to a screener question at the time of recruitment into the survey panel.
at Jordan University of Science and Technology on July 26, 2016
http://poq.oxfordjournals.org/
table 3. percentage of Consistent responses (and sample sizes) for the two follow-up items by experimental Conditions
Main conditions embedded conditions
Follow-up item
no instructions % (n)
instructions % (n)
First question of multiple questions
% (n) χ22
instructions after % (n)
instructions before
% (n) χ2
Shoes 1.1 (176) 49.6 (575) 6.6 (151) 199.9*** 48.0 (296) 51.3 (279) 0.5 n.s. Hrs. worked 72.2 (115) 78.8 (412) 55.2 (105) 24.3*** 85.2 (291) 75.6 (205) 2.6 n.s.
note.—Persons who were not employed (according to a screener question) were excluded from the hours worked item. Chi-squared values for the three main conditions are based on two degrees of freedom.
Chi-squared values for the after vs. before comparison are based on one degree of freedom from a logistic regression model when controlling for the order and font of the instructions.
***p < 0.001; n.s. denotes not significant
97
ReSPonSe TiMeS
The third outcome variable was the amount of time it took respondents to read and answer the items. As often occurs in reaction time studies, there were out-liers in the data. The slowest one percent of the times for each individual item were dropped from the analysis.6,7
A one-way AnoVA showed that response time was significantly different across the three main conditions (F (2, 910) = 155.64, p < 0.001). it took more time to answer each of the eight topics when there were multiple questions (335.7 seconds) than it took to answer the eight questions with instructions (217.7 seconds) (F (1,733) = 142.48, p < 0.001) or the eight questions without instructions (139.1 seconds) (F (1,758) = 91.8, p < 0.001).
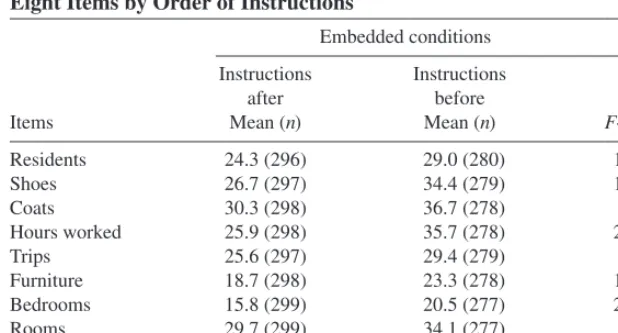
As shown in table 4, respondents spent significantly less time on all eight items when the instructions came after than before the question. Taken together, respondents spent nearly 45 fewer seconds reading and processing the instructions when they came after than before the question. This averages out to about 5 seconds less per item.
table 4. Mean response time in seconds (and sample sizes) for the eight items by order of instructions
embedded conditions
instructions after Mean (n)
instructions before Mean (n)
items F-statistic
Residents 24.3 (296) 29.0 (280) 13.5***
Shoes 26.7 (297) 34.4 (279) 17.6***
Coats 30.3 (298) 36.7 (278) 7.5**
Hours worked 25.9 (298) 35.7 (278) 22.4***
Trips 25.6 (297) 29.4 (279) 6.1**
Furniture 18.7 (298) 23.3 (278) 15.7***
Bedrooms 15.8 (299) 20.5 (277) 25.9***
Rooms 29.7 (299) 34.1 (277) 6.9**
Total 195.6 (300) 240.1 (282) 27.8***
note.—Slowest one percent of times for each individual item were dropped. F-statistics for the individual items are from two-way AnoVAS of the embedded experiment, order crossed with font; all are based on one degree of freedom.
***p < 0.001; **p < 0.01
6. The cutoffs and the number of times removed for each item were: residents > 95 seconds (6 values); shoes > 253 (6 values); coats > 281 (6 values); hours worked > 446 (6 values); trips > 170 (6 values); furniture > 93 (6 values); bedrooms > 150 (6 values); rooms > 145 (6 values). 7. Top coding with the cutoff times did not change the conclusions.
at Jordan University of Science and Technology on July 26, 2016
http://poq.oxfordjournals.org/
Conclusion
Mean responses were lower in the presence of instructions designed to lower respondents’ answers. For example, respondents reported owning fewer pairs of shoes when instructed to exclude sneakers. This suggests that if a survey’s definitions differ from respondents’ definitions, then surveys will need to clarify the difference. on average, responses were significantly higher and less time was devoted to the items when the instructions followed the ques-tions than when they preceded them. This suggests that respondents paid a little less attention to instructions that follow a conversational endpoint (the end of a question) and perhaps answer prematurely, even with questions pre-sented visually. Still, providing instructions was not as effective as asking multiple questions. This approach may have forced respondents to pay more attention to the subcategories. Also, the shortened questions required keeping less information in memory and respondents needed only to report the sub-quantities sequentially under this condition, which meant they did not need to hold these quantities in memory nor did they need to perform any mental arithmetic with them. However, achieving alignment between respondents’ answers and survey researchers’ expectations does appear to take more time. it took respondents about 42 seconds, on average, to read and answer one of the multiple-question series, compared to taking about 27 seconds to read and respond to one of the questions with instructions. in addition, a few respond-ents reported responses in the multiple-question condition that resulted in negative derived values that could probably be mitigated in Web surveys by letting respondents know immediately when such a mistake occurs. However, this problem warrants further research.
in theory, these findings should apply equally to clarifications that exclude commonly counted categories as those that include commonly omitted cat-egories. And the findings should apply to a combination of these clarifica-tions, although this latter condition will be more difficult to test without prior knowledge regarding the expected net result (or some other form of valida-tion). Future research is needed to investigate these and other issues.
at Jordan University of Science and Technology on July 26, 2016
http://poq.oxfordjournals.org/
Question Target question instructionsa Multiple questions
1 How many people are currently living or staying at this address?
do not forget to count yourself. For the pur-poses of this question, a person is defined as someone 18 years or older. do not include chil-dren 17 years or younger. do not include any-one who is living somewhere else for more than 2 months, such as a college student living away or someone in the armed forces on deployment.
1a. Target question b. When you reported the number of people living or staying at this address, counting yourself, how many of them were 18 years or older? c. When you reported the number of people living or staying at this address, how many of them were children 17 years or younger? d. When you reported the number of people liv-ing or stayliv-ing at this address, how many of them, if any, are currently living someplace else for more than two months, like a college student or someone in the armed forces on deployment?
2 Please refer to figure 1
for this item.
3 How many coats and jackets do you own?
For the purposes of this question, exclude coats and jackets for indoor use, such as sports coats, tailored jackets, blazers, or suits. include out-erwear that is made from down or synthetic sources, such as polyester or acrylic. do not include outerwear that is made from natural sources, such as fur, leather, wool, cotton, or canvas. if you do not own a coat or jacket (as we have defined them), enter “0.”
3a. Target question b. When you reported the num-ber of coats and jackets that you own, how many coats and jackets for indoor use, such as sports coats, tai-lored jackets, blazers, or suits, if any, were included? c. When you reported the number of coats and jackets that you own, how many of them, if any, were outerwear made from down or synthetic sources, such as polyester or acrylic? d. When you reported the number of coats and jackets that you own, how many of them, if any, were out-erwear made from natural sources, such as fur, leather, wool, cotton, or canvas?
Wording of the target items, instructions, and Multiple Questions
Continued
Redline
Continued Question Target question instructionsa Multiple questions
4 last week, how many hours, if any, did you work for either pay or profit?
For the purposes of this question, do not count as work telecommuting or working from home. in addition, do not count time spent surfing the Web, working on personal matters, or social-izing as work. if you did not work for pay or profit last week (as we have defined it), enter “0.”
4a. Target question b. When you reported the hours you worked last week, how many hours, if any, were spent telecommuting or working from home? c. When you reported the hours you worked last week, how many hours, if any, were spent surfing the Web, working on per-sonal matters, or socializing?
5 in the past year, how many times, if any, were you away from home on a trip?
For the purposes of this question, only report times when you were away from home for 3 or more nights in a row. exclude all business trips. if you were not away from home (as we have defined it) in the past year, enter “0.”
5a. Target question b. When you reported the number of times you were away from home, how many of them, if any, were for 3 or more nights? c. When you reported the number of times you were away from home for 3 or more nights, how many of them, if any, were for business?
6 in the past year, how many furniture pur-chases, if any, did you make?
For the purposes of this question, do not include items such as TVs, radios, lamps and lighting fixtures, outdoor furniture, infants’ furniture, or appliances as furniture. include items such as tables, chairs, footstools, or sofas as furniture. if you did not purchase any furniture (as we have defined it) in the past year, enter “0.”
6a. Target question b. When you reported purchasing fur-niture in the past year, how many of these purchases, if any, included TVs, radios, lamps and lighting fixtures, outdoor furniture, and infants’ furniture or appliances? c. When you reported purchasing furniture in the past year, how many of these purchases, if any, included tables, chairs, footstools, sofas, and so on?
101
Question Target question instructionsa Multiple questions
7 How many bedrooms are in this house, apartment, or mobile home?
For the purposes of this question, only include those bedrooms located on the main floor of this house, apartment, or mobile home. if you do not have any bedrooms (as we have defined them), enter “0.” if this is an efficiency/studio apartment, enter “0.”
7a. Target question b. When you reported the number of bedrooms in this house, apartment, or mobile home, how many bedrooms located on the main floor, if any, were included? c. is this is an efficiency or studio apartment?
8 How many other sepa-rate rooms are in this house, apartment, or mobile home?
For the purposes of this question, rooms must be separated by built-in archways or walls that extend out at least 6 inches and go from floor to ceiling. exclude bedrooms, bathrooms, laun-dry rooms, porches, balconies, foyers, halls, or unfinished basements.
8a. Target question b. How many other rooms are in this house, apartment, or mobile home that are separated by built-in archways or have walls that extend out at least 6 inches and go from floor to ceiling? c. When you reported the number of other rooms in this house, apart-ment, or mobile home, how many bedrooms, bathrooms, laundry rooms, porches, balconies, foyers, halls, or unfin-ished basements, if any, were included?
ainstructions were placed either after or before the target question, depending on the experimental condition.
Redline
total number of respondents and percentage of respondents (and sample sizes), by the six experimental Conditions and
questions χ2 statistic
Total number of respondents 178 161 163 139 119 153
Male 32.4 41.0 43.0 39.0 43.0 43.0 χ2 (5, N = 770)
White 82.0 81.3 72.2 78.4 76.3 72.1
other
Some college 45.5 57.8 54.0 54.7 55.1 44.4
College degree
35–44 years 23.1 22.2 25.2 22.0 22.0 27.3
45–54 years 27.2 21.5 17.8 27.1 23.0 19.5
55 years and older
*p < 0.05; n.s. denotes not significant
103
references
Belli, Robert F., norbert Schwarz, eleanor Singer, and Jennifer Talarico. 2000. “decomposition Can Harm the Accuracy of Behavioral Frequency Reports.” Applied Cognitive Psychology
14:295–308.
Belson, William A. 1981. The Design and Understanding of Survey Questions. Aldershot, UK: Gower.
Callegaro, Mario, and Charles diSogra. 2008. “Computing Response Metrics for online Panels.”
Public Opinion Quarterly 72:1008–32.
Cannell, Charles F., lois oksenberg, Graham Kalton, Katherine Bischoping, and Floyd J. Fowler. 1989. “new Techniques for Pretesting Survey Questions: Final Report.” Grant no. HS 05616. national Center for Health Services Research Health Care Technology Assessment.
Conrad, Frederick G., and Mick P. Couper. 2004. “Usability, Comparability, and data Quality across Modes and Technologies in Census data Collection.” Technical Report prepared for the U.S. Census Bureau through the Gunnison Consulting Group and the University of Michigan. Conrad, Frederick G., Mick P. Couper, Roger Tourangeau, and Andy Peytchev. 2006. “Use and
non-Use of Clarification Features in Web Surveys.” Journal of Official Statistics 22:245–69. Conrad, Frederick G., and Michael F. Schober. 2000. “Clarifying Question Meaning in a
Household Telephone Survey.” Public Opinion Quarterly 64:1–28.
Conrad, Frederick G., Michael F. Schober, and Tania Coiner. 2007. “Bringing Features of Human dialogue to Web Surveys.” Applied Cognitive Psychology 21:165–88.
Couper, Mick P. 2008. Designing Effective Web Surveys. new York: Cambridge University Press. dykema, Jennifer, James M. lepkowski, and Steven Blixt. 1997. “The effect of interviewer and
Respondent Behavior in data Quality: Analysis of interaction Coding in a Validation Study.” in Survey Measurement and Process Quality, edited by l. lyberg, P. Biemer, M. Collins, e. deleeuw, C. dippo, n. Schwarz, and d. Trewin, 287–310. new York: Wiley-interscience. dykema, Jennifer, and nora Cate Schaeffer. 2000. “events, instruments, and Reporting errors.”
American Sociological Review 65:619–29.
Fowler, Floyd J. 1995. “improving Survey Questions: design and evaluation.” in Applied Social Research Methods Series, vol. 38. Thousand oaks, CA: Sage Publications.
Graesser, Arthur C., Zhiqiang Cai, Max M. louwerse, and Frances daniel. 2006. “Question Understanding Aid (QUAid): A Web Facility That Tests Question Comprehensibility.” Public Opinion Quarterly 70:3–22.
Houtkoop-Steenstra, Hanneke. 2002. “Question Turn Format and Turn-Taking Problems in Standardized interviews.” in Standardization and Tacit Knowledge: Interaction and Practice in the Survey Interview, edited by douglas W. Maynard, Hanneke Houtkoop-Steenstra, nora Cate Schaeffer, and Johannes van der Zouwen, 243–59. new York: John Wiley and Sons. Just, Marcel A., and Patricia A. Carpenter. 1980. “A Theory of Reading: From eye Fixations to
Comprehension.” Psychological Review 87:329–54.
lakoff, George. 1987. Women, Fire, and Dangerous Things: What Categories Reveal about the Mind. Chicago: University of Chicago Press.
Martin, elizabeth. 2002. “The effects of Questionnaire design on Reporting of detailed Hispanic origin in Census 2000 Mail Questionnaires.” Public Opinion Quarterly 66:583–93.
Martin, elizabeth, Jennifer Hunter Childs, Theresa deMaio, Joan Hill, Courtney Reiser, eleanor Gerber, Kathleen Styles, and don dillman. 2007. “Guidelines for designing Questionnaires for Administration in different Modes.” Technical Report. Washington, dC: U.S. Bureau of the Census.
Means, Barbara, Gary e. Swan, Jared B. Jobe, and James l. esposito. 1994. “The effects of estimation Strategies on the Accuracy of Respondents’ Reports of Cigarette Smoking.” in
Autobiographical Memory and the Validity of Retrospective Reports, edited by norbert Schwarz and Seymour Sudman, 107–20. new York: Springer-Verlag.
Menon, Geeta. 1997. “Are the Parts Better Than the Whole? The effects of decompositional Questions on Judgments with Frequent Behaviors.” Journal of Marketing Research 34:335–46.
at Jordan University of Science and Technology on July 26, 2016
http://poq.oxfordjournals.org/
oksenberg, lois, Charles Cannell, and Graham Kalton. 1991. “new Strategies for Pretesting Survey Questions.” Journal of Official Statistics 7:349–65.
Sakshaug, Joseph, Roger Tourangeau, Jon A. Krosnick, Allison Ackermann, Ari Malka, Matthew deBell, and Chintan Turakhia. 2009. “dispositions and outcome Rates in the Face-to-Face internet Survey Platform.” Paper presented at the Annual Meeting of the American Association of Public opinion Research, Hollywood, Florida.
Schaeffer, nora Cate. 1991. “Conversation with a Purpose—or Conversation? interaction in the Standardized interview.” in Measurement Errors in Surveys, edited by P. P. Biemer, R. M. Groves, l. e. lyberg, n. A. Mathiowetz, and S. Sudman, 367–92. new York: John Wiley and Sons.
Schaeffer, nora Cate, and Jennifer dykema. 2004. “A Multiple-Method Approach to improving the Clarity of Closely Related Concepts: distinguishing legal and Physical Custody of Children.” in Methods for Testing and Evaluating Survey Questionnaires, edited by S. Presser, J. M. Rothgeb, M. P. Couper, J. T. lessler, e. Martin, J. Martin, and e. Singer, 475–502. new York: Springer-Verlag.
———. 2011. “Questions for Surveys.” Public Opinion Quarterly 75:909–61.
Schaeffer, nora Cate, and Stanley Presser. 2003. “The Science of Asking Questions.” Annual Review of Sociology 29:65–88.
Schober, Michael F., and Jonathan e. Bloom. 2004. “discourse Cues That Respondents Have Misunderstood Survey Questions.” Discourse Processes 38:287–308.
Schober, Michael F., and Frederick G. Conrad. 1997. “does Conversational interviewing Reduce Survey Measurement error?” Public Opinion Quarterly 61:576–602.
Smith, edward e. 1995. Concepts and Categorization. in Thinking: An Invitation to Cognitive Science, edited by edward Smith and daniel n. osherson, 3–33. 2nd ed. Cambridge, MA: MiT Press.
Sudman, Seymour, norman M. Bradburn, and norbert Schwarz. 1996. Thinking about Answers: The Application of Cognitive Processes to Survey Methodology. San Francisco: Jossey-Bass. Suessbrick, Anna, Michael F. Schober, and Frederick G. Conrad. 2000. “different Respondents
interpret ordinary Questions Quite differently.” in Proceedings of the American Statistical Association: Section on Survey Research Methods, 907–12. Alexandria, VA: American Statistical Association.
Tourangeau, Roger, Frederick G. Conrad, Mick P. Couper, and Cong Ye. 2010. “Providing examples in Survey Questions.” Unpublished manuscript.
Tourangeau, Roger, lance J. Rips, and Kenneth Rasinski. 2000. The Psychology of Survey Response. new York: Cambridge University Press.
Van der Zouwen, Johannes, and Wil dijkstra. 2002. “Testing Questionnaires Using interaction Coding in Standardized interviews.” in Standardization and Tacit Knowledge, edited by d. W. Maynard, H. Houtkoop-Streenstra, J. van der Zouwen, and n. C. Schaeffer, 427–47. new York: John Wiley and Sons.
at Jordan University of Science and Technology on July 26, 2016
http://poq.oxfordjournals.org/