Experimental Physiology –
Review Article
Non-invasive pulsatile arterial pressure and stroke volume
changes from the human finger
Lysander W. J. Bogert and Johannes J. van Lieshout
Department of Internal Medicine & Cardiovascular Research Institute Amsterdam, Academic Medical Centre, University of Amsterdam, the Netherlands
In this paper we review recent developments in the methodology of non-invasive finger arterial pressure measurement and the information about arterial flow that can be obtained from it. Continuous measurement of finger pressure based on the volume-clamp method was introduced in the early 1980s both for research purposes and for clinical medicine. Finger pressure tracks intra-arterial pressure but the pressure waves may differ systematically both in shape and magnitude. Such bias can, at least partly, be circumvented by reconstruction of brachial pressure from finger pressure by using a general inverse anti-resonance model correcting for the difference in pressure waveforms and an individual forearm cuff calibration. The Modelflow method as implemented in the Finometer computes an aortic flow waveform from peripheral arterial pressure by simulating a non-linear three-element model of the aortic input impedance. The methodology tracks fast changes in stroke volume (SV) during various experimental protocols including postural stress and exercise. If absolute values are required, calibration against a gold standard is needed. Otherwise, Modelflow-measured SV is expressed as change from control with the same precision in tracking. Beat-to-beat information on arterial flow offers important and clinically relevant information on the circulation beyond what can be detected by arterial pressure.
(Received 8 February 2005; accepted after revision 21 March 2005; first published online 31 March 2005)
Corresponding authorJ. J. van Lieshout: Department of Internal Medicine, Room F7-205, Academic Medical Centre, University of Amsterdam, PO Box 22700, 1100 DE Amsterdam, the Netherlands. Email: [email protected]
‘...it is a matter of necessity that the blood perform a circuit, that it returns to whence it set out’ W. Harvey, 1628
Introduction
The first recorded blood pressure measurement was made in 1718 when Stephen Hales inserted a brass pipe into an artery of a horse, connected it to a glass tube and observed the rise of blood in the pipe (Hales, 1733). Karl Vierordt found, in 1855, that with an inflatable cuff around the arm to constrict the artery, the arterial pulse could be obliterated (Vierordt, 1855). Etienne Jules Marey, a French physician and cinematographer, developed this idea further. In 1860 his sphygmograph could measure the pulse rate accurately, but was quite unreliable in determining blood pressure (Marey, 1878).
Landois (1872) demonstrated the pulsatile nature of blood pressure by inserting the hollow needle of a syringe
into an artery of a dog while moving a paper strip across the point where the blood droplets hit the table. Von Basch (1881) developed the sphygmomanometer and Riva Rocci (1896) reported on ‘Un nuovo sfigmomanometro’. The subsequent introduction of this mercury sphygmomanometer in medicine is largely due to Harvey Cushing (1903) who recognized its clinical value and forwarded the monitoring of blood pressure in patients during anaesthesia. However, by noticing the disappearance of the pulse via palpitation, only systolic blood pressure could be determined until Nikolai Korotkoff (1905), by use of a stethoscope, found the characteristic sounds of the turbulent passage of blood made by the constriction of the artery at certain points during cuff inflation and deflation.
are measured by a transducer and fed into a microprocessor that also controls the sequence of cuff inflation and deflation. Mean arterial pressure is determined through a transducer that detects the maximum oscillation at the lowest cuff pressure. Systolic and diastolic pressures then correspond to the onset of rapidly increasing and decreasing oscillations, respectively. Alternatively, the diastolic pressure is calculated from the systolic and mean arterial pressures. With such oscillometric blood pressure devices the general tendency is to overestimate the systolic but to underestimate diastolic blood pressure compared with sphygmomanometers (Weaveret al.1990; Whincup et al.1992; Hasanet al.1993). However in subjects with stiff arteries, NIBP measurement may overestimate both the systolic and diastolic blood pressure readings (van Popele et al.2000).
For a continuous measure of blood pressure, cannulation of an artery was necessary until the early 1980s when two devices, the ‘Finapres’ and ‘Portapres’ were developed by Wesseling et al. (1995) based on the volume-clamp method introduced by the Czech physiologist Jan Pe˜n´az (1973). By doing so, continuous non-invasive measurement of arterial pressure in humans was introduced both for research purposes and for clinical medicine (Imholz et al. 1998). This review focuses on recent developments in the methodology of finger pressure measurement and the information about arterial flow that can be obtained from it.
The volume-clamp method
Arterial pressure in the finger is measured making use of the volume-clamp method (Pe˜n´az, 1973). The method is based on the development of the dynamic pulsatile unloading of the finger arterial walls (Wesselinget al.1995;
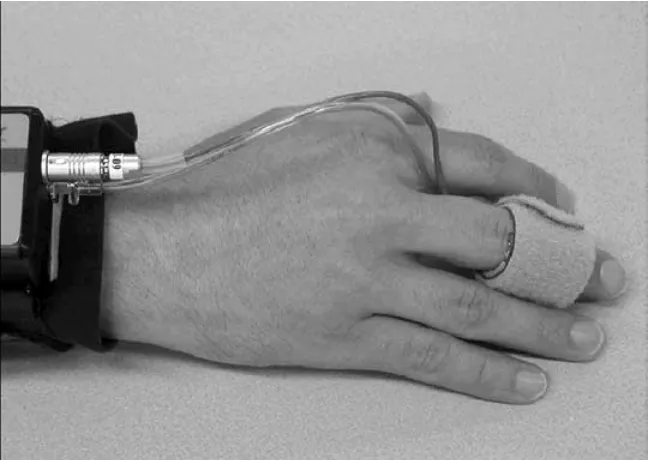
Figure 1. Finger pressure
The main components of the finger cuff are an inflatable air bladder, and a
plethysmograph consisting of a light source (infrared light light-emitting diode) and a light detector (infrared photodiode). The air bladder is connected to the front-end unit via an air hose and both components of the infrared plethysmograph via a cuff cable. The front-end unit is connected to the main unit and pump unit in the Finometer.
Imholzet al. 1998). In this method the diameter of an artery under a cuff wrapped around the finger is kept constant (clamped) at a certain diameter, the ‘set-point’, in spite of the changes in arterial pressure during each heart beat. Changes in diameter are detected by means of an infrared photo-plethysmograph built into a finger cuff (Fig. 1). If during systole an increase is detected in arterial diameter the finger cuff pressure is immediately increased by a rapid pressure servo-controller system to prevent the diameter change. To fully collapse the finger artery requires a cuff pressure larger than the finger intra-arterial pressure. At zero transmural pressure the artery is not collapsed (unstressed arteries still have∼13or12 their original cross-sectional area and volume) but ‘unloaded’, that is, the arterial walls are held at zero transmural pressure which corresponds with their unstressed diameter (Wesseling et al. 1995; Imholzet al. 1998). As a result, finger cuff pressure equals intra-arterial pressure when the volume-clamp method is active at the proper unloaded diameter of the finger artery. Defining the correct unloaded diameter of a finger artery is not straightforward. The unloaded diameter is close to the average diameter at a pressure where the amplitude of the pulsations in the plethysmogram is largest. Changes in stress and tone of smooth muscle in the arterial wall and in haematocrit affect the unloaded diameter. Therefore, the unloaded diameter is usually not constant during a measurement and has to be verified at intervals.
adjustment of the arterial unloaded volume. It explores part of the pressure–diameter relation by analysing the plethysmogram at a number of steady pressure levels, and is able to track the unloaded diameter of a finger artery even if smooth muscle tone changes. To adjust the correct unloaded diameter of the finger artery based on the signal from the finger cuff plethysmograph, cuff pressure is kept constant at regular intervals. A consequence is that the measurement of blood pressure is temporarily interrupted. The finger pressure tracks the intra-arterial pressure even though the pressure waves may differ systematically both in shape and magnitude (Imholzet al.1991, 1992; Bos et al. 1992), but such bias can, at least partly, be circumvented.
Intrabrachial to finger pulse wave transfer
In the supine position, the arterial pressure waveform varies through the arterial tree introducing augmentation of systolic pressure from the intrabrachial arterial pressure (BAP) to the finger arterial pressure (FAP) (Wilkinson et al. 2000; Kelly et al. 2001). This is so because the transmission of the pressure pulse along the arm arteries causes distortion of the pulse waveform (Boset al.1995). Such distortion is due to differences in vessel compliance and wave reflection with the pressure waveform at any point in the arterial tree being a composite of the forwarded and the reflected wave (Westerhof et al. 1972; Nichols et al. 1997; Wilkinson et al. 2000). The consequence is an amplification of the pressure waveform with increasing systolic pressure and a dependency of amplification on frequency – and therefore heart rate – but with little, if any, influence of vascular tone (Boset al.1995). In young healthy subjects FAP may overestimate the brachial systolic pressure as a consequence of pulse pressure amplification (Imholzet al.1991, 1992).
Furthermore, mean FAP tends to be lower than BAP as a result of a pressure gradient across the vascular tree caused by flow. This pressure gradient becomes significant because of the progressive narrowing of the arteries towards the periphery, particularly in the hand (Imholzet al. 1991). The pressure decay related to flow in arteries is greatest for a high pulse pressure at a low mean pressure (Gizdulich et al.1997). Accordingly, both pulse-wave transmission and pressure gradient distort the FAP pulse waveform (Bogert et al. 2004) with a reduction in pulse-pressure amplification with age (Nichols et al. 1997) and in the presence of vasoactive agents (Wilkinsonet al.2001), but an enhancement with increasing heart rate (Wilkinson et al.2002).
As an example, assumption of the upright posture may affect the BAP–FAP difference by the reflex increase in vascular smooth muscle tone (Iversenet al.1995) which affects pressure transmission with amplification through
wave reflection (Leeet al.1966; Burkeet al.1977; Westerhof & O’Rourke, 1995; Boset al.1995; Gizdulichet al.1997; Nicholset al.1997; O’Rourke, 2002). The implication is that the difference between FAP and BAP may become positive (Bogertet al.2004).
In the supine position the aortic-to-radial pulse pressure difference is largely due to differences in systolic pressure (Pauca et al. 1992, 2001; Eckert & Horstkotte, 2002). The postural reflex increase in heart rate also reduces the ejection period with amplification of the aortic-to-brachial pulse (Kroeker & Wood, 1955; Rowell et al. 1968) and increases peripheral systolic, diastolic and mean arterial pressures (Kroeker & Wood, 1956; O’Rourke, 1971; Wilkinsonet al.2000). Consequently, the transition from the supine to the upright body position affects specifically the systolic BAP–FAP difference (Stokeset al.1991; Jellema et al.1996; Boset al.1996; Gizdulichet al.1997; Imholz et al.1998).
The frequency-transfer function from BAP to FAP has a resonance of∼8 Hz (Gizdulichet al.1997). The finger diastolic and mean pressures may be some 8–10 mmHg less than the brachial values. In supine humans the FAP signal can be modelled to a reconstructed BAP curve, using a general inverse anti-resonance model correcting for the difference in pressure waveforms between the BAP and the FAP signals. Reconstructed BAP waves are similar to the actual BAP in shape but not in magnitude (Boset al.1996). A regression-based level correction is one approach used to restore the average BAP value (Gizdulichet al.1997). This waveform reconstruction improves tracking of diurnal changes in BAP by FAP (Westerhofet al.2002) and can be performed off-line. When sympathetic vasomotor tone is increased by prolonged orthostatic stress, reconstruction of BAP from FAP accounts for the systolic bias from the supine to the upright position. In the supine position bias for systolic pressure is ∼2 mmHg and following 20 min in the head-up tilted position is ∼11 mmHg for FAP. This is reduced to 0 and 1 mmHg, respectively, for the reconstructed BAP (Bogertet al. 2004). In contrast, the bias for the diastolic pressure is not affected by the reconstruction (Boset al.1996; Gizdulichet al.1997). The remaining offset is therefore attributed to the generalized waveform filter which is based on a population average compared to individual observations. One approach is to reference diastolic FAP against brachial auscultation measures (Shiet al.1993).
is the reconstruction of radial pressure based on a finger-to-radial autoregressive exogenous model (Guelen et al.2004).
Cardiac stroke volume from arterial pressure
Techniques that make use of dye or thermodilution (Hamilton, 1948), rebreathing of inert gas (McGuireet al. 2001; Gabrielsenet al.2002), CO2(Farhiet al.1976; Rogers & van der Walt, 1997) or Fick’s principle (Espersenet al. 1995; Laszlo, 2004) for determination of cardiac output ( ˙Q) produce values that represent an average over several heart beats. To be detected by a standard method, changes in ˙Q need to persist and remain constant for at least as long as the method of choice takes. This limitation renders it impossible to recognize, for example, the rapid changes taking place during the transition from the supine to the standing position. It may also be considered an advantage for clinical practice if a measure of ˙Qis continuous and at the same time non-invasive.
Monitoring of a continuous ˙Qallows for the detection of rapid changes in systemic flow and conductance that would otherwise be unnoticed by the recording of arterial pressure and heart rate (Jellema et al. 2002; Leonetti et al.2004). Alternatively, a non-invasive and continuous tracking of changes in stroke volume (SV) can be obtained by ultrasound (Toska & Walloe, 2002; Van Lieshoutet al. 2003), thoracic electrical impedance (Kubicecket al.1966; Moore et al. 1992) or by arterial pulse-wave analysis (Jansenet al.1990; Stoket al.1993; Antonuttoet al.1995; Wielinget al.1998; Stoket al.1999). In comparison, the application of ultrasound is somewhat limited in that either a probe has to be held over the root of the aorta under a fixed angle or a transesophageal approach has to be applied, and motion artefacts remain a problem when using electrical impedance.
In the dog, for a given aortic flow, two arterial parameters, arterial resistance and compliance are sufficient to describe the systolic and diastolic pressure (Stergiopulos & Westerhof, 1999). However, these variables cannot explain pulse pressure suggesting that flow in itself has an important contribution (Stergiopulos & Westerhof, 1999). The reaction of the human aorta in opposing the ejection of blood by the left ventricle is described by a three-element model of the aortic input impedance (Broemser & Ranke, 1930; McDonald & Nichols, 1973; Toorop et al. 1987; Burkhoff et al. 1988). The mechanical properties of the aorta dominate the impedance to outflow that is presented to the left ventricle in systole, which, in turn, depends on the difference between the intra-arterial pressure and the tissue pressure exerted on the outside of the aortic and the arterial wall (i.e. the transmural pressure) (Harmset al.1999).
The Modelflow method (Wesseling et al. 1993) as implemented in the Finometer computes an aortic flow waveform from either finger or intra-arterial pressure by simulating a non-linear three-element model of the aortic input impedance. Integrating the computed aortic flow waveform per beat provides left ventricular SV and consequently ˙Q by multiplying SV by the instantaneous heart rate. Previously, pulse contour methods were linear and integrated the systolic area of the arterial pulse wave, sometimes with a correction for heart rate (Wesseling et al.1974). However, the elastic behaviour of the thoracic human aorta varies non-linearly with the changing distending pressure (Langewouterset al. 1985) which is not accounted for by the early pulse contour methods. In contrast, the cross-sectional area of the aorta included in the model, increases with aortic pressure in a non-linear manner: at lower pressures the area increases quickly, at higher pressures the increase is slower. The relation of cross-sectional area to arterial pressure is described by an arctangent equation with age and gender dependent parameters based on data derived from human aortas (Langewouterset al.1984). Accordingly, the model makes use of the individual age, sex, height and weight as input for the aortic area–pressure relationship to be simulated.
The major determinants of systolic inflow are the aortic characteristic impedance and arterial compliance (Westerhof et al. 1971) which depend on the elastic properties of the aorta. Peripheral vascular resistance, as the third element of the model, is not a major determinant of systolic inflow (Wesseling et al. 1993) and is time-varying, expressed for each heart beat as the quotient of arterial pressure and the modelled flow ( ˙QMF).
The aortic characteristic impedance (Z
O) relates pulsatile flow to pulsatile pressure at the entrance of the aorta. When the left ventricle contracts, blood is ejected into the aorta, but as the aorta already contains blood, the existing aortic pressure opposes the left ventricular outflow. Aortic pressure rises in response to the accelerated inflow of blood. The magnitude of the rise in aortic pressure depends on instantaneous flow, the cross-sectional aortic area and compliance. Hence,ZO represents the aortic opposition to pulsatile inflow from the contracting left ventricle and has the dimension of pressure divided by flow.
divided by a change in pressure (dP) while peripheral vascular resistance (Rp), the ratio of mean pressure to mean flow, is a measure for the ease of constant blood drainage from the compliant aorta into the peripheral vascular beds. Moving from the supine to the upright position, the intra-arterial pressure below the level of the heart increases in proportion to the hydrostatic height. It is unknown to what extent this rise in pressure is counterbalanced by an increased tissue pressure, and therefore it has been debated whether the orthostatic increment in intravascular pressures is translated to an increase in transmural pressure in the descending thoracic and abdominal aorta (Gauer & Thron, 1965; Rushmer, 1979; Blomqvist & Stone, 1984; Rowell, 1993). In the upright position, the aortic transmural pressure below heart level may increase and consequently reduce its compliance. Such a reduction in aortic compliance would imply that for a given pressure, the actual volume of blood stored in the aorta becomes less than the modelled volume mimicking the impedance of the aorta in the supine position (Wesselinget al.1993). In comparison to a thermodilution-based estimate, ˙QMFas the product of SVMFand heart rate is larger in the upright body position, but only when ˙QMFis based on an intra-arterial reading of blood pressure (Harms et al. 1999). Intensified cardiovascular stress induced by 1-h passive head-up tilt at 70 deg does not affect the offset of ˙QMF, implying that the estimate ofRpincluded in the model is simulated appropriately.
Continuousversusstandard cardiac stroke volume
Modelflow was developed for continuous monitoring of ˙
Q in the operating theatre and in the intensive care unit. The model assumes a normal human aorta and proper functioning of the aortic valve. It also uses the premise that the transmural aortic pressure is not affected, for example, by extreme pulmonary hyperinflation or increased intra-abdominal pressure. The maximal aortic diameter during ejection is the parameter included in the model that does not regress with age and its variability is considerable, explaining why ˙QMF does not reflect the true ˙Q without calibration (Remmen et al. 2002; Van Lieshout & Karemaker, 2003; Azabji Kenfacket al. 2004). If accurate values are required, a calibration against a standard method is needed, such as thermodilution (Harmset al.1999; Jellemaet al.1999; Jansenet al.2001) or the Fick principle (Van Lieshoutet al.2001).
A general shortcoming with respect to the validation of beat-to-beat tracking of SV is that it is based on a comparison to conventional measures of SV, such as thermodilution-based estimates or inert gas rebreathing which are obtained as averages over at least 20 heart beats (Hamilton, 1948). For example, with thermodilution-based determinations of ˙Q, the average of four injections
is required to be 95% confident that the result is within 5% of the ‘true’ ˙Q. The averages of two determinations need to differ by at least 7% before it is accepted that a change in ˙Q has taken place (Nilsson et al.2004). In addition, the thermodilution method is based on the law of conservation of energy; that is, that there is no loss of cold between the site of injection and detection, that mixing of the indicator and blood is complete and that the induced temperature change can be discriminated accurately from the fluctuations in baseline temperature. To meet these assumptions more closely, the use of an automatic injector in combination with a closed injectate delivery system is preferable, improving consistency in injected volume and linearity of injection rate (Nelson & Houtchens, 1982). Furthermore, conditions such as central hypovolaemia with amplification of reflex vasoconstriction introduce oscillations in the central and arterial pressures, as well as in ˙Q, which are further augmented by respiration. This inevitably increases the scatter of thermodilution measurements while the Stewart-Hamilton equation used to calculate the area under the thermodilution curve is valid only if the ˙Q is constant over the time the measurement is made (Hamilton, 1948; Jansen, 1995).
A potential drawback of the rebreathing technique for validation purposes is that the requirement of a stable haemodynamic condition is not easily fulfilled as the manoeuvre itself influences ˙Q (Stok et al. 1999) violating the assumed steady state of both circulation and ventilation. Nevertheless, changes in ˙QMF follow ˙Q determined by inert gas rebreathing during static exercise in the upright position (Van Dijket al.2005). From the supine to the upright position, a reduction in ˙Q and a gravity-inducedV/ ˙Qmismatch both affect end-tidal CO2 (Gisolfet al.2004). Therefore, during a change in posture,
˙
Q, as determined by CO2rebreathing, may be biased when end-tidal CO2 is assumed to be equal to arterial CO2 tension (Pittet al.2004).
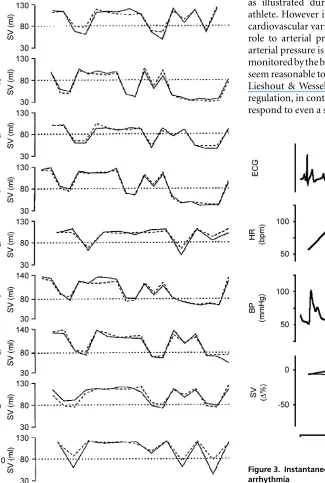
In general, validations are limited in so far as they are based on averaging procedures in steady-state conditions and do not reflect the beat-to-beat fluctuations, which may be considerable (Toska & Eriksen, 1993). If absolute values are required, ˙QMF needs a calibration against a gold standard, such as an improved thermodilution procedure using respiratory-phase controlled quadruple automated injections (Wesselinget al.1993; Jansenet al. 2001). Otherwise, Q˙MF is expressed as change from control with the same precision in ˙Q tracking (Fig. 2). The model accepts intra-arterial and non-invasively determined finger pressure as input. Furthermore, under the adverse circumstances of low arterial pressure, for example in circulatory shock, calibrated ˙QMFfrom radial or femoral arterial pressure tracks over a wide range of
˙
1992; Jellemaet al.1999; Van Lieshoutet al.2001; Pottet al. 2003) including postural stress (Harms et al. 1999; Van Lieshoutet al.2003) and static (Van Dijket al.2005) and dynamic exercise (Ideet al.1998; Sugawaraet al.2003; Tam et al.2004). Despite this, proper tracking of ˙Qfrom non-invasive arterial pressure requires dedicated application of the finger cuff, continuous maintenance of the finger
Figure 2. Tracking of thermodilution-determined stroke volume by Modelflow
Changes in stroke volume as elicited by active and passive changes in body position. Solid line, thermodilution-determined SV; broken line, Modelflow-determined SV from finger pressure. S1–10, subject number. Adapted from Harmset al.(1999).
position at heart level, and avoidance of sudden motion (Van Lieshoutet al.2003).
Perspective
From a teleological viewpoint, ˙Qneeds to be maintained at the lowest possible arterial perfusion pressure in order to minimize afterload and myocardial energy expenditure as illustrated during maximal exercise of the trained athlete. However in the measurement and monitoring of cardiovascular variables in patients, ˙Qplays a subservient role to arterial pressure (Coronel et al. 2001). Because arterial pressure is the principal cardiovascular parameter monitored by the body via the arterial baroreceptors, it may seem reasonable to focus monitoring on that variable (Van Lieshout & Wesseling, 2001). However, arterial pressure regulation, in contrast to, for example heart rate, does not respond to even a substantial blood loss (i.e. it is regularly
Figure 3. Instantaneous fluctuations in stroke volume during arrhythmia
Premature atrial complexes recorded in a 56-year-old subject. Decreases of as much as 50% in stroke volume occur instantaneously and are indicated with two non-invasive methods in near-identical manner suggesting a linear response of both methods. Thick line, Doppler ultrasound-determined stroke volume; thin line,
maintained until a blood loss exceeds 1 l) (Secheret al. 1992; Kinsella & Tuckey, 2001). Likewise, the usual clinical and haemodynamic parameters are not reliable indices of preload to the heart (Boulainet al.2002; Pinsky, 2002) and an ‘optimal’ volume is neither defined nor is it an easily measurable entity.
Hypovolaemia may be characterized by a reduced preload to the heart, with SV becoming dependent upon the central blood volume. It may be considered that normovolaemia represents the point in the cardiac preload–output relationship at which ˙Qdoes not increase further under circumstances where venous return is
unimpeded (Harms et al. 2003). Monitoring of a
continuous arterial pressure and ˙Q is of relevance for other clinical purposes. For instance, to evaluate a patient with recurrent syncope and to understand the mechanisms involved, a continuous recording of both pressure and flow is required because the events proceed rapidly (Friedman et al.1990; Petersenet al.1995; Jellemaet al.1996). This is also true for the large instantaneous fluctuations in SV during supraventricular arrhythmia and complaints of short-lasting dizziness (Fig. 3). It should also be considered that invasive procedures themselves have the potential to induce a neurally mediated syncope, and therefore, arterial pressure should preferably be recorded non-invasively (Stevens, 1966; Benditt et al. 1996). The least intrusive technique available that adequately monitors changes in the arterial pressure is the finger volume-clamp method (Bendittet al.1996).
In summary, arterial pressure, derived non-invasively and continuously from the finger, tracks – but is not equal to – the intra-arterial pressure. Cardiac output is evaluated by various techniques, each with its specific disadvantages while the absolute value remains difficult to obtain. However, monitoring ˙Qcontinuously allows for the detection of rapid effects on systemic flow and conductance that may remain unnoticed in a recording of arterial pressure or heart rate. We consider application of a continuous non-invasive technique for determining ˙Q in human cardiovascular research useful in that beat-to-beat information on arterial flow offers important and clinically relevant information on the circulation beyond what can be detected by arterial pressure.
References
Antonutto G, Girardis M, Tuniz D & di Prampero PE (1995). Noninvasive assessment of cardiac output from arterial pressure profiles during exercise.Eur J Appl Physiol Occup Physiol72, 18–24.
Azabji Kenfack M, Lador F, Licker M, Moia C, Tam E, Capelli C, Morel D & Ferretti G (2004). Cardiac output by Modelflow method from intra-arterial and fingertip pulse pressure profiles.Clin Sci (Lond)106, 365–369.
Benditt DG, Ferguson DW, Grubb BP, Kapoor WN, Kugler J, Lerman BBet al. (1996). Tilt table testing for assessing syncope. American College of Cardiology.J Am Coll Cardiol 28, 263–275.
Blomqvist CG & Stone HL (1984). Cardiovascular adjustments to gravitational stress. InHandbook of Physiology, Section 2, The Cardiovascular System, vol. 3,Peripheral Circulation and Organ Blood Flow, ed. Shepherd JT & Abboud FM, pp. 1025–1063. American Physiological Society, Washington DC.
Bogert LWJ, Harms MP, Pott F, Secher NH, Wesseling KH & Van Lieshout JJ (2004). Reconstruction of brachial pressure from finger arterial pressure during orthostasis.J Hypertens 22, 1873–1880.
Bos WJW, Imholz BPM, Van Goudoever J, van Wesseling KH & Montfrans GA (1992). The reliability of noninvasive continuous finger blood pressure measurement in patients with both hypertension and vascular disease.Am J Hypertens 5, 529–535.
Bos WJW, Van den Meiracker AH, Wesseling KH &
Schalekamp MADH (1995). Effect of regional and systemic changes in vasomotor tone on finger pressure amplification. Hypertension26, 315–320.
Bos WJW, Van Goudoever J, Van Montfrans GA, Van den Meiracker AH & Wesseling KH (1996). Reconstruction of brachial artery pressure from noninvasive finger pressure measurements.Circulation94, 1870–1875.
Boulain T, Achard JM, Teboul JL, Richard C, Perrotin D & Ginies G (2002). Changes in BP induced by passive leg raising predict response to fluid loading in critically ill patients.Chest121, 1245–1252.
Broemser P & Ranke OF (1930). Uber die Messung des Schlagvolume des Herzens auf unblutigem Weg.Z Biol90, 467–507.
Burke D, Sundl¨of G & Wallin BG (1977). Postural effects on muscle nerve sympathetic activity in man.J Physiol272, 399–414.
Burkhoff D, Alexander JJ & Schipke J (1988). Assessment of Windkessel as a model of aortic input impedance. Am J Physiol255, H742–H753.
Ch´avez Dom´ınguez R & De Micheli A (2002). [Epistemological focus on sphygmomanometry.]Rev. Invest Clin54, 84–91. Coronel R, de Groot JR & Van Lieshout JJ (2001). Defining
heart failure.Cardiovasc Res50, 419–422.
Cushing H (1903). On routine determination of arterial tension in operating room and clinic.Boston Med Surg J148, 250–256.
Eckert S & Horstkotte D (2002). Comparison of Portapres non-invasive blood pressure measurement in the finger with intra-aortic pressure measurement during incremental bicycle exercise.Blood Pressure Monit7,
179–183.
Espersen K, Jensen EW, Rosenborg D, Thomsen JK, Eliasen K, Olsen NV & Kanstrup IL (1995). Comparison of cardiac output measurement techniques: thermodilution, Doppler, CO2-rebreathing and the direct Fick method.
Acta Anaesthesiol Scand39, 245–251.
Friedman DB, Jensen FB, Matzen S & Secher NH (1990). Non-invasive blood pressure monitoring during head-up tilt using the Penaz principle.Acta Anaesthesiol Scand34,
519–522.
Gabrielsen A, VidebaekR, Schou M, Damgaard M, Kastrup J & Norsk P (2002). Non-invasive measurement of cardiac output in heart failure patients using a new foreign gas rebreathing technique.Clin Sci (Lond)102,
247–252.
Gauer OH & Thron HL (1965). Postural changes in the circulation. InHandbook of Physiology, Section 2, The Cardiovascular System, vol. 3, The Peripheral Circulation, ed. Shepherd JT, Abboud FM, pp. 2409–2439. American Physiological Society, Washington DC.
Gisolf J, Wilders R, Immink RV, Van Lieshout JJ & Karemaker JM (2004). Tidal volume, cardiac output and functional residual capacity determine end-tidal CO2transient during standing up in humans.J Physiol554, 579–590.
Gizdulich P, Prentza A & Wesseling KH (1997). Models of brachial to finger pulse wave distortion and pressure decrement.Cardiovasc Res33, 698–705.
Gratz I, Kraidin J, Jacobi AG, deCastro NG, Spagna P & Larijani GE (1992). Continuous noninvasive cardiac output as estimated from the pulse contour curve.J Clin Monit8,
20–27.
Guelen I, Bogert LWJ, Van Beek M, Westerhof BE, Van Der Sar GL & Van Lieshout JJ (2004). Reconstruction of radial artery pressure from non-invasive finger arterial pressure
measurements in patients with ischemic heart disease.
J Hypertens22, S280–S281.
Guelen I, Westerhof BE, Van Der Sar GL, Van Montfrans GA, Kiemeneij F, Wesseling KH & Bos WJ (2003). Finometer, finger pressure measurements with the possibility to reconstruct brachial pressure.Blood Pressure Monit8, 27–30.
Hales S (1733). Statical Essays: concerning Haemastaticks; or, An Account of some Hydraulick and Hydrostatical
Experiments made on the Blood aaaaaaand Blood-vessels of Animals.Printed for W. Jnnys and R. Manby, London.
Hamilton WF (1948). Comparison of the Fick and dye-injection methods of measuring the cardiac output in man.
Am J Physiol153, 309–321.
Harms MPM, Van Lieshout JJ, Jenstrup M, Pott F & Secher NH (2003). Postural effects on cardiac output and mixed venous oxygen saturation in humans.Exp Physiol88, 611–616.
Harms MPM, Wesseling KH, Pott F, Jenstrup M, Van Goudoever J, Secher NH & Van Lieshout JJ (1999). Continuous stroke volume monitoring by modelling flow from non-invasive measurement of arterial pressure in humans under orthostatic stress.Clin Sci97, 291–301.
Hasan MA, Thomas TA & Prys-Roberts C (1993). Comparison of automatic oscillometric arterial pressure measurement with conventional auscultatory measurement in the labour ward.Br J Anaesth70, 141–144.
Ide K, Pott F, Van Lieshout JJ & Secher NH (1998). Middle cerebral artery blood velocity depends on cardiac output during exercise with a large muscle mass.Acta Physiol Scand 162, 13–20.
Imholz BPM, Parati G, Mancia G & Wesseling KH (1992). Effects of graded vasoconstriction upon the measurement of finger arterial pressure.J Hypertens10, 979–984.
Imholz BPM, Wieling W, Langewouters GJ & Van Montfrans GA (1991). Continuous finger arterial pressure: utility in the cardiovascular laboratory.Clin Auton Res1, 43–53.
Imholz BPM, Wieling W, Van Montfrans GA & Wesseling KH (1998). Fifteen years experience with finger arterial pressure monitoring: assessment of the technology.Cardiovasc Res38,
605–616.
Iversen HK, Madsen P, Matzen S & Secher NH (1995). Arterial diameter during central volume depletion in humans.
Eur J Appl Physiol72, 165–169.
Jansen JRC (1995). The thermodilution method for the clinical assessment of cardiac output.Intensive Care Med21,
691–697.
Jansen JRC, Schreuder JJ, Mulier JP, Smith NT, Settels JJ & Wesseling KH (2001). A comparison of cardiac output derived from the arterial pressure wave against
thermodilution in cardiac surgery patients.Br J Anaesth87,
212–222.
Jansen JRC, Wesseling KH, Settels JJ & Schreuder JJ (1990). Continuous cardiac output monitoring by pulse contour during cardiac surgery.Eur Heart J11(Suppl. I), 26–32.
Jellema WT, Imholz BPM, Van Goudoever J, Wesseling KH & Van Lieshout JJ (1996). Finger arterial versus intrabrachial pressure and continuous cardiac output during head-up tilt testing in healthy subjects.Clin Sci91, 193–200.
Jellema WT, Veerman DP, de Winter RJ, Wesseling KH, Van Deventer SJH, Hack CE & Van Lieshout JJ (2002). In vivo interaction of endotoxin and recombinant
bactericidal/permeability-increasing protein (rBPI23): hemodynamic effects in a human endotoxemia model.J Lab Clin Med140, 228–235.
Jellema WT, Wesseling KH, Groeneveld AB, Stoutenbeek CP, Thijs LG & Van Lieshout JJ (1999). Continuous cardiac output in septic shock by simulating a model of the aortic input impedance: a comparison with bolus injection thermodilution.Anesthesiology90, 1317–1328.
Kelly RP, Millasseau SC, Ritter JM & Chowienczyk PJ (2001). Vasoactive drugs influence aortic augmentation index independently of pulse-wave velocity in healthy men.
Hypertension37, 1429–1433.
Kinsella SM & Tuckey JP (2001). Perioperative bradycardia and asystole: relationship to vasovagal syncope and the Bezold-Jarisch reflex.Br J Anaesth86, 859–868.
Korothoff NC (1905). On methods of studying blood pressure.
Izvestiia Voennomedistinskite Akademiia11, 365.
Kroeker EJ & Wood EH (1955). Comparison of simultaneously recorded central and peripheral arterial pressure pulses during rest, exercise and tilted position in man.Circ Res3,
623–632.
Kroeker EJ & Wood EH (1956). Beat-to-beat alterations in relationship of simultaneously recorded central and peripheral arterial pressure pulses during Valsalva maneuver and prolonged expiration in man.J Appl Physiol8,
483–494.
Kubiceck WG, Karnegis JN, Patterson RP, Witsoe DA & Mattson RH (1966). Development and evaluation of an impedance cardiac output system.Aerosp Med37,
1208–1212.
Langewouters GJ, Wesseling KH & Goedhard WJA (1984). The static elastic properties of 45 human thoracic and 20 abdominal aortas in vitro and the parameters of a new model.J Biomech17, 425–535.
Langewouters GJ, Wesseling KH & Goedhard WJA (1985). Age-related changes in viscoelasticity of normal and arteriosclerotic human aortas. InBiomechanics: Current Interdisciplinary Research, ed. Perren SM & Schneider E, pp. 245–250. Martinus-Nijhoff Publishers,
Dordrecht.
Laszlo G (2004). Respiratory measurements of cardiac output: from elegant idea to useful test.J Appl Physiol96,
428–437.
Lee TD, Lindeman RD, Yiengst MJ & Shock NW (1966). Influence of age on the cardiovascular and renal responses to tilting.J Appl Physiol21, 55–61.
Leonetti P, Audat F, Girard A, Laude D, Lefrere F & Elghozi JL (2004). Stroke volume monitored by modeling flow from finger arterial pressure waves mirrors blood volume withdrawn by phlebotomy.Clin Auton Res14,
176–181.
Lui K, Doyle PE & Buchanan N (1982). Oscillometric and intra-arterial blood pressure measurements in the neonate: a comparison of methods.Aust Paediatr J18, 32–34.
Marey EJ (1878).La M´ethode Graphique Dans les Sciences Exp´erimentales et Principalement En Physiologie et En M´edicine.Masson, Paris.
McDonald DA & Nichols WW (1973). Cardiac output derived from the time derivative and phase velocities of the aortic pressure wave.Med Biol Eng11, 678–690.
McGuire DK, Levine BD, Williamson JW, Snell PG, Blomqvist CG, Saltin B & Mitchell JH (2001). A 30-year follow-up of the Dallas Bedrest and Training Study. I. Effect of age on the cardiovascular response to exercise.Circulation104,
1350–1357.
Moore R, Sansores R, Guimond V & Abboud R (1992). Evaluation of cardiac output by thoracic electrical impedance during exercise in normal subjects.Chest102,
448–455.
Movius AJ, Bratton SL & Sorensen GK (1998). Use of pulse oximetry for blood pressure measurement after cardiac surgery.Arch Dis Child78, 457–460.
Nelson LD & Houtchens BA (1982). Automatic vs manual injections for thermodilution cardiac output
determinations.Crit Care Med10, 190–192.
Nichols WW, O’Rourke MF & Michael F (1997). McDonald’s blood flow in arteries. InTheoretical, Experimental and Clinical Principles. Oxford University Press, Oxford. Nilsson LB, Nilsson JC, Skovgaard LT & Berthelsen PG (2004).
Thermodilution cardiac output-are three injections enough?.Acta Anaesthesiol Scand48, 1322–1327.
O’Rourke MF (1971). The arterial pulse in health and disease.
Am Heart J82, 687–702.
O’Rourke MF (2002). From theory into practice: arterial haemodynamics in clinical hypertension.J Hypertens20,
1901–1915.
O’Rourke MF, Blazek JV, Moreels CL & Krovetz LJ (1955). Pressure wave transmission along the human aorta; changes with age and in arterial degenerative disease.Circ Res3,
623–631.
Pauca AL, O’Rourke MF & Kon ND (2001). Prospective evaluation of a method for estimating ascending aortic pressure from the radial artery pressure waveform.
Hypertension38, 932–937.
Pauca AL, Wallenhaupt SL, Kon ND & Tucker WY (1992). Does radial artery pressure accurately reflect aortic pressure?Chest 102, 1193–1198.
Pe˜n´az J (1973). Photoelectric measurement of blood pressure, Volume and flow in the finger.Digest of the International Conference on Medicine and Biological Engineering 104–104.
Petersen ME, Williams TR & Sutton R (1995). A comparison of non-invasive continuous finger blood pressure measurement (Finapres) with intra-arterial pressure during prolonged head-up tilt.Eur Heart J16, 1641–1654.
Pinsky MR (2002). Functional hemodynamic monitoring.
Intensive Care Med28, 386–388.
Pitt MS, Marshall P, Diesch JP & Hainsworth R (2004). Cardiac output by Portapres.Clin Sci (Lond)106,
407–412.
Pott F, Van Lieshout JJ, Ide K, Madsen P & Secher NH (2003). Middle cerebral artery blood velocity during intense static exercise is dominated by a Valsalva maneuver.J Appl Physiol 94, 1335–1344.
Ramsey M III (1979). Noninvasive automatic determination of mean arterial pressure.Med Biol Eng Comput17,
11–18.
Remmen JJ, Aengevaeren WR, Van Verheugt FWDW, Luijten HE, Bos A & Jansen RWMM (2002). Finapres arterial pulse wave analysis with Modelflow is not a reliable non-invasive method for assessment of cardiac output.Clin Sci103,
143–149.
Riva-Rocci S (1896). Un nuovo sfigmomanometro.Gazzetta Medica Di Torino47, 981–1017.
Rogers GG & van der Walt W (1997). An evaluation of exercise cardiac output using the CO2rebreathing extrapolation
technique.Eur J Appl Physiol75, 431–434.
Rowell LB (1993). Control of regional blood flow during dynamic exercise. InHuman Cardiovascular Control
ed. Rowell LB, pp. 204–254. Oxford University Press, New York.
Rowell LB, Brengelmann GL, Blackmon JR, Bruce RA & Murray JA (1968). Disparities between aortic and peripheral pulse pressures induced by upright exercise and vasomotor changes in man.Circulation37, 954–964.
Rushmer RF (1979). Effects of posture. InCardiovascular Dynamicsed. Rushmer RF, pp. 192–219. W.B. Saunders, Philadelphia.
Schutte AE, Huisman HW, van Rooyen JM, Malan NT & Schutte R (2004). Validation of the Finometer device for measurement of blood pressure in black women.J Hum Hypertens18, 79–84.
Secher NH, Jacobsen J, Friedman DB & Matzen S (1992). Bradycardia during reversible hypovolaemic shock: associated neural reflex mechanisms and clinical implications.J Clin Exp Pharmacol Physiol19, 733–743.
Shi X, Andresen JM, Potts JT, Foresman BH, Stern SA & Raven PB (1993). Aortic baroreflex control of heart rate during hypertensive stimuli: effect of fitness.J Appl Physiol74,
Stergiopulos N & Westerhof N (1999). Role of total arterial compliance and peripheral resistance in the determination of systolic and diastolic aortic pressure.Pathol Biol47,
641–647.
Stevens PM (1966). Cardiovascular dynamics during orthostasis and the influence of intravascular instrumentation.Am J Cardiol17, 211–218.
Stok WJ, Baisch F, Hillebrecht A, Schulz H, Meyer M & Karemaker JM (1993). Noninvasive cardiac output
measurement by arterial pulse analysis compared with inert gas rebreathing.J Appl Physiol74, 2687–2693.
Stok WJ, Stringer RC & Karemaker JM (1999). Noninvasive cardiac output measurement in orthostasis: pulse contour analysis compared with acetylene rebreathing.J Appl Physiol 87, 2266–2273.
Stokes DN, Clutton-Brock T, Patil C, Thompson JM & Hutton P (1991). Comparison of invasive and non-invasive measurement of continuous arterial pressure using the Finapres.Br J Anaesth67, 26–35.
Sugawara J, Tanabe T, Miyachi M, Yamamoto K, Takahashi K, Iemitsu M, Otsuki T, Homma S, Maeda S, Ajisaka R & Matsuda M (2003). Non-invasive assessment of cardiac output during exercise in healthy young humans: comparison between Modelflow method and Doppler echocardiography method.Acta Physiol Scand179, 361–366.
Tam E, Azabji KM, Cautero M, Lador F, Antonutto G,
di Prampero PE, Ferretti G & Capelli C (2004). Correction of cardiac output obtained by Modelflow from finger pulse pressure profiles with a respiratory method in humans.Clin Sci (Lond)106, 371–376.
Toorop GP, Westerhof N & Elzinga G (1987). Beat-to-beat estimation of peripheral resistance and arterial compliance during pressure transients.Am J Physiol252, H1275–H1283. Toska K & Eriksen M (1993). Respiration-synchronous
fluctuations in stroke volume, heart rate and arterial pressure in humans.J Physiol472, 501–512.
Toska K & Walloe L (2002). Dynamic time course of hemodynamic responses after passive head-up tilt and tilt back to supine position.J Appl Physiol92,
1671–1676.
Van Dijk N, de Bruin IG, Gisolf J, Bruin-Bon HA, Linzer M, Van Lieshout JJ & Wieling W (2005). Hemodynamic effects of legcrossing and skeletal muscle tensing during free standing in patients with vasovagal syncope.J Appl Physiol 98, 584–590.
Van Lieshout JJ & Karemaker JM (2003). Tracking of cardiac output from arterial pulse wave.Clin Sci104,
239–240.
Van Lieshout JJ, Pott F, Madsen PL, Van Goudoever J & Secher NH (2001). Muscle tensing during standing: effects on cerebral tissue oxygenation and cerebral artery blood velocity.Stroke32, 1546–1551.
Van Lieshout JJ, Toska K, Van Lieshout EJ, Eriksen M, Walloe L & Wesseling KH (2003). Beat-to-beat noninvasive stroke volume from arterial pressure and Doppler ultrasound. Eur J Appl Physiol90, 131–137.
Van Lieshout JJ & Wesseling KH (2001). Continuous cardiac output by pulse contour analysis?Br J Anaesth86, 467–469.
van Popele NM, Bos WJ, de Beer NA, Van der Kuip DA, Hofman A, Grobbee DE & Witteman JC (2000). Arterial stiffness as underlying mechanism of disagreement between an oscillometric blood pressure monitor and a sphygmomanometer.Hypertension36, 484–488.
Vierordt K (1855).Die Lehre Rom Arterienpuls in Gesunden und Klanhen Zustanden. F. Vieweg. Braunschweig.
Weaver MG, Park MK & Lee DH (1990). Differences in blood pressure levels obtained by auscultatory and oscillometric methods.Am J Dis Child144, 911–914.
Wesseling KH, De Wit B, Van der Hoeven GMA,
Van Goudoever J & Settels JJ (1995). Physiocal, calibrating finger vascular physiology for Finapres.Homeostasis36, 67–82.
Wesseling KH, Jansen JRC, Settels JJ & Schreuder JJ (1993). Computation of aortic flow from pressure in humans using a nonlinear, three-element model.J Appl Physiol74,
2566–2573.
Wesseling KH, Smith NT, Nichols WW, Weber H, De Wit B & Beneken JEW (1974). Beat-to-beat cardiac output from the arterial pressure pulse contour. InMeasurement Anaesthesia, ed. Feldman SA, Leigh JM, Spierdijk J, pp. 148–164. Leiden University Press, Leiden.
Westerhof BE, Guelen I, Parati G, Van Groppelli AMG, Wieling W, Wesseling KH & Bos WJW (2002). Variable day/night bias in 24-h non-invasive finger pressure against intrabrachial artery pressure is removed by waveform filtering and level correction.J Hypertens20, 1981–1986. Westerhof N, Elzinga G & Sipkema P (1971). An artificial
arterial system for pumping hearts.J Appl Physiol31, 776–781.
Westerhof N & O’Rourke MF (1995). Haemodynamic basis for the development of left ventricular failure in systolic hypertension and for its logical therapy.J Hypertens13, 943–952.
Westerhof N, Sipkema P, Bos WJW & Elzinga G (1972). Forward and backward waves in the arterial system. Cardiovasc Res6, 648–656.
Whincup PH, Bruce NG, Cook DG & Shaper AG (1992). The Dinamap 1846SX automated blood pressure recorder: comparison with the Hawksley random zero
sphygmomanometer under field conditions.J Epidemiol Community Health46, 164–169.
Wieling W, Van Lieshout JJ & Ten Harkel ADJ (1998). Dynamics of circulatory adjustments to head-up tilt and tilt-back in healthy and sympathetically denervated subjects. Clin Sci94, 347–352.
Wilkinson IB, MacCallum H, Flint L, Cockcroft JR, Newby DE & Webb DJ (2000). The influence of heart rate on
augmentation index and central arterial pressure in humans. J Physiol525, 263–270.
Wilkinson IB, MacCallum H, Hupperetz PC, van Thoor CJ, Cockcroft JR & Webb DJ (2001). Changes in the derived central pressure waveform and pulse pressure in response to angiotensin II and noradrenaline in man.J Physiol530, 541–550.