Urban Drainage
3rd Edition
David Butler
†and
John W. Davies
†††
Professor of Water Engineering
Centre for Water Systems
University of Exeter
††
Professor of Civil Engineering
First published 2000 by E & FN Spon 11 New Fetter Lane, London EC4P 4EE Second Edition published 2004 by Spon Press 11 New Fetter Lane, London EC4P 4EE Third Edition published 2011 by Spon Press
2 Park Square, Milton Park, Abingdon, Oxon, OX14 4RN. Simultaneously published in the USA and Canada by Spon Press. 270 Madison Avenue, New York, NY 10016, USA
Spon Press is an imprint of the Taylor & Francis Group
© 2000, 2004, 2011 David Butler and John W. Davies
All rights reserved. No part of this book may be reprinted or reproduced or utilised in any form or by any electronic, mechanical, or other means, now known or hereafter invented, including photocopying and recording, or in any information storage or retrieval system, without permission in writing from the publishers.
British Library Cataloguing in Publication Data
A catalogue record for this book is available from the British Library
Library of Congress Cataloging-in-Publication Data
Butler, David, 1959–
Urban drainage / David Butler & John W. Davies. — 3rd ed. p. cm.
1. Urban runoff. I. Davies, John W. II. Title. TD657.B88 2009
—dc22
2010024891
978-0-415-45526-8 (pbk) 978-0-415-45525-1 (hbk) 978-0-203-84905-7 (ebk)
This edition published in the Taylor & Francis e-Library, 2010.
To purchase your own copy of this or any of Taylor & Francis or Routledge’s
collection of thousands of eBooks please go to www.eBookstore.tandf.co.uk.
Readership xi
Acknowledgements xiii
Notation list xv
Abbreviations xxiii
1 Introduction 1
1.1 What is urban drainage? 1
1.2 Effects of urbanisation on drainage 2 1.3 Urban drainage and public health 5 1.4 History of urban drainage engineering 5 1.5 Geography of urban drainage 13
2 Approaches to urban drainage 17
2.1 Types of system: piped or natural 17
2.2 Types of piped system: combined or separate 18 2.3 Combined system 18
2.4 Separate system 20
2.5 Combined and separate systems compared 22 2.6 Urban water system 23
3 Water quality 29
3.1 Introduction 29 3.2 Basics 29 3.3 Parameters 31 3.4 Processes 43
vi Contents
4 Wastewater 61
4.1 Introduction 61 4.2 Domestic 62 4.3 Non-domestic 68
4.4 Infiltration and inflow 69 4.5 Wastewater quality 71
5 Rainfall 77
5.1 Introduction 77 5.2 Measurement 78 5.3 Analysis 81 5.4 Single events 90 5.5 Multiple events 92 5.6 Climate change 97
6 Stormwater 106
6.1 Introduction 106 6.2 Runoff generation 106 6.3 Overland flow 114 6.4 Stormwater quality 120
7 System components and layout 131
7.1 Introduction 131 7.2 Building drainage 131 7.3 System components 134 7.4 Design 142
8 Hydraulics 146
8.1 Introduction 146 8.2 Basic principles 147 8.3 Pipe flow 151
8.4 Part-full pipe flow 161 8.5 Open-channel flow 172
9 Hydraulic features 181
9.1 Flow controls 181 9.2 Weirs 190
9.4 Gully spacing 197 9.5 Culverts 202
10 Foul sewers 210
10.1 Introduction 210 10.2 Design 210 10.3 Large sewers 213 10.4 Small sewers 224 10.5 Solids transport 231
11 Storm sewers 242
11.1 Introduction 242 11.2 Design 242
11.3 Contributing area 245 11.4 Rational Method 250 11.5 Time–area Method 257 11.6 Hydrograph methods 262 11.7 Undeveloped site runoff 270
12 Sewer flooding 276
12.1 Introduction 276 12.2 Exceedance 277 12.3 Standards 279 12.4 Flood risk 281 12.5 Management 286
12.6 Integrated urban drainage 291
13 Combined sewers and combined sewer overflows 296
13.1 Background 296 13.2 System flows 296 13.3 The role of CSOs 299
13.4 Control of pollution from combined sewer systems 300 13.5 Approaches to CSO design 304
13.6 Effectiveness of CSOs 318 13.7 CSO design details 321
14 Storage 328
viii Contents
14.3 Sizing 332
14.4 Level pool (or reservoir) routing 333 14.5 Alternative routing procedure 335 14.6 Storage in context 341
15 Pumped systems 343
15.1 Why use a pumping system? 343
15.2 General arrangement of a pumping system 343 15.3 Hydraulic design 345
15.4 Rising mains 351 15.5 Types of pump 353
15.6 Pumping station design 356 15.7 Vacuum systems 363
16 Structural design and construction 366
16.1 Types of construction 366 16.2 Pipes 368
16.3 Structural design 371 16.4 Site investigation 378
16.5 Open-trench construction 381 16.6 Tunnelling 383
16.7 Trenchless methods 385 16.8 Construction costs 387
17 Sediments 391
17.1 Introduction 391 17.2 Origins 393 17.3 Effects 394 17.4 Transport 397 17.5 Characteristics 400 17.6 Self-cleansing design 405
17.7 Load estimation and application 410
18 Operation, maintenance and performance 420
18.1 Introduction 420
18.6 Gas generation and control 437 18.7 Performance 443
18.8 Energy use 445
19 Rehabilitation 449
19.1 Introduction 449 19.2 SRM procedure 453
19.3 Methods of structural repair and renovation 457 19.4 Hydraulic rehabilitation 465
19.5 Balancing cost and risk 466
20 Flow models 469
20.1 Models and urban drainage engineering 469 20.2 Deterministic models 470
20.3 Elements of a flow model 471 20.4 Modelling unsteady flow 473 20.5 Surface flooding 480
20.6 Computer packages 486
20.7 Setting up and using a system model 489 20.8 Flow models in context 494
21 Quality models 500
21.1 Development of quality models 500 21.2 The processes to be modelled 502 21.3 Modelling pollutant transport 504 21.4 Modelling pollutant transformation 508 21.5 Use of quality models 512
21.6 Alternative approaches to modelling 515
22 Stormwater management 519
22.1 Introduction 519 22.2 Devices 521
22.3 SUDS applications 531 22.4 Elements of design 532 22.5 Water quality 539
22.6 Evaluation of SUDS systems 541 22.7 Issues 542
x Contents
23 Low-income communities 551
23.1 Introduction 551 23.2 Health 552
23.3 Option selection 553 23.4 On-site sanitation 556 23.5 Off-site sanitation 560 23.6 Storm drainage 562
24 Integrated management and control 571
24.1 Introduction 571
24.2 Urban Pollution Management 571 24.3 Real-time control 573
24.4 Integrated modelling 580 24.5 In-sewer treatment 586
25 Towards sustainable water management 593
25.1 Introduction 593
25.2 Sustainability in urban drainage 597 25.3 Steps in the right direction 604 25.4 Assessing sustainability 609 25.5 Urban futures 612
Useful websites 620
In this book, we cover engineering and environmental aspects of the drainage of rainwater and wastewater from areas of human development. We present basic principles and engineering best practice. The principles are essentially universal but, in this book, are mainly illustrated by UK practice. We have also included introductions to current developments and recent research.
The book is primarily intended as a text for students on undergraduate and postgraduate courses in Civil or Environmental Engineering and researchers in related fields. We hope engineering aspects are treated with sufficient rigour and thoroughness to be of value to practising engineers as well as students, though the book does not take the place of an engineering manual.
The basic principles of drainage include wider environmental issues, and these are of significance not only to engineers, but to all with a serious interest in the urban environment, such as students, researchers and prac-titioners in environmental science, technology, policy and planning, geography and health studies. These wider issues are covered in particular parts of the book, deliberately written for a wide readership (indicated in the table overleaf). The material makes up a significant portion of the book, and if these sections are read together, they should provide a coher-ent and substantial insight into a fascinating and important environmcoher-ental topic.
xii Readership
Chapter Coverage of wider issues
1 All
2 All
3 3.5, 3.6
12 12.I
13 13.1, 13.2, 13.3 17 17.1, 17.2 18 18.1, 18.2
19 19.1
20 20.1, 20.2, 20.3 21 21.1, 21.2
22 22.1, 22.2, 22.3, 22.6, 22.7
23 All
24 24.1, 24.2
We remain hugely grateful to all who gave us support in writing editions 1 and 2 of this book and to our colleagues around the world.
For help with edition 3, we particularly thank Professor Slobodan Djordjevi´c, Professor Dragan Savi´c and Dr Fayyaz A Memon, University of Exeter; Dr Christian Onof, Imperial College London; Professor Richard Ashley, University of Sheffield; Professor Chris Jefferies, University of Abertay Dundee; Richard Kellagher, HR Wallingford; Dr Jaena Ryu, former PhD student at Imperial College London; Kevin Enfinger, ADS Environmental Services; Professor Bob Crabtree and Nick Orman, WRc; Dr Mike Faram, Hydro International; and Dr Chris Digman, MWH.
a constant
a50 effective surface area for infiltration
A catchment area
cross-sectional area plan area
Ab area of base
AD impermeable area from which runoff received Agr sediment mobility parameter
Ai impervious area
Ao area of orifice
Ap gully pot cross-sectional area
API5 FSR 5-day antecedent precipitation index ARF FSR rainfall areal reduction factor
b width of weir
sediment removal constant constant
bp width of Preissman slot
br sediment removal constant (runoff) bs sediment removal constant (sweeping)
B flow width
Bc outside diameter of pipe
Bd downstream chamber width (high side weir) width of trench at top of pipe
Bu upstream chamber width (high side weir)
c concentration
channel criterion
design number of appliances wave speed
c0 dissolved oxygen concentration
c0s saturation dissolved oxygen concentration cv volumetric sediment concentration
xvi Notation list
consequence of an occurrence Cd coefficient of discharge Cv volumetric runoff coefficient CR dimensionless routing coefficient
d depth of flow
depression storage d' sediment particle size
dc critical depth
dm hydraulic mean depth
dn normal depth
du upstream depth
d1 depth upstream of hydraulic jump d2 depth downstream of hydraulic jump
d50 sediment particle size larger than 50% of all particles
D internal pipe diameter
rainfall duration
wave diffusion coefficient
longitudinal dispersion coefficient
Do orifice diameter
Dgr sediment dimensionless grain size
Dp gully pot diameter
DWF dry weather flow
e voids ratio
sediment accumulation rate in gully
E specific energy
gully hydraulic capture efficiency industrial effluent flow-rate
EBOD Effective BOD5
f soil infiltration rate potency factor
fc soil infiltration capacity fo soil initial infiltration rate
fs number of sweeps per week
ft soil infiltration rate at time t
Fm bedding factor
Fr Froude number
Fse factor of safety
g acceleration due to gravity
G water consumption per person
G' wastewater generated per person
h head
ha acceleration head
hlocal local head loss hmax depth of water
gully pot trap depth
H total head
difference in water level
height of water surface above weir crest depth of cover to crown of pipe
Hc height of culvert (internal vertical dimension)
Hmin minimum difference in water level for non-drowned orifice
i rainfall intensity
ie effective rainfall intensity in net rainfall intensity
I inflow rate
pipe infiltration rate rainfall depth
IF effective impervious area factor
IMKP maximum rainfall density over 5 minutes
j time
J housing density
criterion of satisfactory service empirical coefficient
k constant
kb effective roughness value of sediment dunes kDU dimensionless frequency factor
kL local head loss constant
ks pipe roughness
kT constant at T°C
k1 depression storage constant k2 Horton’s decay constant
k3 unit hydrograph exponential decay constant k4 pollutant washoff constant
k5 amended pollutant washoff constant k20 constant at 20 °C
K routing constant
constant in CSO design (Table 12.6) Rankine’s coefficient
empirical coefficient
KLA volumetric reaeration coefficient KPBOD BOD5potency factor
L length
load-rate gully spacing
xviii Notation list
m Weibull’s event rank number
reservoir outflow exponent
M mass
empirical coefficient
Ms mass of pollutant on surface
MT-D FSR rainfall depth of duration Dwith a return period T
n number
Manning’s roughness coefficient porosity
nDU number of discharge units
N total number
Bilham’s number of rainfall events in 10 years NAPI new antecedent precipitation index
O outflow rate
p pressure
probability of appliance discharge BOD test sample dilution
projection ratio
P wetted perimeter
perimeter of infiltration device population
power probability
probability of an occurrence
height of weir crest above channel bed Pd downstream weir height (high side weir)
PF peak factor
PF porosity factor
Ps surcharge pressure
Pu upstream weir height (high side weir) PIMP FSR percentage imperviousness
PR WP percentage runoff
q flow per unit width
appliance flow-rate
Q flow-rate
Qav average flow-rate Qb gully bypass flow-rate QBARrural mean annual peak flow
Qc gully capacity
Qd continuation flow-rate (high side weir) Qf pipe-full flow-rate
Qmin minimum flow
Qo wastewater baseflow
Qr runoff flow-rate Qu inflow (high side weir)
Q— gully approach flow
Q—L limiting gully approach flow
r probability that an event will equal or exceed the design storm at least once in Nyears
number of appliances discharging simultaneously
FSR ratio of 60 min to 2 day 5 year return period rainfall rb oxygen consumption rate in the biofilm
rs oxygen consumption rate in the sediment rsd settlement deflection ratio
rw oxygen consumption rate in the bulk water
R hydraulic radius
ratio of drained area to infiltration area total risk
Re Reynolds number
RMED FEH median of annual rainfall maxima
s ground slope
S storage volume
soil moisture storage depth Sc critical slope
Sd sediment dry density
Sf hydraulic gradient or friction slope SG specific gravity
So pipe, or channel bed, slope
SAAR FSR standard average annual rainfall SMD FSR soil moisture deficit
SOIL FSR soil index
t time
pipe wall thickness
t' duration of appliance discharge tc time of concentration
te time of entry
tf time of flow
tp time to peak
T rainfall event return period wastewater temperature
pump cycle (time between starts) T' mean interval between appliance use
Ta approach time
Tc time between gully pot cleans
u unit hydrograph ordinate
U* shear velocity
xx Notation list
v mean velocity
vc critical velocity vf pipe-full flow velocity vGS gross solid velocity
vL limiting velocity without deposition vmax maximum flow velocity
vmin minimum flow velocity
vt threshold velocity required to initiate movement
V volume
Vf volume of first flush
VI inflow volume
VO outflow volume
baseflow volume in approach time Vt basic treatment volume
w channel bottom width
pollutant-specific exponent
W width of drainage area
pollutant washoff rate
Wb sediment bed width
Wc soil load per unit length of pipe
Wcsu concentrated surcharge load per unit length of pipe We effective sediment bed width
external load per unit length of pipe Ws settling velocity
Wt crushing strength per unit length of pipe Ww liquid load per unit length of pipe
x longitudinal distance
return factor
X chemical compound
y depth
Y chemical element
Yd downstream water depth (high side weir) Yu upstream water depth (high side weir)
z potential head
side slope
Z index of hydrogen sulphide generation
Z' modified Z formula index
Z1 pollutant-specific constant FSR growth factor Z2 pollutant-specific constant
FSR growth factor
a channel side slope angle to horizontal number of reservoirs
empirical coefficient
b empirical coefficient
g empirical coefficient
ε empirical coefficient
gully pot sediment retention efficiency
ε' gully pot cleaning efficiency
sediment washoff rate
h sediment transport parameter
pump efficiency
u transition coefficient for particle Reynolds number angle subtended by water surface at centre of pipe Arrhenius temperature correction factor
sediment supply rate
l friction factor
lb friction factor corresponding to the sediment bed
lc friction factor corresponding to the pipe and sediment bed lg friction factor corresponding to the grain shear factor m coefficient of friction
m' coefficient of sliding friction
n kinematic viscosity
r density
tb critical bed shear stress to boundary shear stress
g unit weight
temperature correction factor
surface sediment load
u ultimate (equilibrium) surface sediment load
v counter
c shape correction factor for part-full pipe
AMP Asset management planning
AOD Above ordnance datum
ARF Areal reduction factor
ASCE American Society of Civil Engineers
ATU Allylthiourea
BHRA British Hydrodynamics Research Association
BOD Biochemical oxygen demand
BRE Building Research Establishment
BS British Standard
CAD Computer aided drawing/design
CARP Comparative acceptable river pollution procedure
CBOD Carbonaceous biochemical oxygen demand
CCTV Closed-circuit television
CEC Council of European Communities
CEN European Committee for Standardisation
CFD Computational fluid dynamics
CIWEM Chartered Institution of Water and Environmental Management
CIRIA Construction Industry Research and Information Association
COD Chemical oxygen demand
CSO Combined sewer overflow
DEM Digital elevation model
DG5 OFWAT performance indicator
DO Dissolved oxygen
DoE Department of the Environment
DOT Department of Transport
DN Nominal diameter
DTM Digital terrain model
DU Discharge unit
EA Environment Agency
xxiv Abbreviations
ECOsan Ecological sanitation
EFRA Exceedance flood risk assessment
EGL Energy grade line
EMC Event mean concentration
EN European Standard
EPA Environmental Protection Agency (US)
EQO Environmental quality objectives
EQS Environmental quality standards
EWPCA European Water Pollution Control Association
FC Faecal coliform
FEH Flood Estimation Handbook
FOG Fats, oils and grease
FORGEX FEH focused rainfall growth curve extension method
FS Faecal streptococci
FSR Flood Studies Report
FWR Foundation for Water Research
GIS Geographical information system
GL Ground level
GMT Greenwich Mean Time
GRP Glass reinforced plastic
HDPE High density polyethylene
HGL Hydraulic grade line
HMSO Her Majesty’s Stationery Office
HR Hydraulics Research
HRS Hydraulics Research Station
IAHR International Association of Hydraulic Engineering and Research
IAWPRC International Association on Water Pollution Research and Control
IAWQ International Association on Water Quality
ICE Institution of Civil Engineers
ICP Inductively coupled plasma
IDF Intensity – duration – frequency
IE Intestinal enterococci
IL Invert level
IoH Institute of Hydrology
IUD Integrated urban drainage
IWA International Water Association
IWEM Institution of Water and Environmental Management LC50 Lethal concentration to 50% of sample organisms
LiDAR Light detection and ranging
LOD Limit of deposition
LSTD Limiting solids transport distance
MDG Millennium development goal
MDPE Medium density polyethylene
MH Manhole
MPN Most probable number
NERC Natural Environment Research Council
NOD Nitrogenous oxygen demand
NRA National Rivers Authority
NWC National Water Council
Ofwat Water Services Regulation Authority
OD Outside diameter
Open MI Open Modelling Interface and Environment
OS Ordnance Survey
PAH Polyaromatic hydrocarbons
PCB Polychlorinated biphenyl
PID proportional–integral–derivative
PVC-U Unplasticised polyvinylchloride
QUALSOC Quality impacts of storm overflows: consent procedure
RRL Road Research Laboratory
RTC Real-time control
SAR Synthetic aperture radar
SAAR Standard annual average rainfall
SCADA Supervisory Control and Data Acquisition
SDD Scottish Development Department
SEPA Scottish Environmental Protection Agency
SOD Sediment oxygen demand
SRM Sewerage Rehabilitation Manual
SG Specific gravity
SS Suspended solids
STC Standing Technical Committee
SUDS Sustainable (urban) drainage systems
SWMP Surface water management plan
SWO Stormwater outfall
TBC Toxicity-based consents
TKN Total Kjeldahl nitrogen
TOC Total organic carbon
TRRL Transport & Road Research Laboratory
TWL Top water level
UKWIR United Kingdom Water Industry Research
ULFT Ultra low flush toilet
UPM Urban pollution management
WAA Water Authorities Association
WaPUG Wastewater Planning User Group
WC Water closet (toilet)
xxvi Abbreviations
WFD Water Framework Directive
WMO World Meteorological Organisation
WP Wallingford Procedure
WPCF Water Pollution Control Federation (US)
WSA Water Services Association
WTP Wastewater treatment plant
WO Welsh Office
Introduction
1.1 What is urban drainage?
Drainage systems are needed in developed urban areas because of the interaction between human activity and the natural water cycle. This inter-action has two main forms: the abstrinter-action of water from the natural cycle to provide a water supply for human life, and the covering of land with impermeable surfaces that divert rainwater away from the local natural system of drainage. These two types of interaction give rise to two types of water that require drainage.
The first type, wastewater, is water that has been supplied to support life, maintain a standard of living and satisfy the needs of industry. After use, if not drained properly, it could cause pollution and create health risks. Wastewater contains dissolved material, fine solids and larger solids, originating from WCs, from washing of various sorts, from industry and from other water uses.
The second type of water requiring drainage, stormwater, is rainwater (or water resulting from any form of precipitation) that has fallen on a built-up area. If stormwater were not drained properly, it would cause inconvenience, damage, flooding and further health risks. It contains some pollutants, originating from rain, the air or the catchment surface.
Urban drainage systems handle these two types of water with the aim of minimising the problems caused to human life and the environment. Thus urban drainage has two major interfaces: with the public and with the environment (Fig. 1.1). The public is usually on the transmitting rather than receiving end of services from urban drainage (‘flush and forget’), and
PUBLIC ENVIRONMENT
URBAN DRAINAGE
SYSTEM
FLUSHING
FLOODING
POLLUTION
RAINFALL
2 Introduction
this may partly explain the lack of public awareness and appreciation of a vital urban service.
In many urban areas, drainage is based on a completely artificial system of sewers: pipes and structures that collect and dispose of this water. In contrast, isolated or low-income communities normally have no main drainage. Wastewater is treated locally (or not at all) and stormwater is drained naturally into the ground. These sorts of arrangements have gener-ally existed when the extent of urbanisation has been limited. However, as will be discussed later in the book, recent thinking – towards more sustain-able drainage practices – is encouraging the use of more natural drainage arrangements wherever possible.
So there is far more to urban drainage than the process of getting the flow from one place to another via a system of sewers (which a non-specialist could be forgiven for finding untempting as a topic for general reading). For example, there is a complex and fascinating relationship between wastewater and stormwater as they pass through the system, partly as a result of the historical development of urban drainage. When wastewater and stormwater become mixed, in what are called ‘combined sewers’, the disposal of neither is ‘efficient’ in terms of environmental impact or sustainability. Also, while the flow is being conveyed in sewers, it undergoes transformation in a number of ways (to be considered in detail in later chapters). Another critical aspect is the fact that sewer systems may cure certain problems, for example health risks or flooding, only to create others in the form of environmental disruption to natural watercourses elsewhere.
Overall, urban drainage presents a classic set of modern environmental challenges: the need for cost-effective and socially acceptable technical improvements in existing systems, the need for assessment of the impact of those systems, and the need to search for sustainable solutions. As in all other areas of environmental concern, these challenges cannot be considered to be the responsibility of one profession alone. Policy-makers, engineers, environment specialists, together with all citizens, have a role. And these roles must be played in partnership. Engineers must understand the wider issues, while those who seek to influence policy must have some understand-ing of the technical problems. This is the reasonunderstand-ing behind the format of this book, as explained in the Preface. It is intended as a source of information for all those with a serious interest in the urban environment.
1.2 Effects of urbanisation on drainage
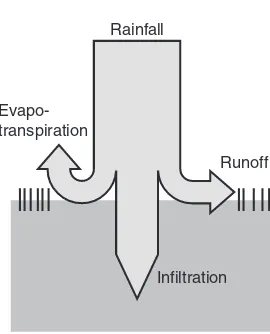
In nature, when rainwater falls on a natural surface, some water returns to the atmosphere through evaporation, or transpiration by plants; some infil-trates the surface and becomes groundwater; and some runs off the surface (Fig. 1.2(a)). The relative proportions depend on the nature of the surface, and vary with time during the storm. (Surface runoff tends to increase as the ground becomes saturated.) Both groundwater and surface runoff are likely to find their way to a river, but surface runoff arrives much faster. The groundwater will become a contribution to the river’s general baseflow rather than being part of the increase in flow due to any particular rainfall.
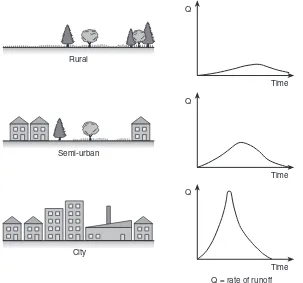
Development of an urban area, involving covering the ground with arti-ficial surfaces, has a significant effect on these processes. The artiarti-ficial sur-faces increase the amount of surface runoff in relation to infiltration, and therefore increase the total volume of water reaching the river during or soon after the rain (Fig. 1.2(b)). Surface runoff travels quicker over hard surfaces and through sewers than it does over natural surfaces and along natural streams. This means that the flow will both arrive and die away faster, and therefore the peak flow will be greater (see Fig. 1.3). (In addi-tion, reduced infiltration means poorer recharge of groundwater reserves.)
This obviously increases the danger of sudden flooding of the river. It also has strong implications for water quality. The rapid runoff of stormwater is likely to cause pollutants and sediments to be washed off the surface or scoured by the river. In an artificial environment, there are likely to be more pollutants on the catchment surface and in the air than there would be in a natural environment. Also, drainage systems in which there is mixing of wastewater and stormwater may allow pollutants from the wastewater to enter the river.
(a) Pre-urbanisation (b) Post-urbanisation
Rainfall
Evapo-transpiration
Runoff
Infiltration
Rainfall
Evapo-transpiration Runoff
Infiltration
4 Introduction
The existence of wastewater in significant quantities is itself a consequence of urbanisation. Much of this water has not been made particularly ‘dirty’ by its use. Just as it is a standard convenience in a developed country to turn on a tap to fill a basin, it is a standard convenience to pull the plug to let the water ‘disappear’. Water is also used as the principal medium for disposal of bodily waste, and varying amounts of bathroom litter, via WCs.
In a developed system, much of the material that is added to the water while it is being turned into wastewater is removed at a wastewater treatment plant prior to its return to the urban water cycle. Nature itself would be capable of treating some types of material, bodily waste for example, but not in the quantities created by urbanisation. The proportion of material that needs to be removed will depend in part on the capacity of the river to assimilate what remains.
So the general effects of urbanisation on drainage, or the effects of replacing natural drainage by urban drainage, are to produce higher and more sudden peaks in river flow, to introduce pollutants, and to create the need for artificial wastewater treatment. While to some extent impersonat-ing nature, urban drainage also imposes heavily upon it.
Rural
Semi-urban
Time Q
Time Q
Time Q
City
1.3 Urban drainage and public health
In human terms, the most valuable benefit of an effective urban drainage system is the maintenance of public health. This particular objective is often overlooked in modern practice and yet is of extreme importance, particularly in protection against the spread of diseases.
Despite the fact that some vague association between disease and water had been known for centuries, it was only comparatively recently (1855) that a precise link was demonstrated. This came about as a result of the classic studies of Dr John Snow in London concerning the cholera epi-demic sweeping the city at the time. That diseases such as cholera are almost unknown in the industrialised world today is in major part due to the provision of centralised urban drainage (along with the provision of a microbiologically safe, potable supply of water).
Urban drainage has a number of major roles in maintaining public health and safety. Human excreta (particularly faeces) are the principal vector for the transmission of many communicable diseases. Urban drainage has a direct role in effectively removing excreta from the imme-diate vicinity of habitation. However, there are further potential problems in large river basins in which the downstream discharges of one settlement may become the upstream abstraction of another. In the UK, some 30% of water supplies are so affected. This clearly indicates the vital importance of disinfection of water supplies as a public health measure.
Also, of particular importance in tropical countries, standing water after rainfall can be largely avoided by effective drainage. This reduces the mosquito habitat and hence the spread of malaria and other diseases.
Whilst many of these problems have apparently been solved, it is essen-tial that in industrialised countries, as we look for ever more innovative sanitation techniques, we do not lose ground in controlling serious dis-eases. Sadly, whilst we may know much about waterborne and water-related diseases, some rank among the largest killers in societies where poverty and malnutrition are widespread. Millions of people around the world still lack any hygienic and acceptable method of excreta disposal. The issues associated with urban drainage in low-income communities are returned to in more detail in Chapter 23.
1.4 History of urban drainage engineering
Early history
6 Introduction
environment. Natural hydrological processes would have prevailed; there might have been floods in extreme conditions, but these would not have been made worse by human alteration of the surface of the ground. Bodily wastes would have been ‘treated’ by natural processes.
Artificial drainage systems were developed as soon as humans attempted to control their environment. Archaeological evidence reveals that drainage was provided to the buildings of many ancient civilisations such as the Mesopotamians, the Minoans (Crete) and the Greeks (Athens). The Romans are well known for their public health engineering feats, particularly the impressive aqueducts bringing water intothe city; less spectacular, but equally vital, were the artificial drainsthey built, of which the most well known is the cloaca maxima, built to drain the Roman Forum (and still in use today).
The English word sewer is derived from an Old French word, essever, meaning ‘to drain off’, related to the Latin ex- (out) and aqua (water). The Oxford English Dictionary gives the earliest meaning as ‘an artificial water-course for draining marshy land and carrying off surface water into a river or the sea’. Before 1600, the word was not associated with wastewater.
London
The development of drainage in London provides a good example of how the association between wastewater and stormwater arose. Sewers origin-ally had the meaning given above and their alignment was loosely based on the natural network of streams and ditches that preceded them. In a quite unconnected arrangement, bodily waste was generally disposed of into cesspits (under the residence floor), which were periodically emptied. Flush toilets (discharging to cesspits) became common around 1770–1780, but it remained illegal until 1815 to connect the overflow from cesspits to the sewers. This was a time of rapid population growth and, by 1817, when the population of London exceeded one million, the only solution to the problem of under-capacity was to allow cesspit overflow to be connected to the sewers. Even then, the cesspits continued to be a serious health problem in poor areas, and, in 1847, 200000 of them were eliminated completely by requiring houses to be connected directly to the sewers.
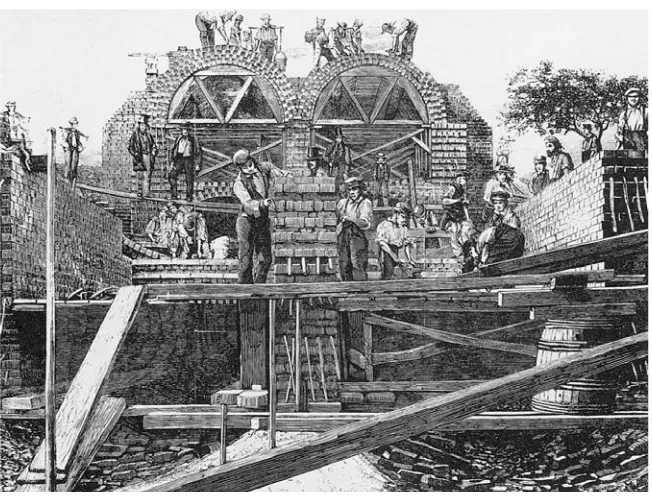
This moved the problem elsewhere – namely, the River Thames. By the 1850s, the river was filthy and stinking (Box 1.1) and directly implicated in the spread of deadly cholera.
prevented his ideas from being put into practice. The solution was eventu-ally found in a plan by Joseph Bazalgette to construct a number of ‘com-bined’ interceptor sewers on the north and the south of the river to carry the contents of the sewers to the east of London. The scheme, an engin-eering marvel (Fig. 1.4), was mostly constructed by 1875, and much of it is still in use today (Halliday, 2001).
Again, though, the problem had simply been moved elsewhere. This time, it was the Thames estuary, which received huge discharges of waste-water. Storage was provided to allow release on the ebb tide only, but there was no treatment. Downstream of the outfalls, the estuary and its banks were disgustingly polluted. By 1890, some separation of solids was carried out at works on the north and south banks, with the sludge dumped at sea. Biological treatment was introduced in the 1920s, and further improvements followed. However, it was not until the 1970s that the quality of the Thames was such that salmon were commonplace and porpoises could be seen under Blackfriars Bridge.
UK generally
After the Second World War, many parts of the UK had effective wastewater treatment facilities, but there could still be significant wastewater pollution during wet weather. Most areas were drained by combined sewers, carrying wastewater and stormwater in the same pipe. (The first origins of this system can be found in the connection of wastewater to stormwater sewers, as described above.) Such a system must include combined sewer overflows
Box 1.1 Michael Faraday’s abridged letter toThe Times of 7th July 1855
I traversed this day by steamboat the space between London and Hungerford Bridges [on the River Thames], between half-past one and two o’clock. The appearance and smell of water forced them-selves on my attention. The whole of the river was an opaque pale brown fluid. The smell was very bad, and common to the whole of the water. The whole river was for the time a real sewer.
8 Introduction
(CSOs) to provide relief during rain storms, allowing excess flows to escape to a nearby river or stream. As we will discover, CSOs remain a problem today.
During the 1950s and 1960s, there was significant research effort on improving CSO design. This led to a number of innovative new arrange-ments, and to general recommendations for reducing pollution. Most sewer systems in the UK today are still combined, even though from 1945 it had become the norm for newly-constructed developments to be drained by a separate system of sewers (one pipe for wastewater, one for storm-water). These issues will be explored further in Chapters 2 and 13.
However, in some parts of the UK, particularly around industrial estu-aries like the Mersey and the Tyne, there were far more serious problems of wastewater pollution than those caused by CSOs. In those areas all wastewater, in wet and dry weather, was discharged directly to the estuary without any treatment at all. Box 1.2 considers the Tyne, and the work that was done to improve matters.
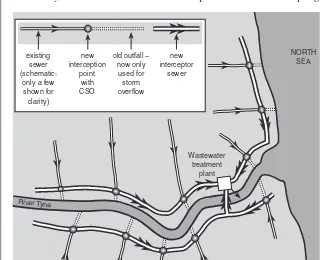
Box 1.2 Tyneside interceptor sewer scheme
Tyneside had undergone rapid development during the industrial revolution, and those providing housing for the rapidly expanding workforce had not felt it necessary to look further than the con-veniently placed Tyne for disposal of stormwater and untreated wastewater. The area was drained by a multitude of main sewers running roughly perpendicular to the river, discharging untreated wastewater along the length of the north and south banks even in dry weather. This unpleasant situation had existed for many years. The sewer systems were the responsibility of a number of different local authorities and, since pollution was considered to have low political priority, the effort to find a comprehensive solution was not made until the 1960s with the formation of an overall sewerage authority. This authority drew up plans for interceptor sewers running along both sides of the Tyne picking up the flows from each main sewer and taking them to a treatment works. A tunnel under the Tyne was needed to bring flows from the south (Fig. 1.5).
The Tyneside scheme also included provision for intercepting
NORTH
The water industry
In 1974, the water industry in England and Wales was reorganised, and water authorities were formed. These were public authorities that con-trolled most aspects of the water cycle, including water supply (except in areas where private water companies existed). However, most new water authorities allowed local authorities to remain in charge of sewerage, acting as agents. The overall control of the water authorities generally allowed more regional planning and application of overall principles. This was helped by the expanded Water Research Centre, whose pragmatic, common-sense approaches encouraged improvement in the operation of sewer systems. However, drainage engineering remained a fairly low-tech business, with drainage engineers generally rather conservative, relying on experience rather than specialised technology to solve problems.
Modelling
A change came in the early 1980s, with the introduction of computer modelling of sewer systems. Such models had been available in the US for a while, but the first modelling package written for UK conditions, WASSP (Wallingford Storm Sewer Package), which was based on a set of calcula-tions covering rainfall, runoff and pipe flow called the Wallingford Pro-cedure, was launched in 1981. The first version was not particularly user-friendly and needed a mainframe computer to run on, but later the software was developed in response to the development of computers and the demand for a good user interface. The tool had a profound effect on the attitudes and practices of drainage engineers. To model a system, its physical data had to be known; creating computer models therefore demanded improvement in sewer records. The use of models encouraged far more understanding of how a system actually worked. A philosophy that high-tech problem analysis could make huge savings in construction costs became established.
Modelling of drainage systems is considered in Chapters 20 and 21. wastewater from a coastal strip to the north of the Tyne. Here, again, wastewater had received no treatment and was discharged via sea outfalls that barely reached the low tide mark. The area was drained by combined sewers, and some overflows had consisted simply of outlet relief pipes discharging from holes in the seawall at the top of the beach, so that in wet weather the overflow from the combined sewer flowed across the popular beach to the sea.
The 1990s
As drainage engineers in the UK moved into the 1990s, they experienced two major changes. The first was that the industry was reorganised again. In England and Wales, the water authorities were privatised. Regulatory func-tions that had been carried out internally, like pollution-monitoring, were moved to a new organisation: the National Rivers Authority, which, in turn, became part of the Environment Agency in 1996. Later, in Scotland, three large water authorities took over water functions from local authorities (and were merged into one large authority in 2002).
The other big change was the gradual application of much more strin-gent pollution regulations set by the European Union. The Bathing Water Directive (CEC, 1976) required ‘bathing waters’ to be designated, and for their quality to comply with bacterial standards. Huge investment in coastal wastewater disposal schemes was carried out in response. For example, in the south-west of England, the ‘clean sweep’ programme was developed to improve the sea water quality at eighty-onebeaches and their surroundings. This was based on thirty-two engineering schemes valued at £900 million (Brokenshire, 1995).
In Brighton and Hastings on England’s south coast, huge combined sewer storage tunnels were constructed to avoid CSO spills onto local beaches during storm events. And in the north-east of England, similar major investment was made along the route of the coastal interceptor sewer constructed in the 1970s, already described in Box 1.2. So, on that length of coast, there was a great deal of change in twenty years: from the contents of combined sewers overflowing all over the beach, to massive storage tunnels satisfying strict limits on storm discharges to the sea (Firth and Staples, 1995).
The Urban Waste Water Treatment Directive (CEC, 1991) also had far-reaching effects. This specified a minimum level of wastewater treatment, based on the urban population size and the receiving water type, to be achieved by 2005. Sea disposal of sludge was completely banned by the end of 1998. Pollution standards are considered in Chapter 3.
Early twenty-first century
12 Introduction
An emerging, if controversial, threat is that of climate change. The anthropogenic impact on our global climate now seems to have been demonstrated conclusively, but the implications are not fully understood. Our best predictions indicate that there will be significant changes to the rainfall regime, and these are discussed in Chapter 5. These changes must, in turn, be taken into account in new drainage design. The implications for existing systems are a matter for research (Evans et al., 2003).
One of the most serious implications is the increased potential for sewer (pluvial) flooding. External or, even worse, internal flooding with sewage is considered to be wholly unacceptable in the twenty-first century according to some sources (WaterVoice Yorkshire, 2002). Given the sto-chastic nature of rainfall and the potential for more extreme events in the future, this is an area that is likely to require careful attention by urban drainage researchers and practitioners (as considered further in Section 11.2.2). The relationship between urban drainage and surface flooding has become a key area (Chapter 12).
Changing aims
It has already been stated that the basic function of urban drainage is to collect and convey wastewater and stormwater. In the UK and other developed countries, this has generally been taken to cover all wastewater, and all it contains (subject to legislation about hazardous chemicals and industrial effluents). For stormwater, the aim has been to remove rainwater (for storms up to a particular severity) with the minimum of inconvenience to activities on the surface.
Most people would see the efficient removal of stormwater as part of ‘progress’. In a developing country, they might imagine a heavy rainstorm slowing down the movement of people and goods in a sea of mud, whereas in a city in a developed country they would probably consider that it should take more than mere rainfall to stop transport systems and busi-nesses from running smoothly. Nowadays, however, as with other aspects of the environment, the nature of progress in relation to urban drainage, its consequences, desirability and limits, are being closely reassessed.
attempt to reverse the trend illustrated in Fig. 1.3: to decrease the peak flow of runoff and increase the time it takes to reach the watercourse.
Another way in which attempts are being made to reverse the effects of urbanisation on drainage described in Section 1.2 is to reduce the non-biodegradable content in wastewater. Public campaigns with slogans like ‘bag it and bin it, don’t flush it’ or ‘think before you flush’ have been mounted to persuade people not to treat the WC as a rubbish bin.
These tendencies towards reducing the dependence on ‘hard’ engineer-ing solutions to solve the problems created by urbanisation, and the phil-osophy that goes with them, are associated with the word ‘sustainability’ and are further considered in Chapter 25.
The imperative of climate change affects urban drainage directly and indirectly. Clearly our approaches to urban drainage must adapt to climate change because of the predicted changes in rainfall patterns. We consider this in Chapter 5. Also, drainage engineers must play their part in minimis-ing carbon emissions, and in Chapter 18 we consider energy use reduction and renewable energy generation.
1.5 Geography of urban drainage
The main factors that determine the extent and nature of urban drainage provision in a particular region are:
• wealth
• climate and other natural characteristics • intensity of urbanisation
• history and politics.
The greatest differences are the result of differences in wealth. Most of this book concentrates on urban drainage practices in countries that can afford fully engineered systems. The differences in countries that cannot will be apparent from Chapter 23 where we consider low-income communities.
Countries in which rainfall tends to be occasional and heavy have natu-rally adopted different practices from those in which it is frequent and generally light. For example, it is common in Australia to provide ‘minor’ (underground, piped) systems to cope with low quantities of stormwater, together with ‘major’ (overground) systems for larger quantities. We return to this concept in Chapter 12. Other natural characteristics have a significant effect. Sewers in the Netherlands, for example, must often be laid in flat, low-lying areas and, therefore, must be designed to run fre-quently in a pressurised condition.
14 Introduction
Historical and political factors determine the age of the system (which is likely to have been constructed during a period of significant development and industrialisation), characteristics of operation such as whether or not the water/wastewater industry is publicly or privately financed, and strict-ness of statutory requirements for pollution control and the manner in which they are enforced. Countries in the European Union are subject to common requirements, as described in Section 1.4.
Boxes 1.3 to 1.5 present a selection of examples to give an idea of the wide range of different urban drainage problems throughout the world.
Box 1.3 Orangi, Karachi, Pakistan
The squatter settlement of Orangi in Karachi (New Scientist, 1 June 1996) had a population of about one million. It had some piped water supplies but, until the 1980s, had no sewers. People had to empty bucket latrines into the narrow alleys. In a special self-help programme, quite different from govern-ment-sponsored improvement schemes, the community built its own sewers, with no outside contractors. A small septic tank was placed between the toilet and the sewer to reduce the entry of solids into the pipe. The system itself had a simplified design. The wastewater was carried to local rivers and was discharged untreated. The system was built up alley-by-alley, as the people made the commitment to the improvements. This was a great success for community action, and created major improvements in the immediate environment. The approach used in the Orangi project has had a wide influ-ence within Pakistan (Tayler et al., 2003).
Table 1.1 Percentage of population connected to main sewers in selected European countries (1997 figures)
Country % population connected to sewer
Germany 92
Greece 58
Italy 82
Netherlands 97
Portugal 62
Box 1.4 Villages in Hong Kong
A scheme in Hong Kong (Lei et al., 1996) has provided sewers for previ-ously unsewered villages. Here residents had ‘discharged their toilet waste into septic tanks which very often overflowed due to improper mainte-nance, while their domestic sullage is discharged into the surface drains’. This had caused pollution of streams and rivers, and contributed to pollu-tion of coastal waters (causing ‘red tides’). A new scheme provided sewers to remove the need for the septic tanks and carry the wastewater to exist-ing treatment facilities. One problem durexist-ing construction was ‘Feng Shui’, the traditional Chinese belief that the orientation of features in the urban landscape may affect the health and good luck of the people living there. When carrying out sewer construction within traditional Chinese villages, engineers had to take great care over these issues, by consultation with residents.
Box 1.5 Zagreb, Croatia
In preparation for European Union membership, Croatia has been working towards implementing EU directives. The capital city, Zagreb has a sewer system serving one million inhabitants. At present there is no WWTP. The sewer network has very large conduits, but almost no CSOs. Discharge is to the River Sava. One of the biggest issues is the number of natural streams that are connected into the sewer system (Dedus and Pavlekovic, 1997).
There are clearly significant challenges in developing and enhancing these arrangements to comply with EU requirements but the approach being taken is ambitious and based on use of comprehensive modelling approaches to define the behaviour and requirements of the system as a whole.
16 Introduction
Problems
1.1 Do you think urban drainage is taken for granted by most people in developed countries? Why? Is this a good or bad thing?
1.2 How does urbanisation affect the natural water cycle?
1.3 Some claim that urban drainage engineers, throughout history, have saved more lives than doctors and nurses. Can that be justified, nationally and internationally?
1.4 Pollution from urban discharges to the water environment should be controlled in some way. What are the reasons for this? How should the limits be determined? Could there be such a thing as a requirement that is too strict? If so, why?
1.5 What have been the main influences on urban drainage engineers since the start of their profession?
References
Brokenshire, C.A. (1995) South West Water’s ‘clean sweep’ programme: some engineering and environmental aspects. Journal of the Institution of Water and Environmental Management, 9(6), December, 602–613.
CEC (2000) Directive Establishing a Framework for Community Action in the Field of Water Policy, 2000/60/EC.
Council of European Communities (1976) Directive concerning the quality of bathing water (76/160/EEC).
Council of European Communities (1991) Directive concerning urban waste water treatment (91/271/EEC).
Dedus, B. and Pavlekovic, M. (1997) Application of a novel approach to sewer system analysis. European Water Pollution Control, 7(5), 43–48.
Evans, E.P., Thorne, C.R., Saul, A., Ashley, R., Sayers, P.N., Watkinson, A., Penning-Rowsell, E.C. and Hall, J.W. (2003) An Analysis of Future Risks of Flooding and Coastal Erosion for the UK Between 2030–2100. Overview of Phase 2.Foresight Flood and Coastal Defence Project, Office of Science and Technology.
Firth, S.J. and Staples, K.D. (1995) North Tyneside bathing waters scheme. Journal of the Institution of Water and Environmental Management, 9(1), February, 55–63.
Halliday, S. (2001) The Great Stink of London: Sir Joseph Balzalgette and the Cleansing of the Victorian Metropolis, Sutton Publishing.
Lei, P.C.K., Wong, H.Y., Liu, P.H. and Tang, D.S.W. (1996) Tackling sewage pol-lution in the unsewered villages of Hong Kong. International Conference on Environmental Pollution, ICEP.3, 1, Budapest, April, European Centre for Pol-lution Research, 334–341.
Tayler, K., Parkinson, J. and Colin, J. (2003) Urban Sanitation: A Guide to Stra-tegic Planning, ITDG Publishing.
Varis, O. and Somlyody, L. (1997) Global urbanisation and urban water: can sus-tainability be afforded? Water Science and Technology, 35(9), 21–32.
Approaches to urban
drainage
2.1 Types of system: piped or natural
Development of an urban area can have a huge impact on drainage, as dis-cussed in Section 1.2 and represented in Figs 1.2 and 1.3. Rain that has run off impermeable surfaces and travelled via a piped drainage system reaches a river far more rapidly than it did when the land and its drainage was in a natural state, and the result can be flooding and increased pollu-tion. Rather than rely on ‘end of pipe solutions’ to these problems, the recent trend has been to try to move to a more natural means of drainage, using the infiltration and storage properties of semi-natural features.
Of course, artificial drainage systems are not universal anyway. Some isolated communities in developed countries, and many other areas throughout the world, have never had main drainage.
So, the first distinction between types of urban drainage system should be between those that are based fundamentally on pipe networks and those that are not.
Much of this chapter, and of this book, is devoted to piped systems, so let us now consider the alternatives to piped systems.
The movement towards making better use of natural drainage mechanisms has been given different names in different countries. In the US and other countries, the techniques tend to be called ‘best management practices’, or BMPs. In Australia the general expression ‘water sensitive urban design’ com-municates a philosophy for water engineering in which water use, reuse and drainage, and their impacts on the natural and urban environments, are con-sidered holistically. In the UK, since the mid-1990s, the label has been SUDS (Sustainable Urban Drainage Systems, or SUstainable Drainage Systems).
18 Approaches to urban drainage
2.2 Types of piped system: combined or separate
Urban drainage systems handle two types of flow: wastewater and stormwater. An important stage in the history of urban drainage was the connection of wastewater to ditches and natural streams whose original function had been to carry stormwater. The relationship between the con-veyance of wastewater and stormwater has remained a complex one; indeed, there are very few systems in which it is simple or ideal.
Piped systems consist of drainscarrying flow from individual properties, and sewers carrying flow from groups of properties or larger areas. The word seweragerefers to the whole infrastructure system: pipes, manholes, structures, pumping stations and so on.
There are basically two types of conventional sewerage system: a com-bined system in which wastewater and stormwater flow together in the same pipe, and a separatesystem in which wastewater and stormwater are kept in separate pipes.
Some towns include hybrid systems, for example a ‘partially-separate’ system, in which wastewater is mixed with some stormwater, while the majority of stormwater is conveyed by a separate pipe. Many other towns have hybrid systems for more accidental reasons: for example, because a new town drained by a separate system includes a small old part drained by a combined system, or because wrong connections resulting from ignorance or malpractice have caused unintended mixing of the two types of flow.
We will now consider the characteristics of the two main types of sewerage system. Other types of drainage will be considered in Chapters 22, 23 and 25.
2.3 Combined system
In the UK, most of the older sewerage systems are combined and this accounts for about 70% by total length. Many other countries have a significant proportion of combined sewers: in France and Germany, for example, the figure is also around 70%, and in Denmark it is 45%.
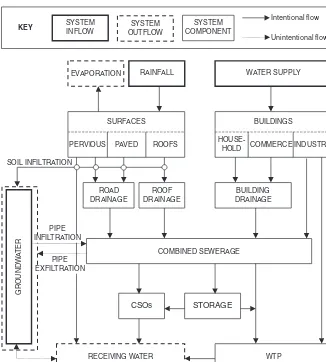
A sewer network is a complex branching system, and Fig. 2.1 presents an extreme simplification of a typical arrangement, showing a very small proportion of the branches. The figure is a plan of a town located beside a natural water system of some sort: a river or estuary, for example. The combined sewers carry both wastewater and stormwater together in the same pipe, and the ultimate destination is the wastewater treatment plant (WTP), located, in this case, a short distance out of the town.
It is simply not economically feasible to provide capacity for this flow along the full length of the sewers – which would, by implication, carry only a tiny proportion of the capacity most of the time. At the treatment plant, it would also be unfeasible to provide this capacity in the treatment processes. The solution is to provide structures in the sewer system which, during medium or heavy rainfall, divert flows above a certain level out of the sewer system and into a natural watercourse. These structures are called combined sewer overflows, or CSOs. A typically-located CSO is included in Fig. 2.1.
The basic function of a CSO is illustrated in Fig. 2.2. It receives inflow, which, during rainfall, consists of stormwater mixed with wastewater. Some flow is retained in the sewer system and continues to the treatment
Town
WTP
Watercourse CSO
Fig. 2.1 Combined system (schematic plan)
Inflow
CSO Flow retained
in the system – ‘the setting’
Spill flow
to WTP
20 Approaches to urban drainage
works – the continuation flow. The amount of this flow is an important characteristic of the CSO, and is referred to as the ‘setting’. The remainder is overflowed to the watercourse – the overflow or ‘spill flow’.
It is useful at this point to consider the approximate proportions of flow involved. Let us assume that the stormwater flow, in heavy rain, is fifty times the average wastewater flow. This is combined with the wastewater flow that would exist regardless of rainfall, collected by the sewer system upstream of the CSO (which doeshave the capacity to carry the combined flow). Let us assume that the capacity of the continuing sewer downstream of the CSO is eight times the average wastewater flow (a typical figure). The inflow is therefore fifty-one times average wastewater flow (51 ⫻av), made up of 50 ⫻avstormwater, plus, typically, 1 ⫻avwastewater. In this case the flow diverted to the river will therefore be 51 ⫺8 ⫽43 ⫻av.
This diverted flow would seem to be a highly dilute mixture of rain-water and wasterain-water (ostensibly in the proportions 50 to 1). Also, CSOs are designed with the intention of retaining as many solids as possible in the sewer system, rather than allowing them to enter the watercourse. Therefore, the impact on the environment of this untreated discharge might appear to be slight. However, storm flows can be highly polluted, especially early in the storm when the increased flows have a ‘flushing’ effect in the sewers. There are also limits on the effectiveness of CSOs in retaining solids. And the figures speak for themselves! Most of the flow in this case is going straight into the watercourse, not onto the treatment works. To put it simply: CSOs cause pollution, and this is a significant drawback of the combined system of sewerage. The design of CSOs is con-sidered further in Chapter 13.
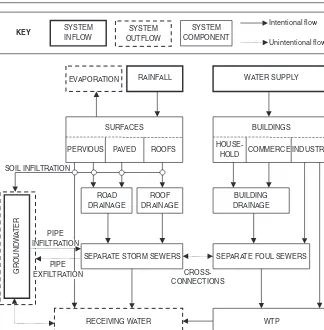
2.4 Separate system
Most sewerage systems constructed in the UK since 1945 are separate (about 30%, by total length). Fig. 2.3 is a sketch plan of the same town as shown in Fig. 2.1, but this time sewered using the separate system. Wastewater and stormwater are carried in separate pipes, usually laid side-by-side. Waste-water flows vary during the day, but the pipes are designed to carry the maximum flow all the way to the wastewater treatment plant. The storm-water is not mixed with wastestorm-water and can be discharged to the storm- water-course at a convenient point. The first obvious advantage of the separate system is that CSOs, and the pollution associated with them, are avoided.
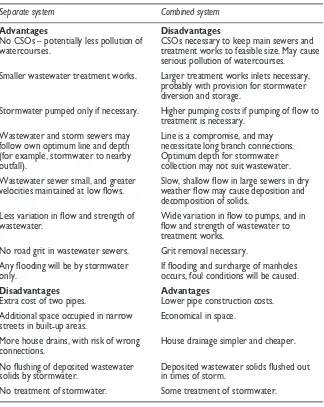
costs are due to a slightly wider excavation and an additional, relatively small pipe.
Separate systems do have drawbacks of their own, and we must con-sider them now. The drawbacks relate to the fact that perfect separation is effectively impossible to achieve. First, it is difficult to ensure that polluted flow is carried only in the wastewater pipe. Stormwater can be polluted for many reasons, including the washing-off of pollutants from the catchment surface. This will be considered in more detail in Chapter 6. Second, it is very hard to ensure that no rainwater finds its way into the wastewater pipe. Rainwater enters the wastewater pipe by two main mechanisms: infiltration and direct inflow.
Infiltration
Infiltration to a pipe takes place when groundwater seeps in via imperfec-tions: for example, cracks or damage from tree-roots or poor joints. It can take place in all types of sewer but is likely to cause the most problems in the wastewater pipe of a separate system because the extra water will have the most impact on the remaining pipe capacity. (Exfiltration, the leaking of liquid out of a sewer, can also be a problem, particularly in areas of sen-sitive groundwater. This will be considered in Chapter 4.)
Inflow
Direct inflow usually results from wrong connections. These may arise out of ignorance or deliberate malpractice. A typical example, which might
Wastewater
Stormwater
WTP
Watercourse
22 Approaches to urban drainage
belong to either category, is the connection of a home-made garden drain into the wastewater manhole at the back of the house. A survey of one separate system (Inman, 1975) found that 40% of all houses had some arrangement whereby stormwater could enter the wastewater sewer. It may at first sight seem absurd that a perfectly good infrastructure system can be put at risk by such mismanagement and human weakness, but it is a very real problem. Since a drainage system does not run under pressure, and is not ‘secure’, it is hard to stop people damaging the way it operates. In the USA, ‘I and I’ (infiltration and inflow) surveys can involve injecting smoke into a manhole of the wastewater system and looking out for smoke rising from the surface or roof drainage of guilty residents!
2.5 Combined and separate systems compared
This obvious question does not have a simple answer. In the UK, new devel-opments are normally given separate sewer systems, even when the new system discharges to an existing combined system. As has been described in Chapter 1, during the 1950s, engineers started to pay particular attention to the pollution caused by CSOs, and this highlighted the potential advantages of eliminating them by using separate systems. It was quite common for con-sulting engineers, when asked to investigate problems with a combined sewer system, to recommend in their report a solution like the rebuilding of a CSO, but to conclude with a sentence like, ‘Of course the long-term aim should be the replacement of the entire combined system by a separate one; however this is not considered economically feasible at present’.
As the philosophy of sewer rehabilitation took hold in the 1980s, this vague ideal for the future was replaced by the more pragmatic approach of ‘make best use of what’s there already’. Many engineers reassessed the auto-matic assumption that the separate system was the better choice. This was partly a result of increasing experience of separate systems and the problems that go with them. One of the main problems – the difficulty of keeping the system separate – tends to get worse with time, as more and more incorrect connections are made. Theoretical studies have shown that only about one in a hundred wrong connections would nullify any pollution advantage of separate sewers over combined ones (Nicholl, 1988). There was also increas-ing awareness that stormwater is not ‘clean’. The application of new tech-niques for improving CSOs, combined with the use of sewer system computer models to fine-tune proposals for rehabilitation works, led to significant reductions in the pollution caused by many existing combined sewer systems. So, by the early 1990s, while few were proposing that all new systems should be combined, the fact that there were a large number of existing combined systems was not, in itself, a major source of concern.