Analysis of Financial Inclusion Toward Poverty and Income
Inequality
Ikrima Zaleda Zia1), P. Eko Prasetyo2)
1,2Development Economics Department, Faculty of Economics, Semarang State University
Corresponding Author: [email protected]
Recieved: March 2018 | Revised: April 2018 | Accepted July 2018
Abstract
The objective of this study is to analyze the relationship and the influence of financial inclusion toward poverty alleviation and income inequality in Indonesia. The analysis methods in this study were Index Inclusion and regression-correlation of panel data. The variable of financial inclusion was obtained from Index of Financial Inclusion (IFI) value measured by dimensions; banking penetration, banking services availability, and the use of banking services. The data was time series from 2014-2016 and cross section from 33 provinces in Indonesia obtained from Bank Indonesia, Financial Service Authority, and Central Bureau Statistics. The results showed; (1) most provinces in Indonesia had moderate financial inclusion level, (2) financial inclusion had a negative and significant relationship and influence toward poverty. (3) financial inclusion had a positive and not significant relationship with income inequality, but it had a negative and significant influence toward income inequality. It means that financial inclusion can reduce poverty, but it has not been able to reduce the economic gap of society well.
Keywords: Financial Inclusion, Poverty and Income Inequality
JEL classification: G20, I38
How to Cite: Zia, I., & Prasetyo, P. (2018). Analysis of Financial Inclusion Toward Poverty and In -come Inequality. Jurnal Ekonomi Pembangunan: Kajian Masalah Ekonomi dan Pembangunan, 19(1), 114-125 doi:https://doi.org/10.23917/jep.v19i1.5879
DOI: https://doi.org/10.23917/jep.v19i1.5879
1. Introduction
The major development problem in Indonesia are the low and inequality economic growth, so it impacts on endless high unemployment, poverty, and income inequality phenomena. One of the financial inclusion goals is to encourage economic growth, poverty reduction acceleration, and discrepancy reduction among individuals and inter-region in Indonesian society welfare (Goverment Regulation number 82, 2016).
The objective of a financial inclusion policy is basically to provide cheap, fair and transparant financial service deepening which is more aimed to the poor in order to utilize a suitable product
and appropriate formal financial services such as keeping money, transfering, saving, or loaning. The target is to increase an access for the poor and Micro, Small, Medium Enterprises (SMEs) to formal financial services in inclusive and equitable economic development.
fulfilled by formal financial services, i.e the poor, SMEs, and cross-group society.
The other benefit expeted from financial inclusion are to increase economic efficiency, to support financial system stability, to support deepening of money market, to provide potential new market for banking, to support Human Development Index (HDI) of Indonesia and contribute positively toward sustainable local and national economic growth, and to reduce income distribution discrepancy and rigidity, so it can increase welfare of society.
The national vision of financial inclusion is to realize financial system that can be accessed by all society levels to promote economic growth, poverty alleviation, income distribution and the realization of financial system stability in Indonesia. One of the goals of financial inclusion is to make it as a part of grand strategy of economic development, poverty alleviation, income distribution, and financial system stability.
According to (Bank Indonesia, 2014), financial inclusion is regarded as everyone’s right to be able to get full access and service from financial institutions on time, comfortable, informative, and affordable manner, with full respect for their dignity and prestige. The goal of financial inclusion is to reduce the number of unbanked people in Indonesia.
The financial inclusion program is a financial system concept that not only emerges as a program that promotes the achievement of economic growth (pro-growth), but also pro-jobs and usefull for the poor (pro-poor) (Sanjaya & Nursechafia, 2015)penelitian ini menghitung Index of Financial Inclusion (IFI. The financial inclusion program not only provides short-term service for society to reduce poverty or to improve access ratio toward banking, but also reaches sustainable economy which they can manage their financial independently and increase their income (Gabriella & Goeltom, 2013).
One basic theory used for describing poverty in developing country such as Indonesia is vicious
circle of poverty theory (Nurske in Suryana, 2000). The theory states that there are two obstacles which impede the development countries to rapid development level in order to come out of poverty circle, which is a condition that causes barriers toward the high capital formation. The rate of capital formation is determined by a stimulus to ask for capital, on the other hand it is determined by the supply of capital in the form of saving. The greater number of poor in a country, it will create income inequality among the society.
The relationship of income inequality and banking limited access is based on Harrod Dommar’s inequality theory (Purba, 2016) which explained that the capital concentration centered in a region will create economic growth that only happened in the region and will cause an inequality commpared with other regions. Futhermore, it will be used as a reference in this article.
Since it was established in 2010, the level of financial inclusion in Indonesia tended to increase. Based on the data from world bank, it was known that the financial inclusion of Indonesia in 2011 was 19,58% and then in 2014 it increased to 36,1%. While according to National Survey on Financial Literacy and inclusion (SNLIK) conducted by Financial Service Authority in 2013, the financial inclusion of Indonesia was 59,74%. Then, it increased to 67,82% in 2016.
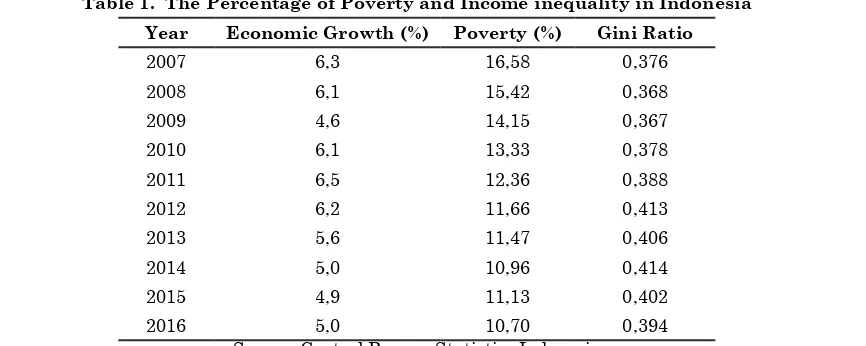
Table 1. The Percentage of Poverty and Income inequality in Indonesia Year Economic Growth (%) Poverty (%) Gini Ratio
2007 6,3 16,58 0,376
2008 6,1 15,42 0,368
2009 4,6 14,15 0,367
2010 6,1 13,33 0,378
2011 6,5 12,36 0,388
2012 6,2 11,66 0,413
2013 5,6 11,47 0,406
2014 5,0 10,96 0,414
2015 4,9 11,13 0,402
2016 5,0 10,70 0,394
Source: Central Bureau Statistics Indonesia
The data from 2007 to 2010 shows a period before the launch of financial inclusion program as national development strategy in Indonesia. While the data from 2011 to 2016 shows a period after the launch of financial inclusion program as national development strategy in Indonesia. Based on the table-1, it can be known that the poverty and income inequality in Indonesia are still high, and the income inequality tends to be higher than before.
The urgency of the principle issue in this article is that financial inclusion is a an important component in the process of social and economic inclusions that fosters economic growth, creates the stability of financial system, supports poverty reduction program, and reduces the gap among individuals and inter-regions, (Goverment Regulation number 82, 2016). Thus, this research conducted: How is the relationship and influence among financial inclusion, poverty alleviation, and the reduction of income inequality distribution.
The vision and mission of financial inclusion still need to be further studied and examined its success academically in order that financial inclusion as one of national development strategy to encourage economic growth through poverty alleviation, income distribution and financial system stability, can be known and controlled its level of success, so the government’s program is useful and targeted.
The purpose of this research is to analyze the relationship and influence among financial inclusion, poverty alleviation, and the reduction of income inequality distribution. In other words, to study the capabilities of financial inclusion program in helping poverty reduction and income inequality distribution in Indonesia.
2. Research Method
Based on the puprose above, this research was designed using Correlation Research type which is expose-facto. The objective is to know the fact of the relationship among financial inclusion, poverty, and income inequality, moreover to detect the influence of variations in a factor and other variations in other factors. This research is designed to know the relationship and influence among financial inclusion, poverty, and inequality without ensuring the existance of causility, but it still could ensured the corelation.
Figure 1. The Index Calculation Illustration of Financial inclusion
Source: Sarma (2012)
2.1. Data Analysis Method
2.1.1. Index of Financial inclusion (IFI) The index inclusion value in this research used Index of Financial inclusion (IFI) model by Sarma (2012) as in figure-1, then it is developed by the researchers. The index value is based on three dimensions: banking penetration dimension, banking service availability dimension, the use of banking service dimension. In Sarma, the indicator uses for describing banking penetration dimension is the number of deposit account in commercial banks per 10 thousand of adult people. This research uses total saving accounts in commercial bank per adult person above 15 years old in every province.
The indicator for banking service availability dimesion is the number of the branch of commercial banks divided by adult people in every province in Indonesia. While, the indicator for describing the use of banking service dimension is the total of Third Party Funds and the total credit to the Gross Domestic Regional Product.
The financial inclusion index can be calculated if each dimension has been calculated its value. The index form each dimension, di, can be calculated using the following equation:
di = wi (1)
wi : quality for i dimension, 0 ≤ wi ≤ 1 Ai : the current value of i variable
mi :minumum value (lower limit) of i variable Mi : maximum value (upper limit) of i variable
To calculate the value of each dimension, we needs to assigning appropriate weight for each dimension. The weighting in each dimension shows the relative importance of the dimension in quantifying the inclusiveness of financial system (Sarma, 2012). In this research, the weight is done by considering how great the dimensions can affect financial inclusion and considering the ease in obtaining the data. If the affect is greater and easy in obtaining the data, it is given hight weight. We considering the lack of adequate data on important indicators that really characterize the penetration and availability dimensions renders us to give relatively less weight to these dimensions in the present index. We assign a weight 0,3 for banking penetration dimension; 0,1 for banking service availability dimension; and 1 for the use of banking service. While in Sarma, the weight on each dimension is 1 for penetration, 0,5 for availability, 0,5 for using.
In addition to give a weight on each dimension of financial inclusion index, Sarma suggested it is also necessary to determine the lower and upper limits for each dimension. The lower either upper limits will be the fixed value in calculating financial inclusion index. The lower limit or minimum value (𝑚𝑖) of each dimension in this research is 0. While the upper limit or maximum value (𝑀𝑖) of each dimension is the highest value rounding of each indicator used in each dimension.
The calculation of IFI can be done with the following formula from Sarma (2012):
X1 = (2)
dan
Thus, the value of IFI is the average of both,
IFI = [X1 + X2] (4)
2.1.2. Correlation Test
Correlation test is used to know the relationship between financial inclusion and poverty and the relationship between financial inclusion and income inequality. The absolute value from the correlation coefficient is from zero to one. The closer one, the stronger of relationship between those variables.
2.1.3. Panel Data Regression Analysis To know the influence of financial inclusion to the other variables, we use panel data regression analysis. Panel data is a combination between time series data and cross section data, which the same cross section unit is measured in different time. Panel data analysis is also used to observe the relationship and influence between the dependent variable (financial inclusion) and one or more independent variables (poverty and income inequality). Generally, there are three techinques that can be used to estimate data panel regression model, they are Common Effect Model (CEM), Fix Effect Model (FEM), and Random Effect Model (REM).
To determine the best panel data method, it is necessary to do several test such as Chow Test to compare CEM and FEM, Hausman Test to compare FEM and REM, and Multiplier Lagrange Test to compare CEM and REM. The equations used in this research were:
Poverty it = β0 + β1 IFIit + µit Inequality it = β0 + β1 IFIit + it
In which:
Povertyi t : Poverty level for i province of t year (percent)
Inequalityit : Equality level for i province of t year (percent)
IFIit : Financial Incusion Index for i province of t year to t (Index) β0 & β1 : regression parameter
µit & it : error component in t time for i cross section unit
i : cross section data of 33 provinces in Indonesia
t : time series data in 2014 – 2016.
Furthermore, based on model estimation test using 5% significant level, this research chose random effect model to estimate the influence of financial inclusion on poverty and fixed effect model to estimate the influence of financial inclu -sion toward income inequality.
3. Results and Discussion 3.1. Results
3.1.1. The analysis of financial inclusion in Indonesia
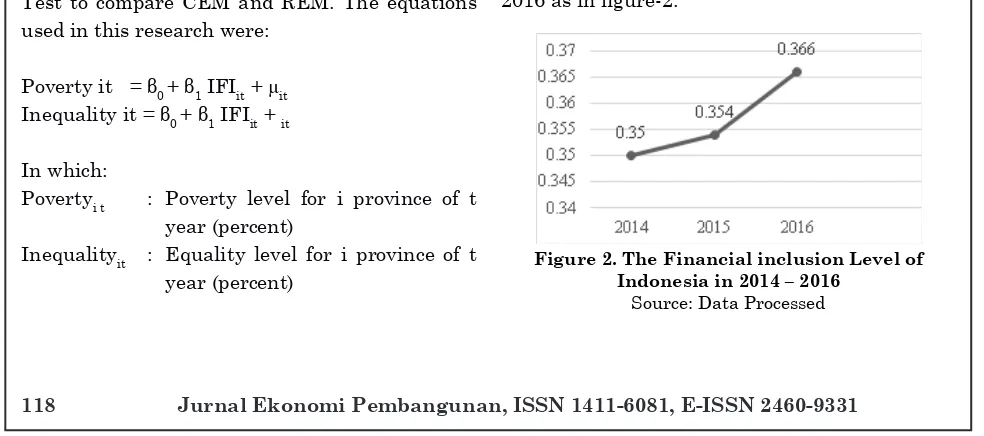
This article used Index Financial inclusion (IFI) to measure the financial inclusion in Indonesia. The IFI and each dimension value of IFI in this research are categorized into 3 categories: low (n ≤ 0,3), moderate (0,3 < n ≤ 0,7 ), and high (0,7 < n ≤ 1). The research result showed that based on average the financial inclusion of Indonesia in 2014 until 2016 was moderate category i.e 0,357. The financial inclusion tended to increase slighlty every year. The financial inclusion in Indonesia was 0,350 in 2014. It increased to be 0,354 in 2015, and then it increased again to be 0,366 in 2016 as in figure-2.
Figure 2. The Financial inclusion Level of Indonesia in 2014 – 2016
Table 2. The Index Dimension Value of Financial Inclusion of Indonesia 2014 – 2016
Years The Index Dimension of Financial inclusion
Banking Penetration Banking Availability The Use of Banking Service
2014 0,078 0,034 0,231
2015 0,077 0,035 0,236
2016 0,092 0,036 0,240
Average 0,082 0,035 0,236
Source: Data Processed
The improvement of financial inclusion of Indonesia in figure-2 indicated that the access and the use of banking service in Indonesia have increased in line with the develompent of banking sector function in Indonesia. The low improvement value of index financial inclusion indicated that the task and function of banking sector and financial services in Indonesia have not been maximally helped the economy in Indonesia, especial in rural and lower society level.
If we look at the acquisition of values in each dimension, as in table-2, it could be known that in 2014 until 2016, the acquisition of inclusion index value from three dimensions was still in low category, even on banking penetration dimension and banking availability was still very low because the value was close to zero. This research result was a proof that there was less development in banking products and banking services that could be utilized by low society economic class including SMEs.
In 2014 until 2016, the use of banking services dimension had highest value and could be state as the highest in determining financial inclusion level in Indonesia. The second higest dimension was banking penetration. While, the lowest dimension was banking availability. It meant that many people have utilized banking services and financial services, but the development of banking products, financial services and market availability were still limited. Therefore, the index value of market penetration and product availability were still low. In other words, the use of financial services was only utilized by certain society who were able to access it.
3.1.2. The relationship and influence between financial inclusion and poverty
Based on the result, it was known that financial inclusion had a negative relationship and significant and had a negative influence and significant with poverty in Indonesia with coefficient corelation 0,325 and regression corelation 10,493. It meant that the more poor accessed financial inclusion, it would have an impact on the lower poverty level. Therefore, the government policy with financial inclusion program as an effort to reduce poverty could be state quite successful and acceptable. It meant that it supported the government policy program.
3.1.3. The relationship between financial inclusion and income inequality
Based on the result, it was known that financial inclusion had positif correlation and not significant with income inequality in Indonesia. It could be seen form the coefficient 1,071. It means that the higher of financial inclusion, the higher of national income inequality. It do not need to be feared. Altough it is less good, it is not significant.
ceteris paribus assumption. It shows good thing and can support government’s financial inclusion program which assumes that financial inclusion program is a solution to improve welfare and de -crease income inequality.
3.2 Discussion
The result showed that the value of index financial inclusion in every province of Indonesia in 2014 until 2016 could be said in moderate Kalimantan Timur. It meant that public access to Financial Service Product in Indonesia was still low and uneven.
In 2014 until 2016, The average of IFI in Indonesia was 0,357. Therefore, 23 provinces had financial inclusion under the average. It showed that the public access on the financial services products was still uneven because there were only 10 provinces which have IFI value upper the average. Those ten provinces from the highest were: DKI Jakarta (0,871), Kalimantan Timur (0,764), Bali (0,453), DIY (0,421), Sumatera Utara (0,397), Maluku (0,379), Kalimantan Selatan (0,370), Kalimantan Barat (0,365), Sulaesi Selatan (0,361), and Sulawesi Utara (0,361). The rest of 23 provinces has IFI value under the average (0,357).
Based on the result there were two provinces which had IFI value under 0,250 i.e Sulawesi Barat (0,235) and Riau (0,224). The financial inclusion level in Sulawesi Barat in 2014 and 2015 was the same (0,231). In 2016, the financial inclusion level in Sulawesi Barat increased slighly to 0,244, so the average was only 0,235. It was explained that one thing made Sulawesi Barat got the lowest financial inclusion was the low of banking services availability shown by the number of bankings in Sulawesi Barat was still
less and not comparable with the adult people, so the access on banking services products were also low. In 2014-2016, Sulawesi Barat had only 16 unit of banking office which were ready to serve the society needs.
It causes the amount of Third Party Funds collected in Sulawesi Barat was lower than other provinces. Therfore, it supported a research conducted by Rodliyya (2008). According to Rodliyya (2008) there is a significant influence between the number of banking service offices and the third party funds. Moreover, the total credit collected by society was the lowest than other provinces. However, in 2014 Sulawesi Barat had 56% banking accounts from the total adult people, 60% in 2015, and 66% in 2016. The low number of banking services obviously caused limited access for the society in Sulawesi Barat in utilizing financial services.
The province with the highest financial inclusion was DKI Jakarta. The financial inclusion of DKI Jakarta in 2014 was 0,850. In 2015, it increased to 0,856 and it increased again to 0,906 in 2016, so the average of IFI in DKI Jakarta during the period 2014-2016 was 0,871. DKI Jakarta was the province which had the highest value in every dimension of financial inclusion than 33 other provinces. It was very reasonable since beside being the capital city of the country, it was also as the center of government which the three dimensions also the largest in DKI Jakarta. However, the problem was the value showed high inequality with other provinces because it was upper the average of IFI Indonesia compared with the lowest IFI in Sulawesi Barat with a difference 0,636.
has the highest financial literacy and financial inclusion in Indonesia.
Furthermore, the number of physical infrastructure of banking branch offices in DKI Jakarta is the most than other provinces. It means that people in DKI Jakarta can get the greater access than other provinces in getting banking services. The high level of financial literacy in DKI Jakarta is evidenced by the existing utilization of financial products, such as saving and credit. In 2014 until 2016, deposits in the form of Third Party Funds of banks and credit in DKI Jakarta tend to increase significantly. In Q4/2014 Third Party Funds deposits in banks grew 12,23% (yoy) and baking credit was 9,39% (yoy). In Q4/2015, there was a growth of Third Party Funds 9,4% (yoy) and 9,35% (yoy) credit level. In Q3/2016, Third Party Funds in banks grew 2,25% (yoy) and banking credit was 3,90% (yoy).
financial inclusion had a negative relationship and significant and had a negative influence and significant with poverty in Indonesia. It meant that the more poor accessed financial inclusion, it would have an impact on the lower poverty level. Therefore, the government policy with financial inclusion program as an effort to reduce poverty could be state quite successful and acceptable. It meant that it supported the government policy program.
The result was also correspond with a research by (Park & Mercado, 2015) which stated that there is a strong correlation and significant between financial inclusion and poverty. The result also supported a research by (Rakhmindyarto & Syaifullah, 2012) which stated that financial inclusion is able to exclude society from poverty through of financial inclusion such as deposit, credit, insurance, pension funds, and payment facility that will help marginal and low-income society to increase their income, accumulate wealth, manage risks, and make efforts to come out of poverty.
The result comfimed that the impact of financial inclusion is useful for low society to be easily connects with economic opportunity
access, and it is easier in doing transaction, so the participation of the poor in economic activities increases. Furthermore, the increasing of economic activities, it can increase income and reduce poverty. In addition, the society become more motivated to save and the financial expenditure is more controlled.
They can also easily manage their financial well, feel more secure in saving money, and increase household financial liquidity. They are also more confident because they can get financial services well and efficient. Furthermore, by saving they can improve their welfare and socio-cultural status. It means it can reduce poverty.
The result was in line with the theory stated by Nurske which was explained that one of the reasons a country caught in poverty is the low of capital formation. The capital formation is determined by incentive to demand capital and also by the supply of capital in saving rate. Based on the theory, it means that with the financial inclusion, the poverty can be cut through increasing the savings. With the increase of saving, the investment and capital formation will increase. Furhermore, it will increase productivity and people’s income to come out of poverty.
inclusive growth phenomenon its need and financial inclusion as an instrument to attain it with reference to its extent in Indian States. The research has been done using secondary data source. Analysis of natural hierarchical grouping cluster is done considering parameters like GDP per capita, literacy rate, unemployment rate and index of financial inclusion (Johnson R.A. & Wichern D.W., 2000. It was about the impact of financial inclusion on poverty. The supply of financial service access provides a potential to come out of the low society from poverty through saving culture and a thrift in efficient payment mechanism.
The result also supported a result by (Sanjaya, 2014). By using panel data regression method, it can explain the relationship between financial inclusion and poverty in Indonesia. The research explained that micro credit can improve people’s either social status or economic status. Therefore, it can be stated that financial inclusion could support the government program in poverty alleviation in Indonesia.
Besides aiming to reduce poverty, financial inclusion also aims to reduce income inequality in Indonesia. Basically the factors of inequality are very complex and varied. One of the factor is the low of society access on financial institutions. The low of society access toward financial services and product probably happens because the low of literacy level and financial inclusion of the society on financial institution. Therefore, financial inclusion program done by government is regarded as one of the solutions to overcome income inequality distribution.
BI and the government has targeted that financial inclusion ratio can increase 75% in 2019 based on Inclusive Finance National Strategy. It seems the target will fail because nowdays (2017) based on the result, the financial inclusion in 2016 was only 36,60% and the average of financial inclusion during the period 2014-2016 was only 35,70%. It means that nowdays the society who have accounts (access on banking formal financial) arround 36% only. It means that the low of formal
financial access can cause ineficiency in payment transaction and increase the level of economic inequality.
If the literacy and financial inclusion are still low, the economic growth in Indonesia will not be high qualified. This condition supports a statement in the introduction. If the result of financial inclusion, which was only 36,60%, is linked to the result of Financial Service Authority (2013), it states that the financial literacy level in Indonesia is only 21,8%. It indicates that the use of financial services by society still has high risk. Because of the literacy level (understanding on financial services was low), it will have bad impact to financial inclusion used by society.
Based on the result, it was known that financial inclusion had positif correlation and not significant with income inequality in Indonesia. It could be seen form the coefficient 1,071. It means that the higher of financial inclusion, the higher of national income inequality. It do not need to be feared. Altough it is less good, it is not significant. It supported an evidance of inequaility on financial literacy and inclusion problems clearly and supported Simon Kuznet’s economic theory and the phenomenon of Kuznets’ curve “U reversed” besause there is time series change in income distribution which states that in the early stage of the relationship of economic growth and income distribution tend to be worsen, however in the next stage, the income distribution will increase.
inclusion and income inequality.
(Greenwood & Jovanovic, 1990) explained the relationship between financial development sector and income distribution. At the first development, the economy grew slowly. In line with rising income, the financial sector developed, so the financial structure was wider, the economy grew faster, and income inequality was higher. Based on the theory, nowdays (2010-2017) the financial development sector in Indonesia can be assumed in early stage of stage. It means that banking sector and financial are getting to grow slowly and only can be accessed by few individuals. Therefore, atlhough the economic growth is high, it remains unqualified and increased inequality. In the next stage, the literacy and financial inclusion is getting better and has better quality. Therefore, the income inequality between upper and lower society and inter-region inequality decreases.
According to Bank Indonesia (2014), there were several barriers in banking access for low society, i.e price barrier, information barrier, design product barrier, and channel barrier. They caused bankings were difficult to be accessed by low society. Nowdays, the banks less give education to society (because it increased the cost of bank). It impacts on low literacy in society toward banking services and product. Therefore, financial products and services only can be accessed by few upper society. For the case in Indonesia, the high access and the use of banking service have not been completed with expansion facility for the low society with good education level. Therefore, in the early stage, the higher of financial inclusion is caused by the higher access and the use of banking service by upper society and it has not been comprehansive, so the inequality is still high.
Based on the result, financial inclusion had a negatif influence and significant toward income inequality in Indonesia with negative coefficient value was 0,493 and significant was 0,05. If the financial inclusion in indonesia increases 1%, the income inequality will decrease 0,493% using
ceteris paribus assumption. It shows good thing and can support government’s financial inclusion program which assumes that financial inclusion program is a solution to improve welfare and decrease income inequality.
Inequality problem in Indonesia is very complicated. Inequality happens not only in economic side, but also in non-economic side. Since the crisis until now, inequality tended to increase, especially, among economic groups and among cities and rural areas, even among individuals. The existence of negative and significant between financial inclusion and income inequality is expected to provide the best solution for future in decreasing inequality.
Financial literacy level and financial inclusion in cities are certainly better and higher than in rural areas. However, inequality in cities is high. It is a proof that strengthened the arguments of research result which there was a positive relationship between financial inclusion and income inequality although the income inequality had negative influence and significant on its inequality. it means that financial inclusion program can be used to decrease inequality but it has not been able to be state success when this research conducted. In other words, financial inclusion program can encourage economic growth in various sectors especially in service and manufacturing industires. However, economic growth is not qualified and only supported by few individual or groups, so it has not succeeded in reducing discrepancy. Altough there is a downward trend, it is still high.
The result supported a theory from Harrod-Dommar in (Purba, 2016) which stated that: capital concentration centered in a region will create economic growth in the region and causes inequality if it is compared with other regions. Therefore, through financial inclusion program which addressed to low society and MSMEs, the development distribution can be created. Therefore, income inequality can reduce.
society especially low society to get financial service access and can utilize financial services offered as a capital source and financing to improve business activities and come out of poverty and finally minimize income inequality. It strengthens the implementation of government policy and it was in line with a research conducted by García-herrero & Turégano (2015) which stated that financial inclusion has contributed to the decrease of income inequality.
4. Conclusions
The financial inclusion level in every province in Indonesia during the period 2014-2016 has moderate category. From 33 provinces in Indonesia, there are only 10 provinces which have financial inclusion under the average of financial inclusion of Indonesia. Financial inclusion has a correlation relationship, negative influence and significant on poverty. On the other hand, financial inclusion has positive and not significant relationship, but has negative and significan influence on inequality. It can be concluded that financial inclusion program has been able to be a solution in reducing poverty but it cannot be able to decrease inequality. Thus, distribution and improvement of literacy and financial incluse should always be continue intensitively.
5. Acknowledgement
We thank to Prof. Dr. Sucihatiningsih DWP, M.Si and Andryan Setyadharma, S.E., M.Si., Ph.D for for comments that greatly improved the manuscript.
6. References
Bank Indonesia. (2014). Booklet Keuangan Inklusif.
Dixit, R., & Ghosh, M. (2014). Financial Inclusion for Inclusive Growth of India -a Study of Indian States. International Journal of Business Management and Research, 3(1), 147–156.
Gabriella, L. G., & Goeltom, M. S. (2013). Pengaruh Pembangunan Keuangan Perbankan Dan
Akses Keuangan Perbankan Terhadap Kemiskinan Di Indonesia.
García-herrero, A., & Turégano, D. M. (2015). Financial inclusion, rather than size, is the key to tackling income inequality. BBVA Research, (February), 1–24. https://doi. org/10.1142/S0217590818410047
Greenwood, J., & Jovanovic, B. (1990). Financial Development, Growth, and the Distribution of Income. Journal of Political Economy, 98(5, Part 1), 1076–1107. https://doi. org/10.1086/261720
Otoritas Jasa Keuangan. (2016). Survei Nasional Literasi dan Inklusi Keuangan 2016. Survey Report, 1–26.
Park, C.-Y., & Mercado, R. V. (2015). FInancial InclusIon , Poverty and Income Inequality In DevelopIng Asia. ADB Economics Working Paper Series, (426), 17.
Purba, M. F. (2016). Kemiskinan Dan Ketimpangan Pendapatan Jawa Tengah 2010-2014.
Rakhmindyarto, & Syaifullah. (2012). Keuangan Inklusif dan Pengentasan Kemiskinan.
Peraturan Presiden Republik Indonesia Nomor 82 [Goverment Regulation number 82]Tahun 2016 Tentang Strategi Nasional Keuangan Inklusif, (82), 1–33. https://doi.org/10.1017/ CBO9781107415324.004
Rodliyya, Z. R. (2008). Pengaruh jumlah kantor layanan syariah terhadap penghimpunan dana pihak ketiga pada bni syariah.
Sanjaya. (2014). Inklusi keuangan dan pertumbuhan inklusif sebagai strategi pengentasan kemiskinan di indonesia i made sanjaya.
Sarma, M. (2012). Index of financial inclusion – A measure of financial sector inclusiveness. Berlin Working Papers on Money, Finance and Trade Development, (7), 1–34.