ANALYSIS OF FINANCIAL RATIOS AND MACROECONOMIC FACTORS TO
STOCK RETURN AND SWOT STRATEGY
(CASE STUDY: FINANCE SECTOR COMPANIES LISTED IN INDONESIA STOCK
EXCHANGE YEAR 2010-2014)
Fathia Rahma Kamila1, Endang Chumaidiyah2, Rita Zulbetti3
1,2,3
Industrial Engineering Study Program, Faculty of Industrial and System Engineering, Telkom University
1
[email protected],
2[email protected],
3[email protected]
Abstract
This study was conducted to examine the influence of Earning Per Share (EPS), Debt To Equity Ration (DER), Return On Asset (ROA), inflation, BI Rate, and Exchange Rate partially and simultaneously to the finance sector’s stock returns. Besides, this study aims to analyze the strategy for finance sector to improve the performnace and the stock return. The sample used were 36 companies from 59 finance companies listed in Indonesia Stock Exchange during periode 2010-2011 so that the data processed is 180 samples. The analytical tool is data panel regression analysis with the classical assumption tests and the model test. The result of this study showed that only ROA, inflation, and BI Rate partially has significant influence on stock return while simultaneously EPS, DER, ROA, inflation, BI Rate, and Exchange Rate has significant influence on the stock return. Then, based on the analysis of stock return in 2010-2014, Bank QNB Indonesia can represent the finance sector to indetified the current performance and analyzed the strategy. The strategy formulation was conducted by describing the strengths, wekanesses, opportunities, and threats. Then it could be determined the competitive posistion and formulate the strategy. This study used SWOT analysis, AHP, and SWOT Diagram.
Keywords: Earning Per Share, Debt To Equity Ratio, Return OnAsset, Inflation, BI Rate, Exchange Rate, Strategy, AHP Method, SWOT
1. Introduction
1.1. Background
In carrying out operational activities and develop the company, the funds required in large quantities. Being a public company is one way for companies to obtain funding needs. By doing go public, the company has additional funds to grow the business. However, the company must ensure that conditions remain good and stock prices can rise.
In the Indonesia Stock Exchange, go public companies are grouped into several sectors, namely, among others, agriculture, mining, basic industry and chemical industry, the various sectors of industry, consumer goods industry sector, real estate, infrastructure, utilities, and transportation , financel sector, and the trade, services and investments.
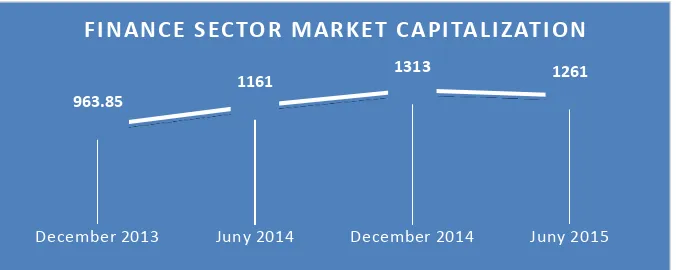
F I N A N C E S E C TO R M A R K E T C A P I TA L I Z AT I O N
963.85
1161 1313 1261
December 2013 Juny 2014 December 2014 Juny 2015
Figure 1 Finance Sector Market Capitalization
At the end of 2015 the company's stock market capitalization shrink the financial sector amounted to Rp 70 trillion. This phenomenon can affect the interest of investors to invest in stocks and the financial sector may affect the JCI movement. It is necessary for the analysis to determine the factors that affect stock price movements of the financial sector.
The ratio of financial and economic conditions in the country are factors that may affect the interests of investors to invest. By doing comparison to previous research, the chosen EPS, DER, ROA, Inflation, BI Rate, and Exchange Rate as factors that potentially affect stock returns.This research is conducted to calculate the influence of EPS, DER, ROA, Inflation, BI Rate, and Exchange Rate simultaneously and partially on stock return. Then, the analysis was done to determine appropriate strategy for finance sector companies.
1.2. Research Metodology
1.2.1 Analysis of Influence Factor on Stock Return
Object of this research is financial sector companies listed on the Indonesia Stock Exchange during the period 2010-2014. The data used is the panel data for all variables: EPS, DER, ROA, inflation, BI Rate, Exchange Rate, and stock return in finance sector listed on the Indonesian Stock Exchange.
The data and financial ratios derived from the share price performance of listed companies report on the official website of IDX. While the data of inflation, B Rate and Exchange Rate obtained from the Economic and Monetary Statistics Bank Indoneisa. Stock price data is then processed to obtain stock returns.
This study used multiple regression analysis of panel data to get a picture of the effect of variable EPS, DER, ROA, inflation, BI Rate and Exchange Rate to stock return using software Eviews 9.
Here is a multiple linear regression model can be written as follows permsamaannya
� = ��+ ����+ ����+ ����+ ����+ ����+ ����+ �
1.2.2 Analysis of Finance Sector Strategy
Method of factor analysis of strengths, weaknesses, opportunities, and threats using External Factor Analysis (EFAS) and Internal Factor Analysis (IFAS). Weighting in EFFAS and IFAS matrix obtained by expert judgment and calculated by the method of AHP. The calculation result EFAS and IFAS determine the company's position in IE matrix and an appropriate strategy for the company.
2. Literature review
2.1. Capital Market
In the business world, capital markets have an important role especially in the allocation of public funds. Sources of funds for financing-financing of the company's operations are limited, it is necessary to find a solution that is long-term financing. The capital market has emerged as an alternative to long-term financing solution. The capital market is a meeting place between those who have surplus funds to those who need funds from reducing securities (Tandelilin, 2010: 26).
2.2. Stock Return
Stock return is the result or the benefits of shareholders as a result of the investment. Mathematically actual return can be formulated as follows:
Return =Pt − Pt−1
Note:
Pt = stock price in period t
Pt-1 = stock price in period t-1
This study used several factors that affect stock return rate is as follows: 2.3. Return On Asset (ROA)
ROA is the ratio used to measure a company's ability to generate profits derived from investment activities. The higher ROA ratio, the better asset productovoty in gaining profit. Thus, will increase the company's attractiveness to investors. ROA value can be measured by the formula:
Net Income Afer Tax ROA =
Total Asset
2.4. Debt To Equity Ratio (DER)
Debt To Equity Ratio is a measure used in analyzing financial statements to show the amount of collateral available to creditors. The higher DER shows the greater the amount of capital loans used in generating corporate profits. The Debt To Equity Ratio formula is:
Total Liabilities DER =
Total Shareholders Equity
2.5. Earning Per Share (EPS)
Per Share (EPS) is the ratio that measures the company's net income in the period divided by the number of shares outstanding. EPS calculation is formulated as follows:
Net Profit EPS =
Shares x 100%
2.6. Inflation
Inflation is a condition of rise in prices, or it can be said as a decline in purchasing power of money. The higher the price increases further down the value of money. In the theory, the higher inflation rate will affect to the lower stock return.
2.7. BI Rate
BI Rate is one of the important factors to consider investment decisions. According to Bank Indonesia, BI Rate is the cost burden expressed by a certain percentage in order to guarantee money for a certain period. In the theory, the higher BI Rate will affect to the lower the return.
2.8. Exchange Rate
Exchange Rate is the currency of a country that is assessed by another country's currency. This study used the US Dollar.
2.9. SWOT Analysis
3. Main Results
3.1. Descriptive Analysis
Here is a table of statistical description of the variables observation: Table 1 Descriptive Statistics
Descriptive Statistics
N Minimum Maximum Mean Std. Deviation
eps 180 -125.00 2223.78 177.72 337.381
der 180 0.11 85.00 5.87 7.275
roa 180 -44.80 19.32 1.95 5.655
inflation 180 3.79 8.38 6.36 1.970
bi_rate 180 5.77 7.54 6.57 0.566
exchange_rate 180 8779.49 11878.30 9914.82 1135.154
return 180 -0.63 1.24 0.12 0.344
Valid N (listwise) 180
From the above table can be seen the maximum, minimum, average and standard deviation or spread of variable size.
3.2. Verification Analysis
3.2.1 Classic Assumption Test
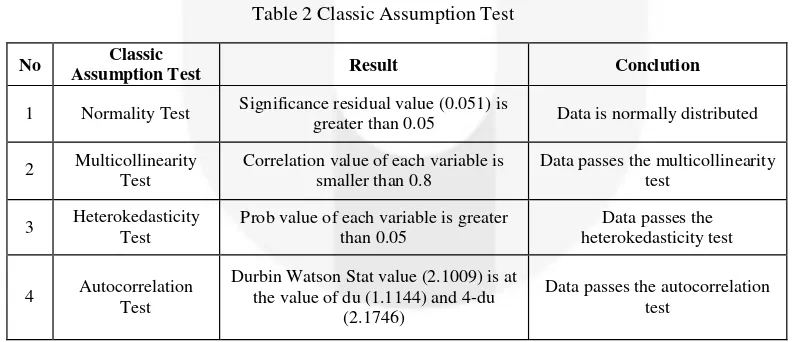
Classic assumption test conducted as a condition of multiple linear regression analysis. Below is a table of test results of classical assumptions:
Table 2 Classic Assumption Test
No Classic
Assumption Test Result Conclution
1 Normality Test Significance residual value (0.051) is
greater than 0.05 Data is normally distributed
2 Multicollinearity Test
Correlation value of each variable is smaller than 0.8
Data passes the multicollinearity test
3 Heterokedasticity Test
Prob value of each variable is greater than 0.05
Data passes the heterokedasticity test
4 Autocorrelation Test
Durbin Watson Stat value (2.1009) is at the value of du (1.1144) and 4-du
(2.1746)
Data passes the autocorrelation test
3.2.2 Regression Test Model
On the test of Hausman test regression model is used to select whether the fixed effect model or random effect models are most appropriate. Beriku is Hausman test results table:
Table 3 Hausman Test
Result Conclution
Hausman Test Prob value (1.000) is greater than 0.05
The method of analysis Random Effect Model (REM) is better than Fixed Effect Model (FEM).
From the table above it can be concluded that the regression model used in this study is the Random Effect Model (REM)
3.2.3 Coefficient Determination
Table 4 R Squared
Weighted Statistics
R-squared 0.103948 Mean dependent var 0.118015 Adjusted R-squared 0.072871 S.D. dependent var 0.343802 S.E. of regression 0.331039 Sum squared resid 18.95851 F-statistic 3.344861 Durbin-Watson stat 2.309993 Prob(F-statistic) 0.003832
Results of determination coefficient of 0.103948 or 10:39%, which means that the variable return stock (Y) is affected by the variable EPS, DER, ROA, inflation, BI Rate, and Exchange Rate of 10.39% while 89.61% are influenced by other factors.
3.2.4 F Test
Table 5 F Test
Weighted Statistics
R-squared 0.103948 Mean dependent var 0.118015 Adjusted R-squared 0.072871 S.D. dependent var 0.343802 S.E. of regression 0.331039 Sum squared resid 18.95851 F-statistic 3.344861 Durbin-Watson stat 2.309993 Prob(F-statistic) 0.003832
Based on the above table can be seen that the probability of F-statistic is less than 5% so that it can be concluded that the independent variables EPS, DER, ROA, inflation, BI Rate, and Exchange Rate simultaneously has significant influence on stock return in financial sector companies listed in Indonesian Stock Exchange.
3.2.5 T Test
Table 6 T Test
Variable Coefficient Std. Error t-Statistic Prob.
EPS 7.78E-05 7.84E-05 0.991827 0.3227
DER -0.000333 0.003539 -0.094011 0.9252
ROA 0.010506 0.004681 2.244139 0.0261
INFLASI 0.054287 0.020340 2.669027 0.0083
BI_RATE 0.116624 0.066632 1.750265 0.0818
EXCHANGE_RATE -0.000108 4.13E-05 -2.612747 0.0098
C 0.043310 0.338055 0.128114 0.8982
3.2.6 Regression Test
Here is a table of the data processing of multiple linear regression: Table 7 Regression Test
Variable Coefficient Std. Error t-Statistic Prob.
EPS 7.78E-05 7.84E-05 0.991827 0.3227
DER -0.000333 0.003539 -0.094011 0.9252
ROA 0.010506 0.004681 2.244139 0.0261
INFLASI 0.054287 0.020340 2.669027 0.0083
BI_RATE 0.116624 0.066632 1.750265 0.0818
EXCHANGE_RATE -0.000108 4.13E-05 -2.612747 0.0098
C 0.043310 0.338055 0.128114 0.8982
Based on hypothesis test that has been done previously, variable EPS, DER, and BI rate does not significantly influence changes in the value of stock returns. By those onsideration, here is the panel data regression model:
� = �. ���� + + �. ����𝑹��𝑨 + �. ����𝑰��𝒍�𝒕���−�. �����𝒙���������𝒕� + �
Based on the regression equation, can be explained:
In the regression equation above, the constants is 0.0433. It suggests that if the variable EPS, DER, and ROA is zero, then the predicted stock returns at 0.0433.
Coefficient Return On Assets (ROA) has positive coefficient in the amount of 0.0105. It suggests that any increase of one percent ROA is predicted to increase 0.0105 Return Stock by assuming constant value in other variables.
Inflation has positive coefficient that is equal to 0.0543. It suggests that any increase of one percent inflation is predicted to increase by 0.0543 Return Stock by assuming constant value in other variables. Exchange Rate has negative coefficient value that is equal to 0.0001. It suggests that that any increase
of one percent Excgange Rate is predicted may decrease Stock Return of 0.0001 by assuming constant value in other variables.
3.3. SWOT Analysist
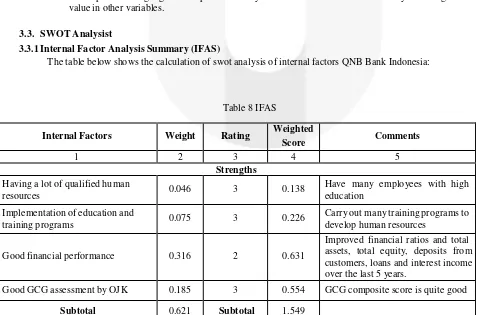
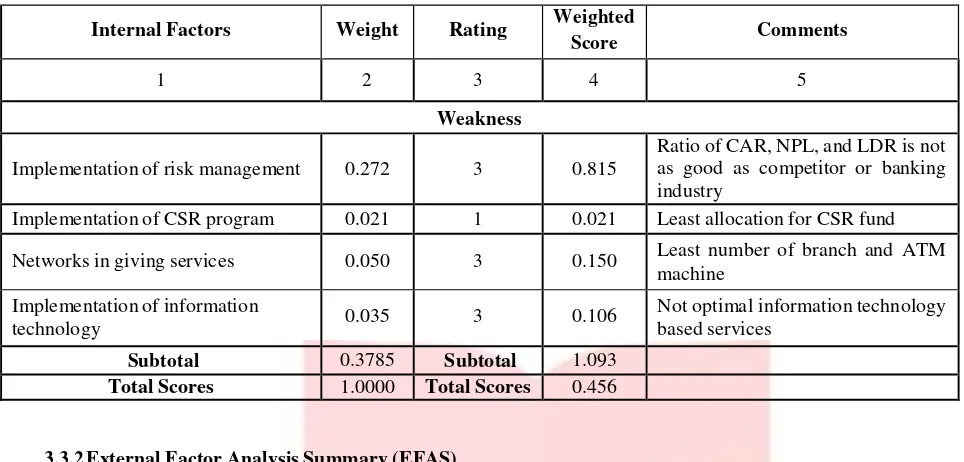
3.3.1 Internal Factor Analysis Summary (IFAS)
The table below shows the calculation of swot analysis of internal factors QNB Bank Indonesia:
Table 8 IFAS
Internal Factors Weight Rating Weighted
Score Comments
1 2 3 4 5
Strengths Having a lot of qualified human
resources 0.046 3 0.138
Have many employees with high education
Implementation of education and
training programs 0.075 3 0.226
Carry out many training programs to develop human resources
Good financial performance 0.316 2 0.631
Improved financial ratios and total assets, total equity, deposits from customers, loans and interest income over the last 5 years.
Good GCG assessment by OJK 0.185 3 0.554 GCG composite score is quite good
External Factors Weight Rating Weighted
Score Comments
1 2 3 4 5
Opportunities
The rapid development of IT 0.067 4 0.266
IT development is an opportunity for the banking industry to provide more practical and easy for customers
Government policy 0.142 2 0.284
The government's policy package create macroeconomic environment conducive to improve the domestic household consumption and strengthening equity markets
Market share is are relatively high 0.482 3 1.446
Market share is quite high compared with competitors in the banking industry that pertained to book 2 Products and services are varied than
competitors 0.081 3 0.243
Offering a variety of products and services
Subtotal 0.772 Subtotal 2.240
Threat
Unstable global economic conditions 0.154 4 0.615
The instability of the global economy result in lower levels of exports and imports to developing countries
The decline in industrial sector credit 0.075 1 0.075
Economic conditions reduce the rate
Implementation of risk management 0.272 3 0.815
Ratio of CAR, NPL, and LDR is not as good as competitor or banking industry
Implementation of CSR program 0.021 1 0.021 Least allocation for CSR fund Networks in giving services 0.050 3 0.150 Least number of branch and ATM
Total Scores 1.0000 Total Scores 0.456
3.3.2 External Factor Analysis Summary (EFAS)
3.3.3 Strategy Recommendation
Based on the total score of IFAS and EFAS, then be made SWOT Matrix to indicate the position of the company and the strategy that should be done.
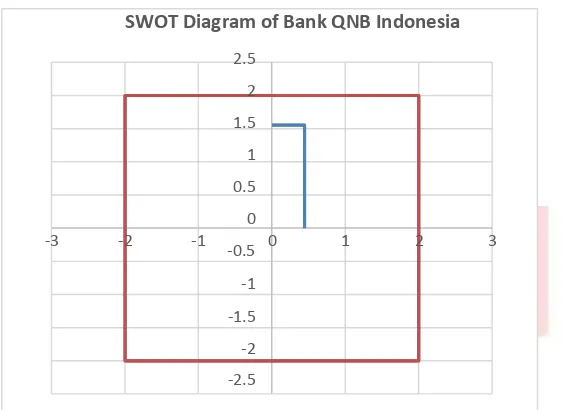
Figure 2 SWOT Diagram
SWOT Diagram of Bank QNB Indonesia
2.5
2
1.5
1
0.5
0 -3 -2 -1
-0.5 0 1 2 3
-1
-1.5
-2
-2.5
SWOT Diagram above shows that Bank QNB Indonesia’s position is in quadran 1. The diagram shows that Bank QNB Indonesia is suggested to do aggressive strategy by combining company’s strengths and opportunities to achieve business growth. The strategy recommendation in optimize human resources to provide better services in order to maintain customer loyalty and wide market share. Besides, goo services can be provided by developing IT in giving service to customer.
4. Conclusion
1. ROA, Inflation, and Exchange which has a significant influence on stock returns in the financial sector companies listed on the Indonesia Stock Exchange in 2010-2014.
2. EPS, DER, ROA, inflation, BI Rate, and Exchange Rate simultaneously significant effect on Return Shares of financial sector companies listed on the Indonesia Stock Exchange in 2010-2014.
3. QNB Bank Indonesia is the company with the lowest possible total return during the period of observation that took 36 samples, so the Bank QNB was chosen to in financial sector to do the analysis of the strategy. The position of QNB Bank Indonesia is located on SO position in SWOT Matrix thus recommended to combining company’s strengths and opportunities to achieve business growth.
Reference:
[1] Ariefianto, Doddy. 2012. Ekonometrika Esesnsi dan Apliasi dengan Menggunakan EVIEWS. Jakarta : Erlangga.
[2] Fahmi, Iram. 2014. Manajemen Keuangan Perusahaan dan Pasar Modal. Jakarta : Mitra Wacana Media. [3] Hunger,D., & Wheelen, T. 2003. Strategic Management and Business Policy. Yogyaarta: Andi.