DESIGN OF STOCK TAKING POLICY TO REDUCE THE TOTAL COST OF
STOCK TAKING USING CYCLE COUNTING METHOD IN WEST JAVA
DISTRIBUTION CENTER OF PT. XYZ
1Decky Ridho Sahertian, 2Dida Diah Damayati, 3Budi Santosa
1,2,3Program Studi Teknik Industri, Fakultas Rekayasa Industri, Telkom University
1[email protected], 2[email protected], 3[email protected]
Abstract
PT. XYZ is a 3rd Party Logistic who provide services to the client including Warehousing, Transportation & Distribution, Cross Docking In-plant Value Added Service and Logistics. They have a Distribution Center (DC) in Cibiru, Bandung to handle FMCG product. In maintaining the accuracy of its products, PT. XYZ has an average inventory accuracy for 6 months by 92.71% with the implementation of
stock take activity conducted every month to 6 SKU’s calculation. The total of stock take cost is Rp
62.022.000,00, with performing 2 days freeze activity. PT. XYZ needs to redesign the stock take policy and procedure in order to minimize the total cost of stock take activity and improve inventory record accuracy (IRA) higher than 92%. The calculation of ABC cycle counting method is done to determine the number of SKUs are counted in each stock take activity based on the value of each product. Results of calculation ABC cycle counting method is used to determine the schedule of stock take activity. Then the analysis of business process with business process improvement using streamlining tools in order to get an improvement of shorter cycle time. The use of cycle counting method chosen to focus more on calculations based on products that have demand and value. The implementation of the proposed stock take policy can reduce labor time by minimizing the stock take activities up to 19%, and have a load calculation of SKUs quantity reduced by 98.36%. Provide cost reduction of stock take activities as much as 17.30%, by reducing a cost of Rp 10.764.000,00 and The company should not do the freeze activity anymore. Business processes of stock take activities that have increased efficiency of 0.14 and a decreased time in each SKU stock take time of 634.46 seconds to 441.53 seconds.
Keywords: 3 PL, Inventory Record Accuracy, Cycle Counting Method, Stock Take Policy, Business Process Improvement, Stock Take Cost
1. Introduction
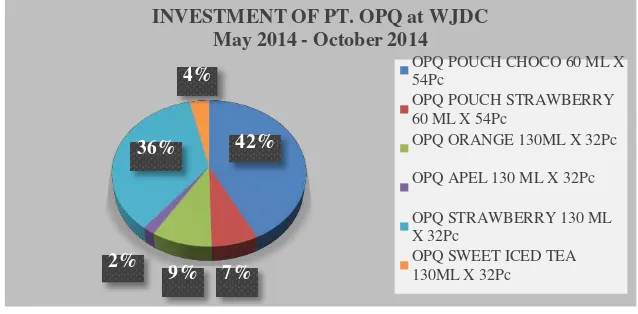
PT. XYZ is a 3rd Party Logistic who provide services to the client including Warehousing, Transportation & Distribution, Cross Docking In-plant Value Added Service and Logistics. They have a Distribution Center (DC) in West Java, called West Java Distribution Center, in Cibiru – Bandung to handle one of their customer’s, which is PT. OPQ. The product that they handle is FMCG product. There are two variants of the product, which are Pouch Variant and Bottle Variant. Pouch Variant has two SKU and Bottle Variant has 4 SKU.
INVESTMENT OF PT. OPQ at WJDC May 2014 - October 2014
Figure 1. Investment of PT. OPQ at WJDC
do checks on the accuracy of inventory record. PT. XYZ implement the stock take activity by do a freeze activity for 2 days calculate all of the SKU’s in the warehouse. After doing a stock take process, it can be obtained information on the inventory record accuracy of the initial nominal amount in the system, compared to the nominal stock of physical assets after activities take.
Shrinkage is a loss that is common in every 3PL warehouse. Based on aggregate data that do take stock since May to October 2014, PT. XYZ is declining with the percentage that can be seen in Figure 2 below.
Agregate of Shrinkage
7.55%
92.45%
Accuracy
Shrinkage
Figure 2. Percentage of Shrinkage
PT. XYZ shrank by 7.55% and the accuracy only 92.45%. The highest contribution of the shrinkage is 3.13% from OPQ Pouch Chocolate. Based on the results of the examination conducted by PT. XYZ, can be in the identification of the main factors that cause shrinkage in West Java Distribution Center (JWDC) is OPQ Pouch Chocolate products. Based on the data that has been shown above, it is necessary to take stock of making a planning policy to improve inventory record accuracy and minimizes the occurrence of shrinkage experienced by PT. OPQ. It is intended that the PT. XYZ faster in identifying the occurrence of shrinkage, so it can be traced more about the causes of shrinkage.
122,506,380.00
PROFIT LOSSES DUE TO FREEZE ACTIVITY
132,772,402.00
64,398,480.00
736,491,278. 00
710,195,820.00
OPQ POUCH CHOCO 60 ML X 54Pc
OPQ STRAWBERRY 130 ML X 32Pc
OPQ ORANGE 130ML X 32Pc
OPQ POUCH STRAWBERRY 60 ML X 54Pc
156,411,540.00 OPQ SWEET ICED TEA 130ML X 32Pc
OPQ APEL 130 ML X 32Pc
Figure 3. Profit Losses Due to Freeze Activity
Based on the Figure 3 shown above, the total profit losses due to the freeze activity every month is Rp 1,922,775,900.00. It is because when the company do the stock take activity, they have to freeze their inbound- outbound activity to count all of the product in their warehouse for 2 days. If that value added to the cost of stock take activity itself, amounted to Rp 62,226,000.00, so the total cost of a stock take activity is 1,985,001,900.00. With a level of accuracy that is only 92.45 % and the total cost of stock-take-activity is 1,985,001,900.00, need to be improved to reduce the total cost of stock take activity. Therefore, required a stock take policy proposal, which aims to take stock split time period. So that in case of shrinkage, the cause can be determined more quickly and traced the cause. Then, if the shrinkage has been minimized, hence significantly the percentage of inventory record accuracy will increase.
Stock Take Cost
high Therefore, required a stock take policy proposal, which aims to take stock split time period. So that in case of shrinkage, the cause can be determined more quickly and traced the cause. Then, if the shrinkage has been minimized, hence significantly the percentage of inventory record accuracy will increase. In addition to increase the inventory record accuracy, PT. XYZ could do a process improvement on their stock take business process. So that a new stock take business processes can be generated by a stock take policy that has been determined previously [1].
In addition, by using cycle counting can impact the calculation of the stock take more effective so that it can adjust the number of items that will be calculated so that it can provide savings in the calculation [2]. In addition to
increase the inventory record accuracy, PT. XYZ could do a process improvement on their stock take business process. So that a new stock take business processes can be generated by a stock take policy that has been determined previously.
The similar problem with this type of research has been done before by Miranti Putri Yuniar who use cycle counting method to minimizing the cost of stocktake at a distribution center. The other researcher that has been done with the similar type of problem is Dhea Fadhila that also use cycle counting method and business process improvement. Using the same method, researchers are trying to minimize the total cost of stock take activity and redesign the business process of stock take activity in a Distribution Center of 3 PL providers in Bandung city.
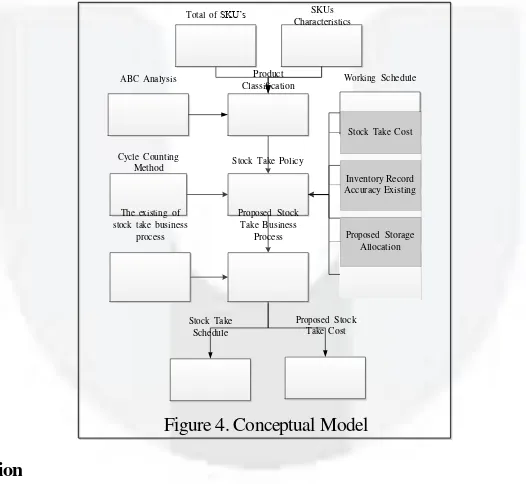
2. Design of Stock Taking Policy to Reduce the Total Cost of Stock Taking 2.1 Conceptual Model
Conceptual model is a concept of thought that can help researchers formulate a problem-solving framework and assist in formulating solutions or proposals of the issues discussed. In general, the steps of the research is to minimize the total cost of stock take activity and redesign the business process of stock take activity in West Java Distribution Center of PT. XYZ is as follows:
Total of SKU’s SKUs Characteristics
ABC Analysis Product
Classification Working Schedule
Cycle Counting
Method Stock Take Policy
The existing of
ABC analysis is used to classify items based on values owned by each of these items in a given period. In principle ABC analysis to classify an item based on the level of investment that is absorbed in the provision of supplies every type of item[2] . ABC analysis is a method of classification of items based on the level of the value of items, ranging from items with the highest value to items with the lowest value, then the item is classified into class A, B and C[3].
These are the steps in ABC calculation [2]:
1. Calculate the total demand by means of accumulating demand for each type of product in one month (Di)
2. Count the number of values for each product type (Mi) by multiplying the total demand of each product (Di) at a unit price of products (Pi)
��� = 𝐷�� 𝑥 𝑃�� (2)
3. Calculate the total amount of value to all types of products � = ∑��� (3)
4. Calculate the percentage value for each type of product (Vi)
�𝑖
𝑉𝑖 = �𝑥 100% (4)
5. Calculate the percentage of each type of product (Ii), where N is number of products
1
𝐼�� = �𝑥 100% (5)
6. Sort percentage value, the percentage value ranging from the largest to the smallest percentage value 7. Calculate the percentage of the cumulative value of each product type based on the order of a percentage
value
8. Determining the categories of products based on the cumulative percentages of each type of product, where category A is ≤ 20%, category B ≤ 30%, and category C ≤ 50%.
2.3 Cycle Counting
Cycle counting is a technique of counting inventory by dividing the inventory segments. Cycle counting is a method to solve the problems of supply and minimize the occurrence of [4]. Cycle counting method has several
advantages such as:
1. Can identify the occurrence of a fault quickly. 2. Can increase the inventory record accuracy.
3. Activities cycle counting can be done during ongoing operations.
4. Does not require the number of employees that much to do activity cycle counting. 5. It is a systematic improvement in addressing the issue of inventory record accuracy.
In industry, cycle counting method is used to check and ensure the accuracy of the recording of inventory by recording activities regularly and continuously. Unlike the physical inventory counting methods entire inventory at the same time.
Here are the steps to do perform the calculation method of cycle counting [5]:
1. Set number of frequencies for each classification ABC,
2. Multiply the number of each SKU in each class with a predetermined frequency, 3. Summing calculation of one year on class setaip to get the total calculation of one year. 4. Divide the total calculation of the year the number of working days in XYZ.
2.4 Inventory Record Accuracy
Inventory record is a document that contains the number and type of inventory owned by the company [6].
Inventory records can be shaped like a hardcopy of the book and in softcopy electronic documents or in a system. Inventory records aims to facilitate the company in knowing the amount of its inventory without having to physically perform calculations every wants to know the status of its inventory. The calculations to get the inventory record accuracy is as follows:
Overall SKU Accuracy = 𝑇𝑜� �� 𝑁����� 𝑜���������� 𝑅��𝑜��� 𝑥 100% ………. [6] 𝑁����� 𝑜� ���𝑜����ℎ�����
2.5 Business Process Improvement
Class Number
ABC classification analysis is a technique of calculating the number of products by classifying products into three classes, namely class A, class B, and class C. The amount of calculation A-class product on more than the calculation of the product in class B, and the number of calculations in a class B product more compared to the calculation of the product in class C.
Table 1. Product Classification
SKU ITEM May June July August September October Demand Price
1020006475
Total 652429 513023 524214 497111 482995 352135 3021907 308554
Value (Price x
Demand) HIT
Inventory Value (Value x HIT)
Average
Demand % AverageDemand % Inv. Value
Acc.
61,239,149,686 6 Rp 367,434,898,116 214166.3333 42.52275136 41.03967509 41.03967509 A
0.166666 667
0.166666
667 A
Rp
57,614,782,500 6 Rp 345,688,695,000 180125 35.76384052 38.61079009 79.65046518 B
0.166666 667
0.333333
333 B
Rp
14,854,351,710 6 Rp 89,126,110,260 46440.16667 9.220700703 9.954706604 89.60517178 B
0.166666
667 0.5 B
Rp
10,191,640,078 6 Rp 61,149,840,468 35642.33333 7.07678959 6.829970689 96.43514247 C
0.166666 667
0.666666
667 C
Rp
5,741,966,790 4 Rp 22,967,867,160 17951.5 3.564272494 2.565335548 99.00047802 C
0.166666
1.52625E+11 8.95316E+11 503651.1667 100 100 505.7309325 1 3.5
Table 2. Amount of SKU
Based on the calculation, could be known where the product that classified as A class is 1 SKU, 2 SKUs for B class and 3 SKUs for C class. The calculation is calculated from 6 SKUs that are in the warehouse PT.XYZ in May until October 2013.
3.2 Cycle Counting
Cycle counting is a method of performing activities stock take by dividing the inventory segments. Then it is calculated with the quantity because the the low amount of SKU but the high amount of quantity. By using a formula that is multiplying the number of cycle counting SKUs with the frequency of calculations that take stock to be adapted to the classification of ABC the results of the total to be counted every year. The frequency calculation is based on the APICs standard, which for the A class is counted for 4 times, B class is counted for 2 times and C class is counted for 1 times [3].
Table 3.b. Cycle Count Calculation
Based on the above calculation, the total calculation in 6 month as much as 11 times. Here are the steps to do perform the calculation method of cycle counting [5]:
1. Calculations of cycle counting method begins with a set of frequency count for each classification ABC. Count of frequency that is set for the calculation of this study follow the standards defined by APICS, in order to get four times the calculation in 1 year for category A, 4 times a calculation in 1 year for category B, and 3 times in 1 year calculations for category C.
2. Multiplying the quantity of every SKUs by category ABC with the predetermined count of frequency, so we get the number of calculations in one year for each category.
Example: 118986 (Quantity of OPQ Pouch Choco) x 4 (frequency of A Class) = 475943 So the total of carton in class A is 475.943 carton that need to be counted for 1 year.
3. Obtained from the annual count divided by the number of working days in a year. PT.XYZ work schedules 6 days a week. Number of working days specified for this calculation has reduced the number of national holidays as much as 19 days, in order to get 300 days of work in one year. The number of working days and then divided by the total calculation as much as 1 year, so it is obtained the calculations take stock of activity during the first day is calculated as 2.645 carton for A class.
4. Final calculation is divide the daily count of quantity to the pallet capacity of every SKUs
So the total calculation of class A in one day are 17 Pallets, class B are 5 pallets for OPQ Strawberry and 3 pallets of OPQ orange, and class C are 1 Pallet for OPQ Pouch Straberry, 1 Pallert for OPQ Sweet Iced Tea and 1 Pallet for OPQ Apel.
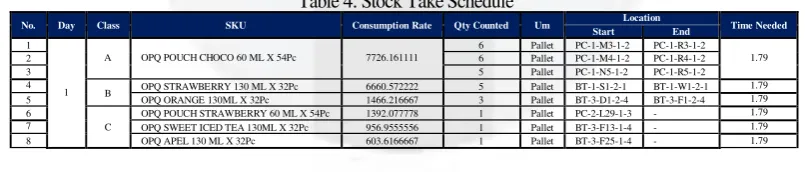
3.3 Stock Take Schedule Design
The determination of the schedule stock take based on consumption rate in each category of the ABC. SKU consumption rate that has the greatest value would be calculated in advance compared to other SKU that have a value lower consumption rate. The determination of the schedule stock take this was based on the SKU that has a SKU movements faster than others with regard to value the ABC category. The determination of the schedule of stock take can make the stock take activities widened more focused because of a little quantity of SKUs and tracking of goods that could be the difference in focus is not burdened with another SKU that is not calculated on that day.
Table 4. Stock Take Schedule
3.4 Workflow Design of The Stock Take Activity
Stock take activity with serpentine method takes an average of total time for about 634.46 minutes. In the stock-take activities proposed counting products based on a set schedule and go directly to the product which will be calculated by the time calculation for one SKU on average for 2.03 minutes.
3.5 Stock Take Cost Design
pallets were calculated. Changes in the calculated number of SKU certainly will not need as much time as take stock of existing activities in addition to the operator that is used to calculate the 28 pallets were not as much as operator on stock take activities existing. Operator is used to calculate stock SKU based activities take enough improvement requires three people to count 6 SKUs every day. Changes in the number of workers to count the SKU will result in changes in the cost of activities. The existing cost is summarize all of the payment that PT. XYZ should pay, from normal salary until the stationary cost. For the improvement, the overtime cost, meal and transport cost in in overtime are removed because the cycle counting is conducted every day in a normal time.
Table 4. Stock Take Cost
Stock Take Cost (Existing) Improvement
No Description Total Total
1 Normal Salary 2,592,000.00 432,000.00 2 Overtime Cost 6,624,000.00 - 3 Meal Cost 810,000.00 45,000.00 4 Transport Cost 810,000.00 45,000.00 5 MH Cost 50,940,000.00 50,940,000.00 6 Stationary Cost 450,000.00 450,000.00
Total 62,226,000.00 51,462,000.00
Difference 10,764,000.00
% Minimize 17.30%
Based on the proposed cost, XYZ can minimize the total cost of stock take activity by 17.30% or Rp 10.764.000,00.
3.6 Business Process Improvement
Below shown the existing time data activity that has been calculated in can be known how the efficiency of time after the elimination of activities. Here below is the calculation the efficiency of a given business process proposals [4]:
Table 5. Business Process Improvement
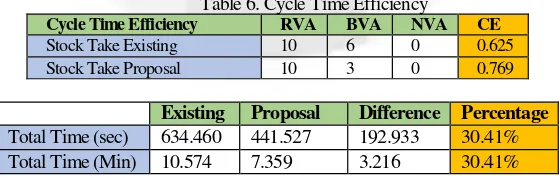
The calculation of the cycle time efficiency is based on the improvement of stock take business process. From the calculation of cycle time efficiency above, there is an increase of 0.14 compared with the existing condition. Business process of stock take activity is not only increased efficiency but also decreased the activity time so that the counting time can be shorter for 30.41%. It shown below on the Table 6.
Table 6. Cycle Time Efficiency
Cycle Time Efficiency RVA BVA NVA CE
Stock Take Existing 10 6 0 0.625 Stock Take Proposal 10 3 0 0.769
Existing Proposal Difference Percentage
Total Time (sec) 634.460 441.527 192.933 30.41%
Total Time (Min) 10.574 7.359 3.216 30.41%
4. Conclusion
for 97.41% or as much as Rp 1.933.539.900,00 because the company should not do the freeze activity anymore. The increase of efficiency in business process of stock take activity for 0.14 and stock take time reduction of 634.46 sec becomes 441.53 sec. And based on the design of storage allocation using lean warehousing that has been proposed by Mahardiani Beningrum on her research, the total time to do the stock take activity is 10.74 minutes a day, which 1.79 minutes for each bay.
5. References
[1] M. D. Rosseti, T. Collins and R. Kurgund, Inventory Cycle Counting, Arkansas: Department of Industrial Engineering - University of Arkansas, 2001.
[2] B. Donath, The IOMA handbook of logistics and inventory management, New York: J. Wiley and Sons, c, 2002.
[3] R. B. Brooks and L. Willson, Inventory Record Accuracy Unleashing The Power Of Cycle Counting Second Edition, New Jersey: Jhon & Wiley Son, Inc, 2007.
[4] D. Harrington, Business process improvement Workbook, New York: The McGraw-Hill Companies, Inc, 1991.