Distribution of Total Suspended Solids
Concentration in a River
Ahmad Hanif Asyhar
1and Basuki Widodo
1AbstractDisposal of either industrial or nonindustrial wastewater into a river has a potential to cause river
pollution. Because each load of wastewater discharged into a river contains physical, chemical, and biological parameters that determine water quality, so that it can affect the dissolved oxygen concentration in a river. Therefore the conducted research was aimed to determine the pattern of pollutant dispersion in Surabaya River within the section that is closed to the Karang Pilang Monitoring Station - Surabaya. Parameter used in this research was Total Suspended Solids (TSS). The method used was the finite volume method with Quadratic Upwind Interpolation Convective Kinematics(QUICK) scheme by means of developing models of dispersion water pollutants in a river. The governing equation was controlled by the laws of mass conservation, momentum conservation, and pollution transport equation. Further, these equations were solved using numerical calculation and followed by numerical simulation. From the numerical simulation results, it can be concluded that the magnitude of pollutant dispersion is determined by the initial discharged TSS concentrations into the river, however the longitudinal direction is more dominantly influenced than in lateral directions
.
Keywords QUICK Scheme, TSS Dispersion, River
AbstrakPembuangan air limbah, baik dari industri maupun dari nonindustri, ke sungai berpotensi menyebabkan pencemaran. Karena setiap beban limbah cair yang dibuang ke sungai memuat parameter fisik, kimia, dan biologi yang menentukan kualitas air sungai, sehingga dapat mengubah atau mempengaruhi konsentrasi oksigen terlarut dalam sungai. Karena itu penelitian ini bertujuan untuk menentukan pola penyebaran polutan di Kali Surabaya, yang lokasinya dekat dengan stasiun pemantau Karang Pilang - Surabaya. Parameter polutan yang digunakan dalam penelitian ini adalah Total Suspended Solids (TSS). Metode yang digunakan dalam penelitian ini adalah metode volume hingga dengan Quadratic
Upwind Interpolation Convective Kinematics (QUICK) melalui pengembangan model polutan air dispersi di sungai dengan
persamaan kendali dibangun dari hukum kekekalan massa, hukum konservasi momentum, dan persamaan transportasi polutan. Selanjutnya persamaan-persamaan tersebut diselesaikan dengan menggunakan perhitungan numerik dan simulasi numerik. Dari hasil simulasi numerik ini dapat disimpulkan bahwa besarnya dispersi polutan di sungai ditentukan oleh konsentrasi awal yang dibuang ke sungai, namun ke arah longitudinal lebih dipengaruhi secara dominan daripada ke arah lateral.
Kata KunciSkema QUICK, Dispersi TSS, Sungai
I.INTRODUCTION1
iver which is one of the natural water resources must be protected from the influence of waste water or pollutants. It means that the river water quality must be maintained and secured from the causes of pollution, such as discharges from industrial waste, domestic waste, agricultural, TSS and other wastes, into the river [1-2]. Therefore, a pollutant dispersion and transport modeling is very important to evaluate the risk of accidental discharge and hazardous in the river and also to understand the biogeochemical transport in the river ecosystem [3].
In this research we therefore will develop a numerical method, i.e. finite volume method using Quadratic upwind Convective Kinematics (QUICK) scheme. The finite volume method is a method that can be used for solving mathematical model numerically.
A. Finite Volume Methods
The rapid development of numerical methods in line with the rapid growth of the computer, so that various numerical program package has been developed to solve models of natural phenomena. According to Broadly, numerical methods can be classified into three groups,
Ahmad Hanif Asyhar and Basuki Widodo are with Mathematics Department, Institut Teknologi Sepuluh Nopember Surabaya, 60111, Indonesia,Email:[email protected],[email protected]
namely the finite element method, finite difference method, and the finite volume method. Finite element method based on variational formulation written for discrete and continuous problems [4]. The variational formula is obtained by multiplying the initial equation with a test function. The basic principle is replacing the finite difference method with finite difference derivatives through the use of Taylor series. While the basic principle of the finite volume method is integrating equation for each cell is determined [5].
Finite volume method is a method that can be used for creating and solving numerically of mathematical model. According to [6], this method is appropriate applied to the fluid flow and aerodynamics problems. Fluid flow satisfies certain physical properties such that it can be constructed into mathematical equations. The properties such that the law of conservation of mass, conservation of energy, law of conservation of momentum, and the others are well defined in fluid flow.
The procedures of this method according to [6] are: a. Defining the geometry of the flow.
b. The domain of the flow is described in the mesh or grid of volume control that does not overlap that can form an equation that can be made chart
c. The discretized equation is an approximation of the value at each point.
The discretized equations further are solved numerically.
B. Quadratic Upwind Interpolation Convective kinematics(QUICK)
Discretization is a process in splitting calculation domain or area into several smaller areas called grid, mesh, or cell. First, by setting the value at the calculation boundary condition, then the value of the flow rate, pressure, and temperature can be calculated for each mesh cell, and the grid that is determined based on the required equations.
Illustration for two-dimensional volume control on each node can be illustrated in Figure 1.
Discretization uses QUICK method to change the value of the face value at a node further is illustrated in Figure 2.
is weight function respectively.
By using Lagrange interpolation technique, this equation is solved numerically and it is obtained a new
A. Electric Propulsion Design
According to [7-8], Governing equation for fluid flow and pollution in the river can be developed from the law of mass and momentum conservations, and transport equation. Further, the forces working in the body of the river are the compressive force on the longitudinal direction (B), viscous shear stress (S), shear friction caused by the bottom and walls of the river (Fb), hydrostatic force (P1), and volume control
hydrostatic force River (P2)and gravity (W).
Now derive mass conservation equation in x-axis direction:
However, mass conservation equations in y-axis direction:
( ) ne n w nn n s 0
d
A yu yu xv xv
dt
due to the y-axis direction , the equation becomes:
( )
We further consider the equation of conservation of momentum in x-axis direction, namely:
( ) ( n )
faces d
V u A F
dt
Because the value of the two-dimensional
; e w ; n s However, a momentum conservation equation in y-axis is
Because the value of the two-dimensional
;
e w;
n sin the above equation is the concentration of pollution in the river.
From the substitution of mass conservation Equation 2 into the conservation of momentum in the x-axis (4), it is obtained that
By using the same method as above, we obtain an equation in the y-axis:
1 2
We now apply QUICK schemes on Equation 6 and Equation 7 respectively, it is obtained:
1 2
By substituting Equation 8 into the Equation 9, it is obtained following equation:
We further solve the equation (10), it is obtained
two-dimensional QUICK scheme. We obtain a system of equations of
AX
C
in which simulate by using MATLAB software.III.RESULTS AND DISCUSSION
The secondary data was obtained from PT Jasa Tirta I, because of the limitations of the data provided to the researchers, the data used in the computer simulation is only three months, i.e. January 9, February 9 and March 12, 2011. The data included TSS concentration, river current, river depth and its cross sectional area of Surabaya River. The TSS concentration was then spread by a numerical simulation using MATLAB software. The data used during the simulation as follows:
river depth (h) = 2 m the river current = 0.1 m / s cross-sectional area = 12 800 m2.
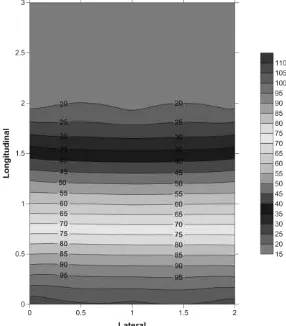
Obtain numerical solutions and visualize the numerical solutions as shown in Figure 3 to 5.
numerical calculation yields the maximum and minimum TSS concentration of 44.5 ppm and 6.3 ppm as the minimum concentration. Meanwhile, at March 12, 2011 in which we set the initial value of TSS concentration of 139 ppm, numerical calculation yields the maximum and minimum TSS concentration of 108.6 ppm and 15.4 ppm.
Reduced levels of pollution can be caused by the movement of pollutants following the flow of river water. the magnitude of pollutant dispersion is determined by the initial discharged TSS concentrations into the river, but the longitudinal direction is more dominantly influenced than in lateral directions.
IV.CONCLUSION
Based on the developed model equation of the TSS concentration distribution in the river by using the QUICK scheme, and this equation was then solved using numerical calculation and followed by numerical simulation, it can be concluded that the magnitude of pollutant dispersion is
determined by the initial discharged TSS concentrations into the river, however the longitudinal direction is more dominantly influenced than in lateral directions, is determined by the initial discharged TSS concentrations into the river. From the computer simulation results it can be concluded that the distribution of pollutants contained in the TSS distribution is the smallest of pollutants on February 9, 2011 and the greatest concentration lies on January 9, 2011 in the three months that simulated.
ACKNOWLEDGEMENT
We would like to thank the ITS that has provided the Research Grant, and supports for dissemination of the paper at The Journal for Technology and Science – IPTEK ITS. This research is funded by non-tax revenues in accordance with the agreement ITS assignment in the context of the implementation of ITS research laboratory in 2012 number: 1027.108/IT2.7/PN.01/2012 dated May 2nd, 2012.
Figure 1. Two-dimensional control volume. Figure 2. QUICK discretization
Figure 3. Distribution pattern of TSS concentration at January 9, 2011 Figure 4. TSS concentration distribution patterns at February 9, 2011M
Figure 5. TSS concentration distribution pattern at March 12, 2011. ( , )i j
( ,i j 1) ( ,i j 2) ( ,i j 1)
( ,i j 2)
( , )
e i j
REFERENCES
[1] S. Fardiaz, “Water and Air Pollution”, Publisher Canisius, Jakarta, 1992.
[2] M. S. Tarin and Edward, "Content of Total Suspended Solids (Total Suspended Solid) Raha Waterway, South East", Journal of Makara Science vol. 7, no. 3, December 2003.
[3] Deng Zhi-Qiang. and H.S. Jung “Scaling dispersion model for
pollutant transport in rivers”, Department of Civil and Environmental Engineering, Louisiana State University USA. 2009
[4] B. Widodo and M. Siing, ”Numerical Solution of Flood Routing
Model Using Finite Volume Methods”, International Journal of
Studies in Nonlinear-Studies, vol. 2, no. 1, PP.40-45, 2011.
[5] N. Hidayat N. "Central-Upwind Scheme Semi Discrete Well-Balanced for Saint Venant equations", Dissertation University of Airlangga, Surabaya, 2012.
[6] D. Apsley, "Computational Fluid Dynamics", Springer, New York, 2005.
[7] B. Widodo,"Application of Finite Different Methods on 1-D Settlement Equation Flow and Pollutant Transport ", Department of Mathematics, ITS, Surabaya, 1994.
[8] B. Widodo,” The Influence Of Hydrodynamics On Pollutant