THE EMERGENCE OF COMBINED STUNTING AND OBESITY AS A NUTRITIONAL THREAT TO CHILD DEVELOPMENT IN INDONESIA*
Atmarita1; Triono Soendoro2; Abas B Jahari1; Trihono1 dan Robert Tilden3 1The National Institute of Health Research and Development (NIHRD), Ministry of Health 2Former DG of NIHRD, Special Advisor to Minister for Health Risk Factor, Ministry of Health
3
Consultant for NIHRD, Ministry of Health ABSTRAK
KEJADIAN MASALAH BALITA PENDEK BERSAMAAN DENGAN KEGEMUKAN MERUPAKAN ANCAMAN BAGI PERTUMBUHAN DAN PERKEMBANGAN ANAK
DI INDONESIA
Tahun 2007 Indonesia melakukan penilaian status gizi anak balita meliputi berat badan (BB) dan tinggi badan (TB), sehingga variasi TB/U dan BB/TB dapat ditentukan. Penulis menelaah sebaran kependekan dibandingkan dengan kekurusan pada anak-anak di berbagai wilayah di Indonesia, dan membandingkannya dengan risiko pendek dan kurus untuk menentukan apa dan bagaimana kebijakan baru dan intervensi gizi masyarakat dibutuhkan. Riset Kesehatan Dasar (Riskesdas) 2007/2008, yang merupakan survei potong-lintang berskala nasional, mencakup satu juta orang, termasuk penilaian status gizi 100.000 anak-anak prasekolah dengan menggunakan standar antropometri WHO 2005. Anak-anak dengan TB/U < -2 SD dianggap pendek, anak-anak dengan BB/TB < -2 SD dianggap kurus, dan anak-anak dengan BB/TB > 2 SD dianggap gemuk (obese). Sekitar 37
persen balita yang diukur ternyata pendek. Dua persen pendek dan kurus, 8 persen gemuk dan pendek, 27,8 persen pendek tetapi tidak kurus atau gemuk. Risiko ini bervariasi menurut jenis kelamin, usia dan daerah. Saat ini Indonesia tidak mempunyai program gizi masyarakat yang terfokus pada masalah terlalu pendek atau terlalu gemuk. Secara jelas kependekan dan kegemukan adalah ancaman utama pada pengembangan sumberdaya manusia di Indonesia.
Kata kunci: anthropometric assessment, stunting, obesity.
*)Disampaikan pada 19th International Congress of Nutrition (ICN 2009) 4 – 9 October 2009, Bangkok – Thailand.
BACKGROUND
ndonesia established a national nutritional status monitoring system in 1989, using the national annual consumer survey, or Susenas. Prior to that time, nutrition status surveillance was done on a more ad-hoc basis, with various projects doing baseline and/or follow up nutritional status survey. After 1989, national samples of children were randomly samples to represent the nutritional status of children in Indonesia.
I
Nutritional status was measured as weight for age. Initially the NCHS standard weight for age, was used as the international reference standard, the assessment was done once every three years, except during the 1998-2002 period when it was done annually to gauge the impact of the monetary crisis on nutritional status of children.
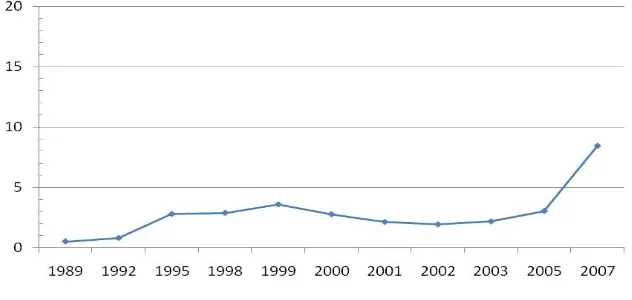
proportion of overweight decreased. However, since the monetary crisis, particularly between 2003 to 2007 there has
been an astronomical increase of overweight preschool children.
Figure 1
Proportion of Susenas sample with weight > +2 SD Weight for Age (WHO -2005) Basic Health Research (Riskesdas)
shows that 37.3% of Indonesian preschool children are stunted, and this lack of growth velocity is compounding obesity problem, and many of the obese children are also stunted. Promoting weight gain in the absence of improving growth velocity can compound the nutritional problems not only for the present, but increase risk of chronic disease such as hypertension and stroke in the future.
RISKESDAS SURVEY
The Riskesdas survey data was collected within the BPS Susenas sample frame for 2007. Enumerators were trained to collect data, take measurements, collect blood, exam eyes and teeth, question about health behavior, morbidity, history of household mortality, history of accidents, quality of life, and utilization of health services.
PRESCHOOL NUTRITIONAL STATUS INDICES COLLECTED BY THE RISKESDAS SURVEY
The basic strategy of the survey was to collect additional health data at the Susenas
survey cluster sites included in the 2007 Susenas data set. About 95% of all the households included in Susenas were also included into Riskesdas. The data on nutritional status was collected by interview and measurement. Participants were asked about their age in months, and then the child was weighed, and their height was measured.
Riskesdas included measures of weight, age, height for preschool children, as well as mid upper arm circumference (MUAC) for women, and measures of waist size for adults. The analysis reviewed the Riskesdas data in terms of height for age (stunting), and weight for height (body mass) for children underfive, and see how these figures compare to the overweight (> 2 SD WAZ) data both in 2007, as well as review the time trends of overweight from the Susenas data.
were used, and for historical analysis, data collected using NCHS standards, were recalibrated to the new WHO standards. Outliers were eliminated from the analysis.
The Riskesdas data was collected from the same households included in the 2007 Susenas data so that health data from that survey as well as household data, including consumption, education, and household condition can be linked to the individual and household Riskesdas data. above the weight per age standard. c. Stunted is defined as children less than
2 standard deviations below the height per age standard.
d. Wasted is defined as less than 2 standard deviations below the weight per height standard.
e. Obese is defined as children more than 2 standard deviations above the weight per height standard.
f. Tall is defined as children above 2 standard deviation height for age standard
g. Waterlow classification system is an approach of looking at community nutritional status where children fall into four categories
Historically the national nutritional status of Indonesia has been estimated using a sample of child weight compared to the international reference weight for that age. Height is a difficult measure to make, and requires more effort, time and training to do well. Using the weight for age nutritional status indicator, Susenas first started collecting nutritional status for the country. In 1989, the first year it was collected, over 30% of the children were underweight, in 2008, less than 18.45% of the children sampled were below -2 standard deviations from the international reference weight for their age.
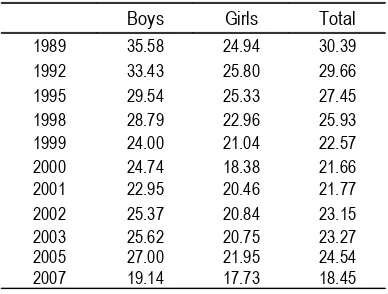
Table 1
Pre-school girls have historically had a lower proportion of its cohort underweight than boys. Much of the improvement in aggregate nutritional status seen over the last 20 years has been a reduction of the difference between boys and girls in terms of risk of being underweight. In 1989, the first year that the data was collected by Susenas,
girls were almost ten percent less likely to be underweight. In 2007/2008, the difference was less than 1.5 percent. While the proportion of children underweight by age has decreased from 35 percent to 19 percent, for girls it has only decreased from 25% to a little less than 18%. This decrease is seen in Figure 1 below.
Figure 2
Underweight by year of observation and gender Susenas 1989-2005, And Riskesdas 2007/2008
However weight for age is a very sub-standard indicator of nutritional status, particularly for monitoring community nutritional status of pre-school children. It is generally recognized that weight for height which for children is a good measure of body mass is a more closely related to health consequences of poor nutrition. Stunting also is an important indicator, and has also been shown to be related to health and development consequences in physical and mental development. Moreover stunted children develop more slowly, are less likely to reach their full physical or mental potential, and are more prone to chronic disease when adults such as hypertension, which will put
them for risk of stroke and heart disease as they become older1.
and stunting has twice the prevalence among preschool children than being underweight.
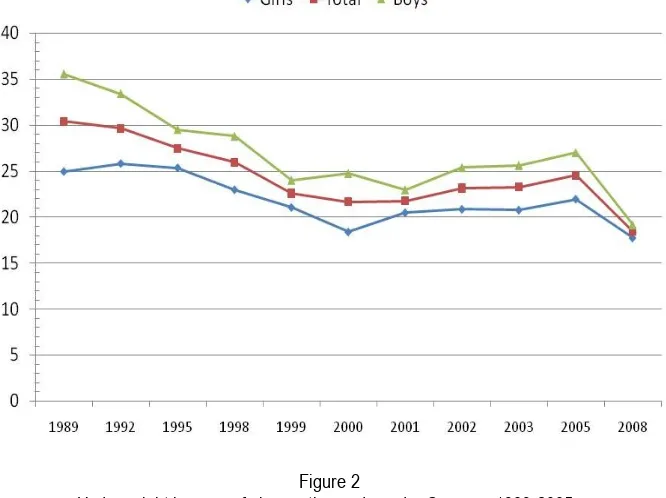
In the underweight analysis in 2008, only 18% of the children are underweight, implying that 82% of the children are normal. However using the Waterlow classification scheme which includes stunting, and wasting; slightly more than 50% of the
children are “normal” because over 37% of the children are stunted, and over 12% are wasted. So, including stunting as part of the definition of “poor nutrition”, the rates of malnutrition more than double from the risk using “underweight” as the definition of poor nutrition.
Figure 3
Stunting and Wasting among Indonesia Children 2007/2008
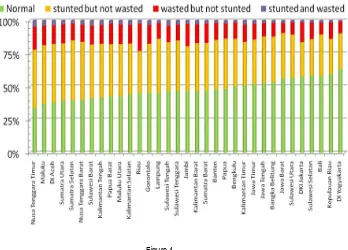
Figure 4
Wasting and Stunting is not constant across all the provinces of Indonesia. Twenty three of Indonesia’s 33 provinces have less than 50% of their pre-school children in the “normal” category. More children in NTT are in the stunted category than are in the normal category. NTT also has the highest rates of “wasting” both in terms of stunted
and non-stunted wasting. In addition only 35% of it preschool children are actually “normal” in terms height, and body mass issues. The provinces with the best nutrition as measure by low rates of stunting are Bali, Kepulauan Riau and Yogjakarta. Sulawesi Selatan also has fairly good nutritional status in terms of low risk of stunting.
Figure 5
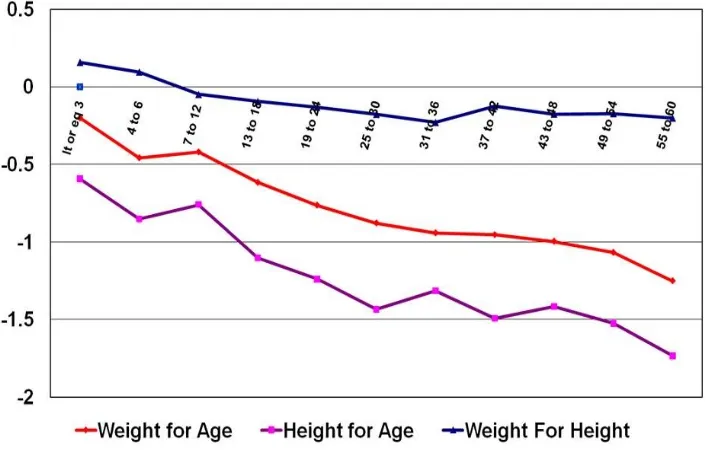
Median weight for age, height for age, and weight for high for pre-school children, 2007/2008 Indonesian children are born fairly close
to the international reference standard for weight and height (length). Because the levels of stunting are greater (median values are lower) that the levels of underweight (as can be seen in figure 4), the median value of weight for height, which is the measure of body mass most often used for infants and young children is above the international reference standard for children younger than six months. Even though almost half the children of Indonesia are “short”, which is also the consequence of poor quality nutritional inputs, the risk for declining stature attainment of international standards is greater than the risk of achieving weight for age international standards.
Historically weight for age has been the primary nutritional indicator monitored for “nutritional status” of the Indonesia on a national level. In 1989, Bappenas commissioned the National Statistical Bureau (BPS) to collected data on nutritional status, for children within the susenas households. This data has been collected once every three years, except during the monetary crisis period when it was collected annually from 1999 to 2003.
period of life, has changed by applying the new WHO international reference standards. Now as can be seen in figure 5 below there is a gradual consistent drop off in weight per age (away from the international reference standards starting a birth). All of the time series data has been re-analyzed using the new standards, which has changed the shape of the various age growth faltering curves, that nutritionist have gotten use to seeing from Indonesia over the years.
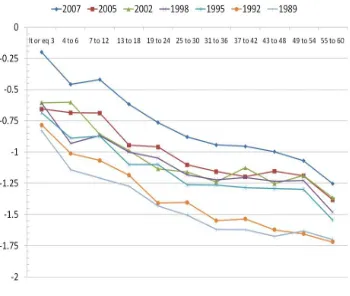
From 1992 to 2007-2008 weight for age has improved over 0.5 standard deviations across the various age cohorts. In 1989 and 1992, there was not much of a change at any age group during the three years period between observations. However, between 1992 and 1995 there was an improvement in
nutritional status, but the age specific nutritional status tended to stagnate to 2005, with the nutrition status between similar in the 1998, 2002, and 2005 nutritional assessment. But in 2007 there was once again a significant improvement of weight for age within all pre-school age cohorts. But even though there was been an “upward shift” in the growth faltering curve suggesting significant improvement in nutritional status, and decrease in the magnitude of growth faltering, the shape of the curves between the various years is similar, except in the very early age of 3 to 12 months. In 2005, the nutritional status remains the same across the first year of life, and in 2007-08, it improves between 6 months and 12 months.
Figure 6
Median Weight for age by age cohort, Susenas 1989-2005; Riskesdas 2007-08 While nutritional status as measured by
weight for age has been slowing improving over the last twenty years, the difference
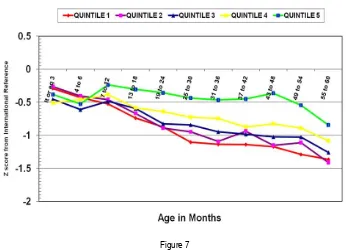
figure 7, the nutritional status of children from the highest level of expenditure (quintile 5) is somewhat higher than the lower four quintiles of household expenditure, and that quintile 1 has the lowest level of nutritional
achievement, but there is not that great of difference between the bottom three quintiles of household expenditure in terms of nutritional status as illustrated by weight for age.
Figure 7
Weight per age by age cohort and household expenditure quintile, 2007/2008
In part this can be explained by the fact that of all monthly household expenditures for most families of Indonesia, food expenditures represent over 60% of the household expenditures. However the portion of the household expenditure for food is similar for the bottom four quintiles, and only drops below 50% of household expenditure for the 5 (richest) household expenditure quintile.
Table 2
Proportion Household expenditure For food by expenditure quintile quintile Food Exp Health
Exp
Tobacco Exp
1 69.3% 6.4% 5.1%
2 65.7% 7.6% 10.1%
3 62.5% 8.0% 7.0%
4 58.5% 7.9% 7.5%
5 47.9% 6.3% 8.4%
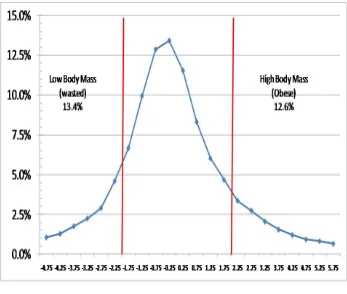
The Riskesdas data set also did measurement of heights. This allows for comparison of weight for height. The standards are set up in terms of ideal weight for particular height. Using the measured height of the children, the weight is compared by who many standard deviations the observed weight (above or below) from the ideal weight. Weight is the commonly accepted standard for body mass for children, and below -2 standard deviations from the norm is considered wasted, while 2 standard deviations above the international reference is considered obese.
Indonesia weight for height or body mass has a fairly normal distribution with 13.4% of the children in the low body mass, or wasted area, while over 12.6% of Indonesian pre-school children are over two standard deviations above the international reference weight for height, implying actually
very high levels of obesity as well as wasting among preschool Indonesian children.
WHO suggest that having over 10% of the children below -2 SD weight for height is a significant public health problem, and 15% below -2 SD is an emergency requiring immediate intervention, Indonesia has 13.6% of its children in the wasted category, and over 12.6% of its children in the obese category. While India and Laos both have a higher proportion of its children wasted (as can be seen in Table Appendix 6), Australia reports having not wasted children, while the US reports only 0.4% of its preschool population being below -2 SD weight for height, and the Netherlands, reports 2.7% of its preschool children being below -2 SD weight for height. However in terms of obesity (+2 SD weight per height), Indonesia has a higher proportion of its preschool population obese than China, Thailand, Australia or the US.
Figure 8
So the nutrition status of Indonesia is improving in terms of weight gain, but not in terms of linear growth, which is contributing to the problem of obesity. Several countries in South and Southeast Asia have higher
levels of stunting, than Indonesia, but they also have roughly the same proportion of underweight as stunting. Many of the stunted children in Indonesia are overweight.
Figure 9
Risk of Stunting by Weight for Height category, Riskesdas 2007/2008 If we look at proportions of the
population that are stunted by weight for height category, we can see that of the wasted children (< -2 SD WHZ) about 15% are stunted, children that are normal in terms of body mass, have the national average for stunting, or 37%, however children classified as obese using weight per height index are primarily (60%) stunted.
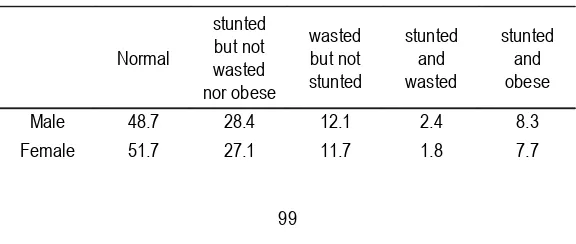
The traditional classification scheme is no longer appropriate for the changing nutritional profile of Indonesia, as stunted and obese is a much more prevalent condition in Indonesia that stunted and
wasted. As can be seen in table 3 below the prevalence of stunted and obese is approximately 4 times higher than the prevalence of stunted and wasted among pre-school children. Eight percent of Indonesia’s pre-school population is stunted and obese, and these children are also malnourished, and have health risk associated with their condition, include both developmental issues, mental health issues, and mental health issues of self esteem, as well as capacity to participate in sports and physically intense activities.
Table 3
Revised Waterlow classification scheme
Normal
stunted but not wasted nor obese
wasted but not stunted
stunted and wasted
stunted and obese
Male 48.7 28.4 12.1 2.4 8.3
Total 50.2 27.8 11.9 2.1 8.0
Figure 10
Proportion of preschool population obese and short by province Riskesdas, 2007/2008 DISCUSSION
This problem of stunted obese children occurs in many of the provinces of Indonesia. Historically nutritionists have assumed that stunting is associated with chronic caloric deprivation and household food security, and in many areas of the world stunting is more often associated with wasting2. But in several project areas there is a high prevalence of stunting and obesity and in these areas food intake is not likely to be linked with risk for stunting, and interventions focusing on household food security are not likely to have much of an impact on the risk for stunting/obesity.
Height attainment and linear growth is not well understood, but it is generally accepted that stunting is a risk factor of dietary diversity3
, poverty and low food intake4, and chronic infection5 that starts shortly after conception, continues on thru pregnancy and the first few years of life. Some animal based studies have suggested
that fatty acid content of food might be associated with long bone growth (in particular the femur), and that diets in low in lipids and fatty acids are probably more “risky”, for stunting.
The role of the speculation on fat intake in terms of risk for stunting was first seen in 19936
. In China it has been noted that reduced fat and protein intake was associated with stunting in rural areas of the country7. It has been noted in to be associated with anemia, low birth weight, education of the parents, occupation of the parents8, poor sanitation conditions, young maternal age, large families, in Brazil9. In Libya, stunting has been found to be associated with low educational attainment by children’s fathers, poor psychosocial stimulation, poor housing environment, diarrhea, and low birth weight10
.
of wasting, have relatively high levels of stunting. Vietnam in a recent study reported in 2008 found higher rates of underweight (31.8%) and stunting (44.5%) than Indonesia, but similar levels of wasting (11.9 %)11.
This pattern of stunting and obesity has been noted by researchers in many locations around the world. In 1996, Berry Popkin reported on this pattern of malnutrition in Russia, Brazil, China and South Africa, but was unclear as to the cause of this nutritional problem12. However researchers continued to find this pattern of stunting and obesity in Mexico where it was associated with younger maternal births, and lower maternal perceived social status, or maternal obesity13. In South Africa they found that younger mothers in particular were likely to produce stunted children that were obese14. Further research in South Africa into this issues demonstrated that stunting and obesity as a pattern of malnutrition was found in 17.1% of the children was almost as high as the risk for stunting, suggesting that most stunted children were obese. They found that many socio-economic determinants were associated with this pattern of nutritional risk15.
In Brazil, they found that childhood stunting was associated with impaired fat oxidation, which suggest that a stunted child would tend to store fat, rather than metabolize it, which has ramification for risk as well as control in both children and adults16.
Accelerating Linear Growth in Children in Indonesia: What can be done?
Reduction of low birth weight would also reduce the incidence of stunting. This implies that short mothers should be monitored closely to make sure that they are taking their iron and vitamin supplementation, and that underweight mothers should get food supplementation that are rich in protein and lipids during the last trimester of pregnancy.
Many countries have found that stunting is associated with large families, and children that are born of young mothers. Family planning, birth spacing, encouraging mothers
not to have children until they are 21 would also reduce the risk of stunting in various communities.
Promoting hygiene at schools, promoting frequent hand washing among mothers, and better food sanitation in weaning food preparation could also reduce the risk of diarrhea, and hence promote linear growth. Cohort studies have demonstrated that after three cases of diarrhea in a year, child loose 1 centimeter of linear growth for each case of diarrhea that they have, so that every attempt to reduce childhood diarrhea should have a corresponding impact on linear growth.
Prof Bhutta from Aga Khan University reported in lancet last year the results of in-depth review of the literature on the impact of various interventions to improve maternal and child nutrition17. He reviewed the potential interventions on their ability to reduce the prevalence of student and to produce disability adjusted life years. Largest gains in Dalys’s could be generated by breastfeeding promotion, vitamin A supplementation, and zinc supplementation.
With the nice project the Ministry of Health has an opportunity to develop community nutrition programs to reduce the risk of stunting. The following section outlines some of the activities within the RFP, as well as some of the ideas found in the literature concerning the promotion of linear growth, and how they could be translated into community nutrition packages of activities. However it will be important to have a strong evaluation component to the nice project so that attribution of effect (or impact) of the various activities can be determined. NICE needs to work with WHO, UNICEF, AusAid and WFP in order to help target support for evaluation to various consortiums of national universities with support from other universities outside of Indonesia with strong evaluation of the various types of nutrition activities selected by the various villages participating in the programs.
Village level activities
children, but also pregnant mothers, fathers, and community leaders. Mothers’ nutrition needs to be considered not only during pregnancy, but also during the breast feeding period. Children of different ages should be the target of different interventions, and fathers need to be sensitized on their smoking behavior’s impact on their children’s intake of nutrient rich foods.
Some of the interventions involvement are supplemental feeding to increase caloric as well as protein, and lipid intake. Micronutrient supplementation/fortification with iron, vitamin A, vitamin D, zinc, folic acid, sprinkles for food, and multi-vitamin for pregnant women all can play an important role in the reduction of stunting, and promoting linear growth.
Some interventions should be focused on diseases, and limiting the impact of these diseases on nutrition, including promoting immunization, promoting hand washing, and the use of oral rehydration therapy for insuring that schools have adequate facilities for hand washing and fecal disposal.
There are a number of community based interventions, including growth monitoring at the Posyandu, dietary modification (promoting exclusive breast feeding for children under six months, and lipid dense diets for children under 24 months). Programs that increase household welfare and income should have an impact on stunting as should improving household and community sanitation. Intensive and well planned early child development programs linked to day care might also have a significant impact on the risk of stunting in areas.
There are a number of behavior changes that could be introduced that would have a significant impact on the risk of stunting, they include:
• Smoking reduction program for fathers
• Promotion of exclusive breast feeding
• Promotion of family planning for young mothers
• Provision of treated bed nets
• Women’s empowerment
Finally there are a number of programs that can be introduced at local health facilities (health center, hospital, sub health centers, village health post, and posyandu.
• Bidan in place to handle mothers during pregnancy, and work with nutrition kadre
To support the reduction of stunting, more research is needed to better understand the dynamics and risk patterns of stunting at the community as well as the appears to have stagnated, if fact the risk of stunting in preschool children in Indonesia is higher than Thailand (15.7%), and not that much lower than India (47.3%) or Bangladesh (48.7%), but the problem in Indonesia is compounded by the fact that many of the children that are stunted are also obese.
some approach to try and solve the problem associated with wasting in children from the semiarid regions of Alagoas, Brazil” Nut Res , 2008,;28(6)364-7.
3. Zallah MS, Tham BL “Food security and child nutritional status among Orang Asli (Temuan) household in Hulu Langat, Selangor.” Med J Malaysia, 2002, ; 57 (1):36-50.
4. Reyes H, et al. “The family as a determinant of stunting in children living in conditions of extreme poverty: a case-control study.” BMC Public Health, 2004 , 30;4:57.
5. Aerts D, Drachler Mde L Giugilani ER; “Determinants of growth retardation in Southern Brazil.” Cad Saude Publica 2004, 20(5):1182-90.
6. Kaplan RM, Toshima MT, “Does a reduced fat diet cause retardation in child growth?” Prev Med, 1992;21(1):33-52.
7. Chunming C.;“Fat inake and nutritional status of children in China” Am J Clin Nutr ,2000, 72 (5 suppl): 1368s-1372s. 8. Custodio E, et al. “Nutritional status and
its correlates in equatorial Guinean preschool children: results from a nationally representative survey “ Food Nutr Bull , 2008, 29(1):49-58. Public Health Nutr, 2008, 15:1-9.
11. Hien NN, Kam S. “Nutritional status and characteristics related to malnutiriton in children under five years of age in Nghean, Vietnam. J Prev Med Public Health, 2008;41(4):232-40.
12. Popkin BM, Richards, MK, Montiero CA “Stunting is associated with overweight in children of four nationals that are undergoing the nutrition transition. J Nutr, 1996 ;126(12):3009-16.
13. Fernald LC, Neufeld LM; “Overweight with concurrent stunting in very young children from rural Mexico: prevalence and associated factors.” Eur J Clin Nutr. 2007.;61(5):623-32 Epub 2006 Nov 29.
Appendix 1
Stunting among children < 60 months by Province, Riskesdas 2007
Province Number of
Children
Percent Stunted ( < -2 SD HAZ)
realtive risk
DI Aceh 371,648 44.6% 1.21
Sumatra Utara 1,337,114 43.1% 1.17
Sumatra Barat 528,557 36.5% 0.99
Riau 580,988 33.0% 0.90
Jambi 294,242 36.4% 0.99
Sumatra Selatan 498,160 44.7% 1.22
Bengkulu 158,392 36.0% 0.98
Lampung 698,141 38.7% 1.05
Bangka Belitung 128,584 35.5% 0.97
Kepulauan Riau 178,754 26.2% 0.71
DKI Jakarta 876,154 26.7% 0.73
Jawa Barat 4,168,425 35.5% 0.96
Jawa Tengah 2,951,077 36.5% 0.99
DI Yogyakarta 265,214 27.6% 0.75
Jawa Timur 3,189,561 34.8% 0.95
Banten 959,155 39.0% 1.06
Bali 336,689 31.0% 0.84
Nusa Tenggara Barat 473,844 43.7% 1.19
Nusa Tenggara Timur 549,718 46.8% 1.27
Kalimantan Barat 413,939 39.3% 1.07
Kalimantan Tengah 213,051 42.7% 1.16
Kalimantan Selatan 360,069 41.8% 1.14
Kalimantan Timur 345,774 35.2% 0.96
Sulawesi Utara 173,843 31.2% 0.85
Sulawesi Tengah 319,681 40.4% 1.10
Sulawesi Selatan 732,424 29.1% 0.79
Sulawesi Tenggara 252,432 40.5% 1.10
Gorontalo 109,712 39.9% 1.09
Sulawesi Barat 125,039 44.5% 1.21
Maluku 140,503 45.8% 1.25
Maluku Utara 101,266 40.2% 1.09
Papua Barat 108,119 39.4% 1.07
Papua 248,186 37.7% 1.03