NILAI TUKAR PETANI PROVINSI SULAWESI UTARA
Farmers’ Terms of Trade in North Sulawesi
2016
No. ISBN :
No. Publikasi : 71540.1702
Katalog BPS : 7102019.71
Ukuran Buku : 20,5 x 29 cm
Jumlah Halaman : x + 40 Halaman
Naskah:
Bidang Statistik Distribusi
Badan Pusat Statistik Sulawesi Utara
Penyunting:
Bidang Integrasi Pengolahan dan Diseminasi Statistik Badan Pusat Statistik Sulawesi Utara
Gambar Kulit:
Bidang Integrasi Pengolahan dan Diseminasi Statistik Badan Pusat Statistik Sulawesi Utara
Cover : "Designed by new7ducks / Freepik"
Gambar : Panen Raya oleh BPS Kabupaten Langkat
Diterbitkan oleh:
Badan Pusat Statistik Provinsi Sulawesi Utara
Dicetak oleh :
Dilarang mengumumkan, mendistribusikan, mengomunikasikan, dan/atau menggandakan sebagian atau seluruh isi buku ini untuk tujuan komersial tanpa izin tertulis dari
Badan Pusat Statistik
Prohibited to announce, distribute, communicate, and/or copy part or all of this book for commercial purpose without permission from BPS-Statistics Indonesia
KATA PENGANTAR
Publikasi Statistik Nilai Tukar Petani (NTP) merupakan hasil pengolahan dari Badan Pusat Statistik (BPS), berdasarkan hasil pencacahan oleh BPS Kabupaten di daerah perdesaan berupa laporan Statistik Harga Konsumen Perdesaan dan Statistik Harga Produsen yang dikumpulkan selama tahun 2016. Data yang disajikan meliputi :
Indeks Harga yang diterima Petani
Indeks Harga yang dibayar Petani
Nilai Tukar Petani
Nilai Tukar Usaha Pertanian
Publikasi ini juga menyajikan konsep definisi, metodologi pengumpulan data dan uraian singkat mengenai trend NTP, indeks harga yang diterima petani, dan indeks yang dibayar petani sepanjang tahun 2016. Dengan demikian para pemakai data dapat memahami dengan baik proses penghitungan NTP sebagai pengukur kemampuan nilai tukar barang-barang
(produk) yang dihasilkan petani terhadap barang/jasa yang dikonsumsi rumah tangga petani, termasuk barang dan jasa untuk memproduksi komoditas pertanian.
Kami mengharapkan saran dan kritik yang membangun dari para pengguna data untuk perbaikan dan penyempurnaan publikasi ini di waktu mendatang. Kepada semua pihak yang telah membantu diucapkan terima kasih.
Manado, Maret 2017 Kepala Badan Pusat Statistik
Provinsi Sulawesi Utara,
Moh. Edy Mahmud S.Si, M.P
PREFACE
The publication of “Farmers’ Terms of Trade (FTT) Statistics in North Sulawesi 2016” is from the processing data of the head quarter of BPS- Statistics Indonesia (BPS), based on data collection interviewed in BPS regencies, specificly in rural areas in the format of Consument Price in Rural Reports and Producers Prices Statistics Survey conducted in 2016
Farmers’ Terms of Trade in North Sulawesi covers data in 2016, in terms of:
- Prices Received by Farmers Indices
- Prices Paid by Farmers Indices
- Farmer’s Terms of Trade
- Agriculture Terms of Trade
This publication also provide the concepts and definitions, data collection method, and brief review about (FTT), prices received by farmers indices, and prices paid by farmers indices in 2016. Therefore user data can have robust comprhensions of the calculation and measurement of FTT as the indicator of goods/ services produced compare to goods/ services consumed by including goods/ services to produce the agricultural products.
To all parties who have been involved in the preparation of this publication, I would like to express my appreciation. Hopefully this publication will be useful reference for any purposes. Comments and suggestions to improve the contents of this publication are always welcomed.
Manado, March 2017 BPS Statistics - North Sulawesi
Head,
Moh. Edy Mahmud S.Si, M.P
DAFTAR ISI /
CONTENTS
Halaman / Page
Kata Pengantar / Preface ... iii
Daftar Isi / Contents ... v
Daftar Tabel / List of Tables ... vi
Daftar Grafik/ List of Graphs ... vii
Infografis NTP / FTT Infographs ... viii
1. Pendahuluan / Introduction ... 1
1.1. Latar Belakang / Background ... 1
1.2. Kegunaan / Objectives ... 2
1.3. Ruang Lingkup / Data Scope ... 3
2. Metode Pengumpulan Data / Data Collection Methodology……… ... ……….. 4
3. Konsep Defenisi / Concepts and Definitions…… ... ………. 6
4. Ulasan Ringkas / Brief review ... 10
4. 1. NTP Umum / General FTT ... 10
4. 2. NTP Subsektor Tanaman Pangan FTT of Food Crops Subsector ... ... 14
4. 3. NTP Subsektor Tanaman Hortikultura/ FTT of Horticultre Subsector ... ... ... 15
4. 4. NTP Subsektor Tanaman Perkebunan Rakyat FTT Subsector of Smallholders Estate Crops Subsector ... ... 16
4. 5. NTP Subsektor Peternakan FTT of Animal Husbandary ... ... 17
4. 6. NTP Subsektor Perikanan FTT of Fishery Subsector ... ... 18
Lampiran / Appendix…… ... ………. 23
DAFTAR TABEL /
LIST OF TABLES
Halaman / Page
1. Perkembangan Nilai Tukar Petani Provinsi Sulawesi Utara, 2008-2016
Trend of Farmer’s Term of Trade Province of North Sulawesi, 2008-2016 ... 25
2. Nilai Tukar Petani Provinsi Sulawesi Utara , 2016
Farmer’s Terms of Trade Province of North Sulawesi, 2016 ... 26
3. Nilai Tukar Petani Subsektor Tanaman Pangan Provinsi Sulawesi Utara, 2016
Farmer’s Terms of Trade of Food Crops Subsector Province of North Sulawesi, 2016 ... 28
4. Nilai Tukar Petani Subsektor Tanaman Hortikultura Provinsi of Sulawesi Utara, 2016
Farmer’s Terms of Trade of Horticulture SubsectorProvince of North Sulawesi, 2016... 30
5. Nilai Tukar Petani Subsektor Tanaman Perkebunan rakyat Provinsi Sulawesi Utara, 2016 Farmer’s Terms of Trade of Smallholders Estate Crops Subsector
Province of North Sulawesi, 2016 ... 32
6. Nilai Tukar Petani Subsektor Peternakan Provinsi Sulawesi Utara, 2016
Farmer’s Terms of Trade of Animal Husbandary Subsector of North Sulawesi, 2016 ... 34
7. Nilai Tukar Petani Subsektor Perikanan Provinsi Sulawesi Utara, 2016
Farmer’s Terms of Trade of Fishery Subsector Province of North Sulawesi, 2016 ... 36
8. Nilai Tukar Petani Subsektor Perikanan Tangkap Provinsi Sulawesi Utara, 2016
Farmers Terms of Trade of Cathing Fisheries Province of North, Sulawesi, 2016 ... 38 9. Nilai Tukar Petani Subsektor Perikanan Budidaya Provinsi Sulawesi Utara, 2016
DAFTAR GRAFIK /
LIST OF GRAPHS
Halaman / Page
1. Perkembangan Nilai Tukar PetaniProvinsi Sulawesi Utara, 2016
Trend of Farmer’s Terms of Trade Growthof North Sulawesi, 2016 ... 10
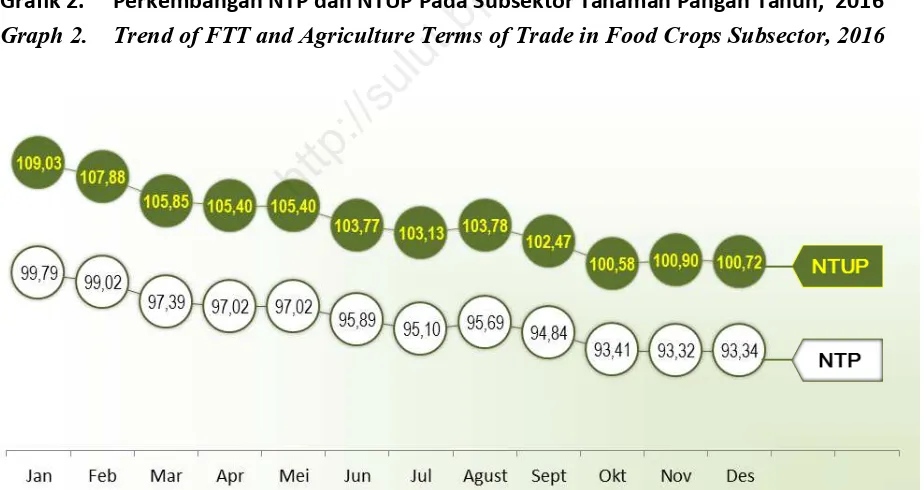
2. Perkembangan NTP dan NTUP Pada Subsektor Tanaman Panagan Tahun, 2016
Trend of FTT and Agriculture Terms of Trade in Food Crops Subsector, 2016 ... 14
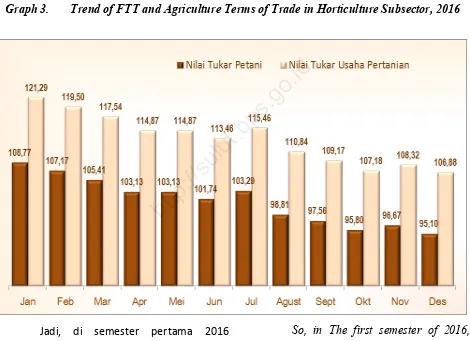
3. Perkembangan NTP dan NTUP Pada Subsektor Hortikultura, 2016
Trend of FTT and Agriculture Terms of Trade in Horticulture Subsector, 2016 ... 15
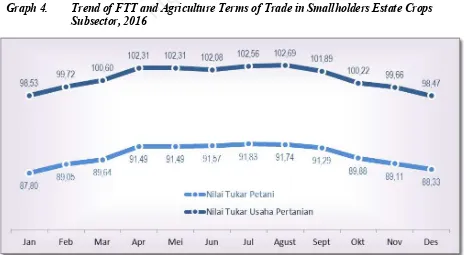
4. Perkembangan NTP dan NTUP pada Subsektor TPR, 2016
Trend of FTT and Agriculture Terms of Trade in Smallholders Estate Crops
Subsector, 2016.. ... 16
5. Perkembangan NTP dan NTUP pada Subsektor Peternakan, 2016
Trend of FTT and Agriculture Terms of Trade in Animal Husbandary Subsector, 2016.. .. .18
6. Perkembangan NTP dan NTUP pada Subsektor Perikanan, 2016
Trend of FTT and Agriculture Terms of Trade in Fishery Subsector, 2016 ... … 19
7. Perkembangan NTP dan NTUP pada Subsektor Penangkapan Ikan di Laut, 2016
Trend of FTT and Agriculture Terms of Trade for Sea Fishery Subsector, 2016 ... 20
8. Perkembangan NTP dan NTUP pada Subsektor Perikanan Budidaya, 2016
Trend of FTT and Agriculture Terms of Trade for Aquaculture Fishery Subsector, 2016 .... 21
9. Perkembangan Inflasi Pedesaan menurut Bulan di Sulawesi Utara, 2016
1.1. Latar Belakang
Salah satu tujuan pembangunan ekonomi adalah mewujudkan masyarakat yang adil, makmur dan sejahtera dalam sega-la bidang. Mengingat Indonesia adasega-lah negara agraris, dimana sekitar dua per tiga penduduk Indonesia masih menggantungkan hidupnya di sektor pertanian. Maka diharapkan sektor pertanian dapat menjadi motor penggerak pertumbuhan ekonomi yang mampu mening-katkan pendapatan petani.
Diperlukan suatu ukuran yang dapat digunakan untuk mengukur keberhasilan pembangunan di sektor pertanian, terutama terkait kesejahteraan petani. Salah satu alat ukur yang dapat dipakai adalah ukuran kese-jahteraan para petani atau Nilai Tukar Petani (NTP). NTP adalah rasio antara indeks harga yang diterima petani (It) dengan indeks harga
yang dibayar petani (Ib) dalam persentase. It
mewakili indikator pendapatan petani pro-dusen, sedangkan Ib mewakili dari sisi biaya
petani baik untuk konsumsi maupun biaya produksi.
Secara sederhana NTP mengukur kemampuan tukar barang (produk) pertanian yang dihasilkan petani dengan barang atau
1.1. Background
One of the development goals is to make the society in equitable and prosper-ous life in any kind of economic sectors. In-donesia is an agricultural country, in which two third of its citizens earn their living in agricultural sector. It is expected to be a vital sector to boost the economy growth which in turn will increase the economic income of all business sectors, especially that of farmers.
In order to examine and calculate the success of development in agriculture, especially in relationship with the welfare of farmers, a good indicator is needed to ply. One of the indicators that can be ap-plied to describe the welfare of farmers is Farmers’ Terms of Trade (FTT). FTT is a
ratio between prices received index (It) and
prices paid index (Ib) in percentage. It from
farmers is respresentative of an indicator
producers of farmers’ income and Ib is
re-spresentative an indicator to reflect the cost of farmers, either for household consump-tion or farming producconsump-tion.
Simply, FTT is a tool to measure the ability of famers in terms of exchanging products and services that are produced by
Hasil Sensus Pertanian 2013 menunjukan bahwa Sektor Pertanian masih menjadi sektor dominan dalam struktur perekonomian Sulawesi Utara setelah sektor Jasa dan Perdagangan.
Based on Agriculture Census in 2013 data show that agriculture sector still dominate the economic structure of North Sulawesi, after services and trade sectors.
jasa yang diperlukan untuk konsumsi rumah tangga dan keperluan dalam memproduksi produk pertanian.
1.2 Kegunaan
a. Indeks yang diterima petani (It) dapat
melihat fluktuasi harga barang-barang
yang dihasilkan petani. Indeks ini juga da
-pat digunakan untuk mendukung penghi-tungan pendapatan sektor pertanian. b. Dari kelompok konsumsi rumah tangga
dalam indeks harga yang dibayar petani (Ib)
dapat menggambarkan fluktuasi harga ba-rang yang dikonsumsi oleh petani, merupa-kan bagian terbesar dari masyarakat pede
-saan. Sedangkan dari kelompok biaya pro
-duksi dapat digunakan untuk melihat fluk-tuasi harga barang yang digunakan untuk memproduksi barang-barang pertanian.
c. NTP bermanfaat untuk mengukur kemam-puan tukar produk yang dijual petani dengan produk yang dibutuhkan petani dalam memproduksi. Dengan demikian, NTP dapat dipakai sebagai salah satu indi-kator dalam menilai tingkat kesejahteraan petani.
farmers, and services that are needed by farmers for household and for the produc-tion process of farming.
1.2 Objectives
a. Prices received index can reflect the
fluc-tuation of prices of products that pro-duced by farmers. This indicator can be used to calculate the total income of agri-cultural sector.
b. From the consumption of household
group in prices paid index represents the fluctuation of prices of products con-sumed by farmers which is the main part of people who are living in rural. In the other hand, production costs can be ap-plied for examining the fluctuation of prices in terms of goods that are used for the agricultural products.
c. FTT gives a benefit to measure the
capa-bility of exchange of products that are sold by farmers and product exchange that are needed by farmers in relation-ship with the production process. the ability of farmers in a base year. There-fore, the FTT can be used as an indicator in evaluating the welfare of farmers.
Kemajuan Sektor pertanian dapat dicapai jika output pertanian dapat digunakan sepenuhnya se-bagai alat tukar untuk memenuhi seluruh kebutuhan petani
The modern agriculture sector will be achieved when the output of farming can be exchanged to all the farmer’s needs.
1.3 Ruang Lingkup
Cakupan data pada publikasi ini adalah data keadaan tahun 2016 pada lima sub sektor pertanian, yaitu tanaman pangan, tanaman hortikultura, tanaman perkebunan rakyat (TPR), peternakan, dan perikanan.
2. METODE PENGUMPULAN DATA
Data NTP dihitung berdasarkan hasil pengumpulan data melalui wawancara yang diperoleh dengan menggunakan daftar HKD
-1, HKD-2.1, HKD-2.2, HD-1, HD-2, HD-3, HD-4,
The scope of data in this publication is in the time frame 2016 in the five agricul-tural sub sectors, such as, Food Crops, Hor-ticulture, Smallholders Plantation Estate Crops, Animal Husbandry, and Fisheries sub sector.
2. DATA COLLECTION METHODOLOGY
FTT indicator is calculated by the data collection from data field work/interview to farmers by using eight types of
question-Suatu kondisi anomali terjadi di Sulawesi Utara, Struktur pereko
-nomian Sulawesi Utara didominasi Sektor Pertanian, namun keadaan kesejahteraan petaninya diindikasikan masih belum sejahtera.
An anomaly condition occurred in North Sulawesi, where agriculture is a sector that dominates economic structure of North Sulawesi, while the welfare of farmers is indicated far from the prosperity
b. Daftar HKD-2.1 digunakan untuk mencatat
harga yang dibayar oleh konsumen perdesaan kelompok konstruksi, jasa, dan transportasi.
c. Daftar HKD-2.2 digunakan untuk mencatat
harga yang dibayar oleh konsumen perdesaan kelompok aneka perlengkapan rumah tangga dan lainnya.
d. HD-1 digunakan untuk mencatat harga
produsen yang diterima petani dan harga yang dibayar petani untuk keperluan biaya produksi pada subsektor tanaman pangan. e. HD-2 digunakan untuk mencatat harga
produsen yang diterima petani dan harga yang dibayar petani untuk keperluan biaya produksi untuk subsektor hortikultura. f. HD-3 digunakan untuk mencatat harga
pro-dusen yang diterima petani dan harga yang dibayar petani untuk keperluan biaya produksi untuk subsektor tanaman perke-bunan rakyat.
g. HD-4 digunakan untuk mencatat harga
pro-dusen yang diterima petani dan harga yang dibayar petani untuk keperluan biaya produksi untuk subsektor peternakan. h. HD-5.1 digunakan untuk mencatat harga
produsen yang diterima petani dan harga yang dibayar petani untuk keperluan biaya produksi untuk subsektor perikanan tangkap.
b. HKD-2.1 questionnaire is applied to
rec-ord paid prices of consumers in rural ar-ea for cost of constructions, services, and transportation.
c. HKD-2.2 questionnaire is used to record
paid prices of consumers in rural area for households supplies and others.
d. HD-1 is used for recording producer
prices that come from farmers and costs for agricultural production process in relationship with sub sector of Food Crops.
e. HD-2 is used for recording producer
prices that come from farmers and costs for production processes in horticulture crops.
f. HD-3 is applied to record producer
pric-es that are made of farmers from their agricultural business and all of costs that they spent for production process of Smallholders Estate Crops sub sector.
g. HD-4 is used for getting information of
producer prices that achieved from farm-ers and paid prices of goods and services for production process of animal hus-bandry sub sector.
h. HD-5.1 is used for getting information of
producer prices that are produced by farmers and all of costs that spent for ag-ricultural production process in fisheries sub sector.
i. HD-5.2 digunakan untuk mencatat harga
produsen yang diterima petani dan harga yang dibayar petani untuk keperluan biaya produksi untuk subsektor perikanan budi daya.
3. KONSEP DAN DEFINISI
Beberapa konsep dan definisi yang di-pergunakan dalam perhitungan NTP antara lain:
a.Nilai Tukar Petani adalah angka per-bandingan antara indeks harga yang diterima (It) dan dibayar (Ib) petani. Indeks harga yang diterima petani adalah indeks harga yang menunjukkan perkembangan harga produsen atas hasil produksi petani.
Indeks harga yang dibayar petani adalah indeks harga yang menunjukkan perkem-bangan harga kebutuhan rumah tangga petani, baik itu kebutuhan untuk konsumsi rumah tangga maupun kebutuhan untuk proses produksi pertanian.
b.Petani adalah orang yang mengusahakan usaha pertanian (tanaman pangan, tana-man hortikultura, tanatana-man perkebunan rakyat, peternakan, dan perikanan) atas resiko sendiri dengan tujuan untuk dijual, baik sebagai petani penggarap (sewa/
i. HD-5.2 is used for getting information of
producer prices that are produced by farmers and all of costs that spent for ag-ricultural production process in aquacul-ture sub sector.
3. CONCEPTS AND DEFINITIONS Some concepts and definitions used in the FTT are:
a.Farmers’ Terms of Trade is the ratio
be-tween indices of prices received and pric-es paid by farmers that is counted in per-centage. Index of prices received is prices index that shows the progress of producer prices related with the agricultural prod-ucts. Meanwhile, index of prices paid by farmers are prices index that indicate the progress of prices of house hold need for farmers, either for needs of household cconsumption or needs for agricultural production process.
b.Farmers are people who are working in
agricultural sector ( in the sub sector of food crops, horticulture,Smallholders Plantation Estate Crops, Animal Hus-bandry, and Fisheries) and responsible of risks that may come from farming. More over, the agricultural outputs are for
NTP dapat dijadikan sebagai proxy indikator untuk mengukur tingkat kesejahteraan petani
kontrak/bagi hasil). Orang yang bekerja di sawah/ladang orang lain dengan mengharapkan upah (buruh tani) bukan termasuk petani.
c. Harga yang diterima petani adalah rata
-rata harga produsen dari hasil produksi petani sebelum ditambahkan biaya transportasi / pengangkutan dan biaya pengepakan ke dalam harga penjualannya atau disebut Farm Gate (harga di sawah/ ladang setelah pemetikan). Harga rata
-rata adalah harga yang bila dikalikan dengan volume penjualan petani akan mencerminkan total uang diterima petani tersebut.
d. Harga yang dibayarkan petani adalah rata
-rata harga eceran barang/jasa yang dikonsumsi atau dibeli petani, baik untuk memenuhi kebutuhan rumah tagganya sendiri maupun untuk keperluan biaya produksi pertanian.
e. Pasar adalah tempat terjadinya transaksi antara penjual dan pembeli atau pertemuan antara penawaran dan per-mintaan. Pada kecamatan yang sudah ter-pilih sebagai sampel, pasar yang dicatat haruslah pasar yang cukup mewakili dengan syarat antara lain: paling besar, banyak pembeli dan penjual, jenis barang
saled, either as tenant farmers (rented/ contract/ profit sharing). People working in the fields of others and expecting wages (hodge) are not including farmers.
c.Prices received by farmers are the
average of producer prices from farmers’ products before the added cost of transportation/ transport and packaging costs into sales prices or Farm Gate (the prices when sold in the paddy field/ field after harvesting). Average prices is the prices when multiplied by the volume of farm sales will reflect the total money received by farmers.
d.Prices paid by farmers is the average
retail prices of goods/services consumed or purchased by farmers, both to meet needs of their own house household or for the purposes of agricultural production costs.
e.The market is a place where the
yang diperjualbelikan cukup banyak dan terjamin kelangsungan pencatatan har-ganya, serta terletak didaerah pedesaan.
f. Harga eceran pedesaan adalah harga transaksi antara penjual dan pembeli secara eceran dipasar setempat untuk tiap jenis barang yang dibeli dengan tujuan kepada pihak lain. Harga yang dicatat ada-lah harga modus (yang terbanyak muncul) atau harga rata-rata biasa dari beberapa
pedagang/penjual yang memberikan datanya.
Arti angka NTP
Secara umum ada tiga macam pengertian NTP, yaitu:
a. NTP > 100, berarti petani mengalami sur-plus. Harga komoditas pertanian naik lebih besar dari kenaikan harga barang/jasa kon-sumsi dan biaya produksi. Pendapatan petani naik lebih besar dari penge-luarannya dengan demikian dapat diindi-kasikan bahwa tingkat kesejahteraan petani lebih baik dibandingkan dengan tingkat kesejahteraan petani pada periode tahun dasar.
is relatively in a big amount, and reliable in continuity of recording prices. In addition, the market lies in rural areas.
f. Rural retail price is the price of
transac-tions between sellers and buyers in the local retail market for each type of goods purchased with the purpose to other par-ties. Price recorded is the price mode (which most appear) or the average price of some vendors/sellers who provide the data.
The Meaning of FTT
In general there are three kinds if FTT:
a. FTT > 100, it means that farmers get
surplus. The price of agricultural com-modities increase faster than the increase in prices of goods/services for consump-tion and producconsump-tion costs. Farmers’ in-come increase faster than their expendi-ture, and consequently the level of farm-ers’ welfare is better than the base year period.
Stabilitas harga komoditi hasil pertanian yang diperoleh petani dan harga komoditi yang dikeluar-kan petani untuk rumah tangganya serta usaha pertanian mempengaruhi pergeradikeluar-kan NTP The stability of commodity prices from farming products that are accepted by farmers and
a. NTP = 100, berarti petani mengalami im-pas/break even. Kenaikan/penurunan har-ga komoditas pertanian sama denhar-gan per-sentase kenaikan/penurunan harga ba-rang/jasa konsumsi dan biaya produksi. Tingkat kesejahteraan petani tidak men-galami perubahan.
b. NTP < 100, berarti petani mengalami defisit. Kenaikan harga komoditas per-tanian relatif lebih kecil dibandingkan dengan kenaikan harga barang/jasa kon-sumsi dan biaya produksi. Tingkat kese-jahteraan petani pada suatu periode men-galami penurunan dibanding tingkat kese-jahteraan petani pada periode tahun da-sar.
b. FTT = 100, it means that farmers run
into a breakeven. The increase/decrease in the price of agricultural commodities is equal to the percentage of prices in-crease/decrease of goods/services for consumption and production costs. Therefore it will be indicated that farm-ers’ welfare remains the same.
c. FTT < 100, it means that farmers are
deficit. The increase in the price of agri-cultural commodities is relatively small compared to the increase in prices of goods/services for consumption and pro-duction costs. Farmers’s welfare is lower than the base year period.
4. ULASAN SINGKAT / A BRIEF ANALYSIS
4. 1 NTP Umum
Pergerakan NTP Provinsi Sulawesi Utara pada periode Januari - Desember 2016
cenderung melesu dimana nilai tukar petani selalu berada di bawah seratus setiap bu-lannya dan trendnya menurun. Diawali dengan nilai 97,69 di bulan Januari dan di-akhiri pada nilai 93,94 pada bulan Desember. Perubahan cenderung menurun dimulai dari awal tahun 2016 hingga di akhir tahun, na-mun bulan April dan Juni 2016 nilai NTP Sula-wesi Utara sempat naik menjadi 97,14 dan 97,00, selain dari bulan-bulan tersebut nilai
NTP mengalami penurunan. Begitupun dengan Nilai Tukar Usaha Pertanian (NTUP) mengalami trend penurunan yang sama dengan NTP. Kondisi ini perlu mendapat per-hatian semua pihak, khususnya pemerintah daerah Sulawesi Utara.
NTP Provinsi Sulawesi Utara di sepan-jang tahun 2016 setiap bulannya selalu be-rada di bawah angka 100, artinya bahwa sela-ma bulan Januari hingga Desember tahun 2016 umumnya petani di Sulawesi Utara mempunyai kehidupan yang kurang baik dibandingkan dengan kondisi sebelumnya di tahun dasarnya, yakni tahun 2012. Dengan kata lain petani di Sulawesi Utara di tahun 2016 memiliki kemampuan daya beli yang
4. SHORT ANALYSIS 4.1 General FTT
The movement of FTT in North Sula-wesi during the period of January to De-cember 2016, tends to dramatically de-crease each month, by showing the point at 97.69 in the beginning of 2016 and end up with decreasingly point at 93.94 in Decem-ber 2016. Insignificantly Changes started from the first quarter to the end of the year 2016, in April and June 2016, by showing the decreasing of FTT each 97.14 and 97.00. The fluctuation of Agriculture Terms of Trade (ATT) tends to seems to be in-crease slowly at the 2016. This figures need to be concerned by government and all stakeholders.
kurang baik dibandingkan keadaan petani di tahun dasarnya (2012).
Penurunan nilai tukar petani disebabkan peningkatan harga-harga
komodi-ti hasil pertanian yang diusahakan petani komodi- tid-ak dapat melampaui kenaikan harga-harga
komoditi yang dibutuhkan oleh petani untuk konsumsi rumah tangganya dan biaya produksi dan penambahan barang modal di pertanian. Hal ini terlihat dari pergerakan in-deks yang diterima petani, yang bersumber dari harga produk pertanian yang dihasilkan (It), bergerak di bawah pergerakan indeks
yang dibayarkan petani, yang bersumber dari harga komoditi pengeluaran rumah tangga petani dan biaya produksi dan penambahan barang modal petani (Ib).
Sepanjang tahun 2016, It menunjukkan
pola yang berfluktuasi, berada pada range
family and all of the cost for farming activi-ties compared to the base year (2012).
The decline of FTT figure majorly caused the increasing of prices from agri-culture commodities that farmers produce from their field cannot reach more than prices from commodities needed by farmers for the household consumption and produc-tion costs and the capital added goods for the agriculture sector. The fluctuation is ex-amined by the movement of the received
in-dex by the farmers (It), tends to move slower
than the paid index by the farmers (Ib),
which is calculated by commodity prices of households needs and production costs and capital added goods of the farmers.
In the year 2016, the It shows a
fluc-tuating pattern in the range between 116.61
Grafik 1 Perkembangan NTP Sulawesi Utara, 2016 Graph 1. Trend FTT of North Sulawesi Province, 2016
Ja
April Mei Juni Juli Agu
antara 116,61 sampai dengan 120,26 dan rata
-rata pergerakan setahun sebesar 118,88.
Memasuki triwulan pertama (Januari-Maret),
nilai It terus turun, dan memasuki triwulan
kedua di bulan April,mengalami fluktuasi naik turun. Indeks ini mengalami peningkatan pa-da awal triwulan ketiga, di bulan Juni yakni sebesar 119,76; Bulan Juli, indeks ini terus mengalami peningkatan sebesar 0,02 persen namun kembali turun di bulan berikutnya hingga diakhiri di Bulan Desember dengan penurunan sebesar 2,65 persen.
Hasil pola persebaran indeks yang diterima petani (It) seperti yang disebutkan
sebelumnya dapat disimpulkan bahwa output petani yang dikonversikan pada harga-harga
komoditi yang diterima petani dari penjualan produk pertaniannya relatif mengalami fluk-tuasi yang tidak tinggi. Hanya saja ketika me-masuki triwulan satu dan triwulan dua tahun 2016, kemampuan daya jual atas hasil usa-hanya mengalami penurunan, tapi memasuki Triwulan 3 dan triwulan 4 kemampuan daya jual atas hasil usahanya terus mengalami penurunan.
Berbeda dengan It, Ib menunjukkan
fluk-tuasi yang cukup menarik dari bulan ke bulan. Di mulai dengan nilai 123,11 di bulan Januari, indeks It mengalami peningkatan secara pasti
hampir di semua bulan, hingga ditutup dengan nilai 124,14 di bulan Desember.
and 120.26 with the moving average in one year is 118.88. In the beginning of first
quarter (January-March), the It showed a
decline. Moreover, in the beginning of sec-ond quarter in April, it that fluctuating back same with quarter previously. This index had increased in the third quarter, starting from June at 119.76; On July, this index keep increased 0.02 percents and decrease again in the next month and decreased until in the end of 2016. On december, the index showing decreasing at 2.65 percent.
According to the distribustion of
price received index (It) as mentioned in the
previous section, it can be conluded that the output of farmers converted by commodity prices accepted from the agricultural prod-uct market is slightly flprod-uctuated. However, in the beginning of the last first quarterand second quarter of 2016, the market power of farmers for the agricultural production is showing declining performance but begin-ning of third quarter and four quarter the market power of farmers for the agricultural production is showing increase.
In contrast to the It, the Ib shows a
pretty interesting fluctuations from month to month. Started from 123.11 in the first quarter in January, this index steadily in-crease every month until in the end of year, this index stop at 124.14.
Indeks Ib terbesar di sepanjang tahun
2016 berada di bulan November sebesar 124,28. Pergerakan perubahan indeks ini lebih disebabkan pada pergerakan indeks har-ga konsumsi rumah tanghar-ga dan Biaya Produksi dan Penambahan Barang Modal (BPPBM) yang dikeluarkan oleh petani. Sama halnya indeks Ib, indeks konsumsi rumah
tangga dan BPPBM yang tertinggi terjadi di bulan November, dengan besar indeks masing
-masing sebesar 128,76 untuk indeks
konsum-si rumah tangga dan 112,23 untuk BPPBM. Jika ditelusuri pada seluruh subsektor pada Sektor Pertanian, Subsektor Peternakan yang memiliki NTP yang selalu diatas 100 sepanjang tahun 2016. Hal ini diindikasikan bahwa petani yang berada pada sub sektor peternakan memiliki keadaan kesejahteraan yang lebih baik dibandingkan dengan petani yang berada di sub sektor lainnya.
The biggest index of Ib in the year of
2016 is in December, at 124.28. The index movement is caused on the fluctuation of consumption index of household and cost of production and capital formation spent by
farmers. Sinlarly with index Ib, the highest
index within consumption index of house hold and cost of production and capital for-mation spent index is occurred in Novem-ber, at 128.76 for consumption index and 112,23 for cost of production and capital formation spent index.
The FTT index based on sub sectors of agriculture shows that Sub sectors of hor-ticulture and fishery have the index higher than 100 in the year 2016. This condition can be indicated that farmers working in sub sectors of horticulture and fishery have a better life in terms of welfare compare to the other farmers who are working in other agriculture sub sectors.
NTP menunjukkan pergerakan yang lambat dan selalu berada di bawah seratus. Kondisi ini seharusnya perlu mendapat perhatian dari Pemda dan stakeholder terkait, khususnya dalam peningkatan kesejahteraan petani.
FTT of North Sulawesi in 2016 tends to the slowly improvement and the figures are always below 100 point. This condition must be a strategic and focus issue for regional government and other stakeholders to push and increase the welfare of farmers.
4.2. NTP Sub sektor
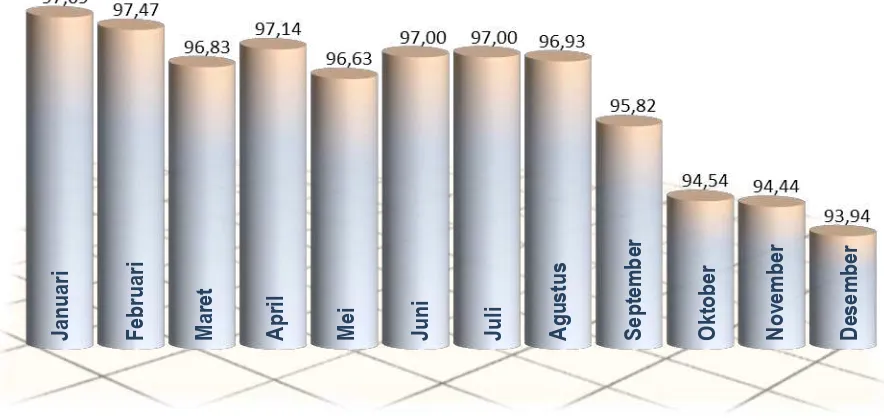
NTP Subsektor Tanaman Pangan
Grafik 2 di bawah menunjukkan perge-rakan NTP tanaman pangan yang cenderung menurun di sepanjang tahun 2016, dimulai dari 99,79 di bulan Januari kemudian turun di bulan Februari dan bulan Maret dengan nilai masing-masing sebesar 99,02 dan 97,39.
Kemudian nilai ini menurun hingga di bulan Juli pada nilai 95,10. Namun nilai ini kembali meningkat di bulan Agustus, sebesar 95,69 hingga ditutup di bulan Desember pada nilai 95,98.
4.2. Sub Sector FTT
FTT for Food Crops Subsector
Chart 2 below shows the movement
of FTT which is tends to decrease during the
year 2016, started from 99.79 in January,
the figure incline in February and March,
respectively 99.02 and 97.39. The figures
remain decline each month to July at the
point 95.10. However, this point incline in
August, at 95.69 until in the end of year,
De-cember, stop at 95.98.
Grafik 2. Perkembangan NTP dan NTUP Pada Subsektor Tanaman Pangan Tahun, 2016 Graph 2. Trend of FTT and Agriculture Terms of Trade in Food Crops Subsector, 2016
NTP Sub Sektor Tanaman Hortikultura
Sama halnya dengan sektor tana-man pangan, NTP subsektor tanatana-man hor-tikultura juga mengalami trend menurun, kecuali dipertengahan tahun pada bulan Juli yang sempat membaik. NTP di awal tahun sampai pertengahan sempat berada di level diatas 100 tapi terus menurun hingga 95,10 diakhir tahun.
Jadi, di semester pertama 2016 keadaan NTP mengindikasikan bahwa output yang dihasilkan petani dari komoditi yang di-usahakannya dalam bentuk harga telah dapat memenuhi seluruh pengeluaran rumah tang-ga petani untuk kebutuhan seluruh anggota
FTT for Horticulture Subsector
As well as horticultural crops sub
-sector, horticultural crops subsector FTT also experienced a decline trend, except for
mid-year in July, which had improved. FTT
at the beginning of the year until mid-could
be at the level above 100 but continued to decline until the end of the year 95.10.
So, in The first semester of 2016, FTT situation describes that output pro-duced by farmers for commodities occupied and conversed to prices already satisfied all of expenses of household members and all expenses for agriculture. Therefore, the Farmers’ Terms of Trade in this subsector Grafik 3. Perkembangan NTP dan NTUP Pada Subsektor Hortikultura, 2016
Graph 3. Trend of FTT and Agriculture Terms of Trade in Horticulture Subsector, 2016
ini mengakibatkan nilai tukar petani di sub-sektor ini selalu berada di atas 100 setiap bu-lannya. Besarnya niai tukar petani di atas 100 sejak bulan januari hingga juli 2016 mengindi-kasikan bahwa keadaan kesejahteraan petani di subsektor ini lebih baik dibandingkan dengan keadaan petani pada tahun dasarnya, 2012.
NTP Subsektor Tanaman Perkebunan Rakyat (TPR)
Subsektor ini memiliki NTP yang pal-ing kecil jika dibandpal-ingkan dengan sektor
-sektor lainnya, karena NTPnya menyentuh angka 87,80. Sempat menunjukan gejala membaik di semester pertama, tapi kemudian NTPnya terjerembab kembali dan cenderung menurun sampai dengan akhir tahun.
are always above 100 each month. The val-ue of FTT which is more than 100 indicates that the condition of farmer family welfare in this subsector is than the condition of farmer family in the base year of 2012.
FTT for Smallholders Estate Crops Subsector
This subsector has the most small in FTT when compared to other sectors, cause the FTT reach to 87.80. It had showing signs of improving in the first semester, and then FTT falling back and trend to decline until the end of the year.
Grafik 4. Perkembangan NTP dan NTUP pada Subsektor TPR, 2016
Graph 4. Trend of FTT and Agriculture Terms of Trade in Smallholders Estate Crops
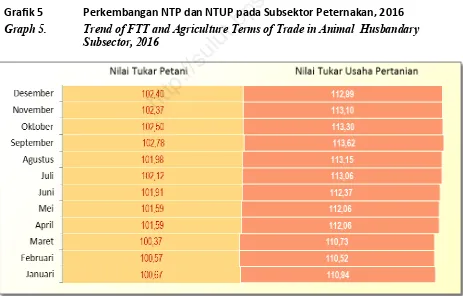
The FTT of Animal Husbandary Subsector
The value of FTT on subsector of animal husbandary steadily fluctuated in the whole months of 2016. When the number of FTT above 100, the values of farmer’s terms of trade from January to April are higher than point 100, started from 100.67 in Janu-ary,and keep decline to 100.37 on March. Enter April FTT incline in value 101.59. The Figures FTT increased on July is above 102 , at value 102.12 and keep incline every month to December 102.40.
NTP Subsektor Peternakan
Nilai NTP sub sektor peternakan men-galami perubahan naik dan turun di sepan-jang tahun 2016. Pada keadaan angka diatas 100, NTP di bulan Januari sampai dengan bulan Maret berada di nilai 100, bermula dari nilai 100,67 di bulan Januari dan terus turun menjadi 100,37 sampai bulan Maret. Memasuki Bulan April Nilai tukar petani men-galami kenaikan dengan angka 101,59. Dan Pada Bulan Juli nilai tukar petani meningkat berada di nilai di atas 102, yaitu sebesar 102,12 dan terus meningkat sampai akhir ta-hun 2016 di bulan Desember sebesar 102,40.
Grafik 5 Perkembangan NTP dan NTUP pada Subsektor Peternakan, 2016
Graph 5. Trend of FTT and Agriculture Terms of Trade in Animal Husbandary
Subsector, 2016
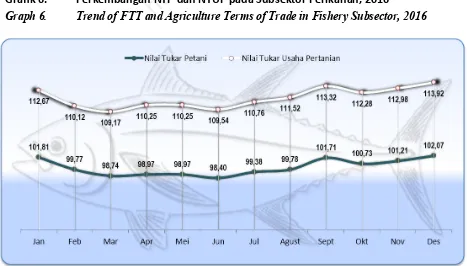
NTP Sub Sektor Perikanan
Pergerakan NTP subsektor perikanan di sepanjang tahun 2016 menunjukkan perge-rakan yang lebih baik dibandingkan dengan tahun sebelumnya. Walaupun pergerakan NTP subsektor ini sangat berfluktuasi setiap bulannya, akan tetapi nilai tukar petaninya masih bergerak pada nilai di atas 100. Berge-rak dari nilai 101,81 di bulan Januari dan menurun sampai bulan Agustus 99,78, naik lagi di bulan September dengan nilai 101,71; Angka ini berfluktuasi sampai bulan Desem-ber dengan nilai 102,07.
Semenjak tahun 2016, subsektor peri-kanan diklasifikasikan lagi menjadi dua sub-sektor, yakni subsektor perikanan tangkap, dan subsektor perikanan budi daya.
FTT of Fisheries Subsector
The FTT of subsector fishery in 2016
shows a better movement than previous
years. Even though the moving figures of
this FTT is quite fluctuated each month, the
FTT is still flowing at the point above 100.
Started from 101.81 on January, and
de-crease to August at 99.78, this figure is
in-cline in September, at 101.71, and
fluctuat-ing to December at 102.07.
In the beginning of 2016, subsector of fishery is devided to be two groups, sub-sector of fishing and subsub-sector of aquacul-ture.
Grafik 6. Perkembangan NTP dan NTUP pada Subsektor Perikanan, 2016
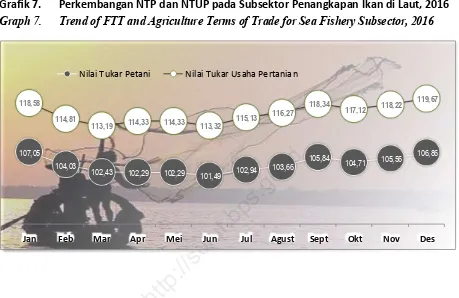
Pembagian kelompok subsektor ini dilakukan untuk membedakan indikator kesejahteraan petani di subsektor perikanan yang lebih sepesifk antara nelayan yang menangkap ikan dan petani yang membudidayakan perikanan.
Dari hasil perhitungan NTP, diperoleh bahwa keadaan nilai tukar petani di subsektor penangkapan ikan lebih baik dibandingkan petani yang melakukan budidaya perikanan. Walau pergerakan NTP penangkapan laut ber-gerak naik turun, nilai tersebut masih berada di atas seratus, dimana bulan Januari NTPnya sebesar 107,05 dan bulan Desember berakhir di nilai 106,86. Di sisi lain, NTP subsektor budidaya secara umum berada di bawah nilai 100. NTP terendah terjadi di bulan Maret,
The separately division of fishery subsector was made to distinguish the wel-fare indicator specifically between sea fish-ery and aquaculture fishfish-ery.
Based on the formula calculation of FTT, the condition of farmer welfare shows that the performance of sea fishery from FTT is better than aquaculture fishery. Even though the FTT movement of sea fishery ir-relatively fluctuated irregularly to be ups and down. the figure of FTT each month is still above 100, where the FTT in January is at 107.05, and at the end of December 2016 will be closed at 108.86. On the other hand, FTT of aquculture fishery in general is be-low 100. The be-lowest FTT occurred in
107,05
104,03
102,43 102,29 102,29 101,49 102,94 103,66
105,84
104,71 105,56
106,86
118,58
114,81
113,19 114,33 114,33 113,32 115,13
116,27
118,34
117,12 118,22
119,67
Jan Feb Mar Apr Mei Jun Jul Agust Sept Okt Nov Des
Nilai Tukar Petani Nilai Tukar Usaha Pertanian
Grafik 7. Perkembangan NTP dan NTUP pada Subsektor Penangkapan Ikan di Laut, 2016 Graph 7. Trend of FTT and Agriculture Terms of Trade for Sea Fishery Subsector, 2016
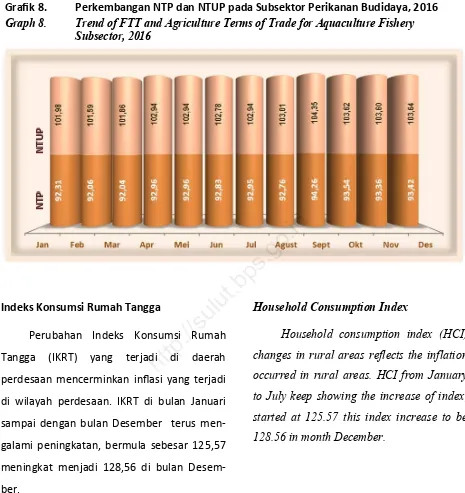
bulan September, sebesar 94,26.
Indeks Konsumsi Rumah Tangga
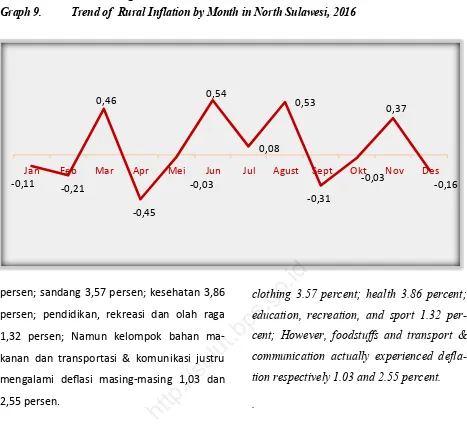
Perubahan Indeks Konsumsi Rumah Tangga (IKRT) yang terjadi di daerah perdesaan mencerminkan inflasi yang terjadi di wilayah perdesaan. IKRT di bulan Januari sampai dengan bulan Desember terus men-galami peningkatan, bermula sebesar 125,57 meningkat menjadi 128,56 di bulan Desem-ber.
Selama tahun 2016 terjadi kenaikan IKRT secara tahun kalender sebesar 0,66 per-sen. Kenaikan tersebut terutama dipicu oleh naiknya harga-harga komoditi pada kelompok
makanan jadi 5,71 persen; perumahan 1,42
March, at 92.04 and the highest FTT is at 94,26 in September.
Household Consumption Index
Household consumption index (HCI) changes in rural areas reflects the inflation occurred in rural areas. HCI from January to July keep showing the increase of index, started at 125.57 this index increase to be 128.56 in month December.
During 2016, the increase of HCI per year reached at 0.66 percent. The increase was mainly fuelled by the increase in all in-dex of expenditure group, i.e. prepared food 5.71 percent ; housing 1.42 percent; Grafik 8. Perkembangan NTP dan NTUP pada Subsektor Perikanan Budidaya, 2016
Graph 8. Trend of FTT and Agriculture Terms of Trade for Aquaculture Fishery
persen; sandang 3,57 persen; kesehatan 3,86 persen; pendidikan, rekreasi dan olah raga 1,32 persen; Namun kelompok bahan ma-kanan dan transportasi & komunikasi justru mengalami deflasi masing-masing 1,03 dan
2,55 persen.
clothing 3.57 percent; health 3.86 percent; education, recreation, and sport 1.32 per-cent; However, foodstuffs and transport & communication actually experienced defla-tion respectively 1.03 and 2.55 percent.
.
-0,11
-0,21 0,46
-0,45
-0,03 0,54
0,08
0,53
-0,31
-0,03 0,37
-0,16
Jan Feb Mar Apr Mei Jun Jul Agust Sept Okt Nov Des
Grafik 9. Perkembangan Inflasi Pedesaan menurut Bulan di Sulawesi Utara, 2016
Graph 9. Trend of Rural Inflation by Month in North Sulawesi, 2016
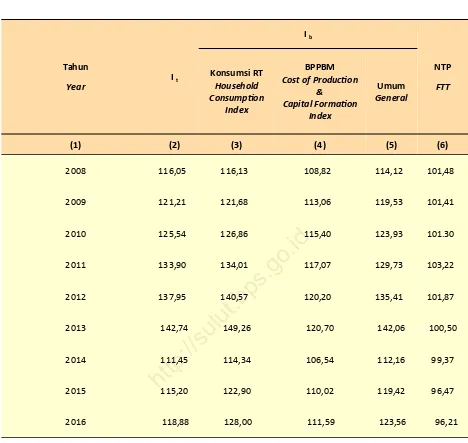
Perkembangan Nilai Tukar Petani Provinsi Sulawesi Utara, 2008 – 2016
Trend of Farmers’ Term Trade Province of North Sulawesi, 2008 – 2016
Tahun
Year I t
I b
NTP
FTT
Konsumsi RT
Household Consumption
Index
BPPBM
Cost of Production &
Capital Formation Index
Umum
General
(1) (2) (3) (4) (5) (6)
2008 116,05 116,13 108,82 114,12 101,48
2009 121,21 121,68 113,06 119,53 101,41
2010 125,54 126,86 115,40 123,93 101.30
2011 133,90 134,01 117,07 129,73 103,22
2012 137,95 140,57 120,20 135,41 101,87
2013 142,74 149,26 120,70 142,06 100,50
2014 111,45 114,34 106,54 112,16 99,37
2015 115,20 122,90 110,02 119,42 96,47
2016 118,88 128,00 111,59 123,56 96,21
Keterangan : 2008-2013 menggunakan tahun dasar 2007
2014 - 2016 menggunakan tahun dasar 2012
Tabel
Table 1.
Rincian Jan Feb Mar Apr Mei Jun
(1) (2) (3) (4) (5) (6) (7)
Indeks Diterima Petani / Price Received by Farmers
Index 120,26 119,83 119,53 119,38 118,78 119,76
Indeks Dibayar Petani/Price Paid by Farmers Index 123,11 122,94 123,44 122,90 122,92 123,46
Konsumsi Rumah Tangga/Household Consumption 127,57 127,29 127,88 127,30 127,26 127,95
Bahan Makanan/Food Stuff 139,31 138,31 139,42 138,59 138,07 139,21
Makanan Jadi/Prepared Food 119,01 119,35 119,79 119,72 120,57 121,80
Perumahan/Housing 118,73 119,20 119,23 119,28 119,31 119,35
Sandang/Clothing 111,25 111,64 111,64 111,68 112,27 112,32
Kesehatan/Health 113,98 114,73 115,11 115,34 116,21 116,28
Pendidikan,Rekreasi&Olah raga/
Education,Recreation&Sport 106,71 106,97 107,03 107,03 107,23 107,26
Transportasi dan Komunikasi
Transportation & Communication 128,25 127,91 127,99 125,79 125,42 125,29
BPPBM 110,96 111,04 111,38 111,02 111,25 111,37
Bibit/Seed 110,59 110,87 110,77 110,53 110,10 110,64
Obat-obatan & Pupuk/Fertilizer&Drugs 108,20 108,19 108,55 108,55 108,54 108,57
Sewa Lahan, Pajak & Lainnya
Rental Cost&Other 108,04 108,06 108,31 108,60 108,61 108,60
Transportasi/Transportation 126,08 125,57 125,45 120,89 120,79 120,82
Penambahan Barang Modal
Additional Capital Goods 107,88 107,86 108,17 108,36 108,26 108,74
Upah Buruh Tani/Wages of Farm Labour 111,70 112,05 112,85 113,03 113,84 114,00
Nilai Tukar Petani/Farmers’ Terms of Trade 97,69 97,47 96,83 97,14 96,63 97,00
Nilai Tukar Usaha Petani/Farmers’ Bussiness
Terms of Trade 108,38 107,92 107,31 107,53 106,78 107,54
Nilai Tukar Petani menurut Bulan di Provinsi Sulawesi Utara, 2016
Farmers’ Term of Trade Province by Month at North Sulawesi Province, 2016
Tabel
Table 2.
Rincian Jul Ags Sep Okt Nov Des
(1) (8) (9) (10) (11) (12) (13)
Indeks Diterima Petani / Price Received by
Farm-ers Index 119,78 119,39 118,73 117,13 117,37 116,61
Indeks Dibayar Petani/Price Paid by Farmers Index 123,58 124,15 123,90 123,90 124,28 124,14
Konsumsi Rumah Tangga/Household Consumption 128,05 128,73 128,33 128,29 128,76 128,56
Bahan Makanan/Food Stuff 138,84 139,91 138,67 138,18 138,96 138,45
Makanan Jadi/Prepared Food 122,74 123,43 124,19 124,64 125,04 124,84
Perumahan/Housing 119,45 119,57 119,55 119,78 120,09 120,10
Sandang/Clothing 112,43 112,55 112,71 113,08 113,23 114,33
Kesehatan/Health 116,76 116,93 117,10 117,86 117,97 117,71
Pendidikan,Rekreasi&Olah raga/
Education,Recreation&Sport 107,31 107,67 107,67 107,68 107,71 107,72
Transportasi dan Komunikasi
Transportation & Communication 126,00 126,51 126,63 126,66 126,72 126,74
BPPBM 111,58 111,88 112,01 112,13 112,22 112,23
Bibit/Seed 110,65 110,58 110,87 111,08 111,00 111,20
Obat-obatan & Pupuk/Fertilizer&Drugs 108,62 108,63 108,75 108,54 108,72 108,77
Sewa Lahan, Pajak & Lainnya
Rental Cost&Other 108,65 108,71 108,84 108,74 108,87 108,89
Transportasi/Transportation 120,88 120,86 120,97 121,04 121,25 121,40
Penambahan Barang Modal
Additional Capital Goods 108,74 109,18 109,78 110,15 110,05 109,69
Upah Buruh Tani/Wages of Farm Labour 114,00 114,33 115,21 115,51 115,51 115,67
Nilai Tukar Petani/Farmers’ Terms of Trade 97,00 96,93 95,82 94,54 94,44 93,94
Nilai Tukar Usaha Petani/Farmers’ Bussiness
Terms of Trade 107,54 107,35 106,00 104,46 104,59 103,91
Lanjutan Tabel 2. / Continued of Table 2.
Rincian / Details Jan Feb Mar Apr Mei Jun
(1) (2) (3) (4) (5) (6) (7)
Indeks Diterima Petani/Price Received by Farmers
Index 124,23 123,16 121,65 120,82 120,82 119,44
Padi/Paddy 120,13 119,78 120,21 121,41 121,41 121,43
Palawija/Secondary Crops 128,61 126,77 123,19 120,18 120,18 117,31
Indeks Dibayar Petani/Price Paidby Farmers Index 124,49 124,38 124,91 124,52 124,52 124,55
Konsumsi Rumah Tangga/Household Consumption 127,56 127,35 127,82 127,41 127,41 127,31
Bahan Makanan/Food Stuff 139,97 139,04 139,91 139,45 139,45 138,67
Makanan Jadi/Prepared Food 119,26 119,53 119,99 119,98 119,98 120,88
Perumahan/Housing 118,80 119,45 119,43 119,53 119,53 119,74
Sandang/Clothing 111,36 111,80 111,80 111,80 111,80 112,62
Kesehatan/Health 115,15 115,93 116,33 116,56 116,56 117,33
Pendidikan, Rekreasi & Olah raga/
Education,Recreation, and Sport 107,34 107,28 107,38 107,38 107,38 107,64
Transportasi dan Komunikasi
Transportation and Communication 127,64 127,40 127,47 124,83 124,83 124,43
BPPBM/Cost of Production&Additional Capital Goods 113,94 114,16 114,93 114,62 114,62 115,10
Bibit/Seed 108,54 108,47 108,03 107,18 107,18 106,64
Obat-obatan & Pupuk/Drugs&Fertilizer 106,04 106,53 107,43 107,84 107,84 108,01
Sewa Lahan, Pajak & Lainnya/Land Rental,
Tax&Others 119,90 119,90 120,65 121,19 121,19 120,93
Transportasi dan Komunikasi/Transportation and
Communication 132,92 131,94 131,94 124,07 124,07 124,09
Penambahan Barang Modal/Additional Capital
Goods 107,23 107,04 107,82 108,30 108,30 108,29
Upah Buruh Tani/Wages of Farms Labour 115,70 116,34 117,44 117,64 117,64 118,98
Nilai Tukar Petani/Farmers’Terms of Trade 99,79 99,02 97,39 97,02 97,02 95,89
Nilai Tukar Usaha Pertanian/Farmers’Bussiness Terms
of Trade 109,03 107,88 105,85 105,40 105,40 103,77
Nilai Tukar Petani Subsektor Tanaman Pangan Provinsi Sulawesi Utara, 2016
Farmers’ Term Trade of Food Crops Subsector Province of North Sulawesi, 2016 Tabel
Table 3.
Rincian / Details Jul Ags Sep Okt Nov Des
(1) (8) (9) (10) (11) (12) (13)
Indeks Diterima Petani/Price Received by Farmers
In-dex 119,17 120,49 119,19 117,47 117,73 117,55
Padi/Paddy 121,01 121,40 120,48 118,97 116,76 115,35
Palawija/Secondary Crops 117,21 119,53 117,82 115,87 118,77 119,91
Indeks Dibayar Petani/Price Paidby Farmers Index 125,32 125,92 125,68 125,76 126,16 125,94
Konsumsi Rumah Tangga/Household Consumption 128,16 128,78 128,41 128,37 128,92 128,63
Bahan Makanan/Food Stuff 139,58 140,54 139,28 138,73 139,75 138,94
Makanan Jadi/Prepared Food 123,12 123,82 124,63 125,10 125,55 125,34
Perumahan/Housing 120,11 120,29 120,43 120,77 120,92 121,00
Sandang/Clothing 112,62 112,74 112,89 113,36 113,45 114,40
Kesehatan/Health 117,99 118,19 118,33 119,17 119,35 119,24
Pendidikan, Rekreasi & Olah raga/
Education,Recreation, and Sport 107,79 108,25 108,27 108,27 108,31 108,31
Transportasi dan Komunikasi/Transportation and
Communication 124,99 125,32 125,50 125,52 125,60 125,65
BPPBM/Cost of Production&Additional Capital Goods 115,56 116,10 116,32 116,80 116,68 116,71
Bibit/Seed 106,43 106,36 106,47 105,82 105,41 106,15
Obat-obatan & Pupuk/Drugs&Fertilizer 108,00 108,37 108,83 108,62 108,62 108,83
Sewa Lahan, Pajak & Lainnya/Land Rental,
Tax&Others 120,87 120,87 120,87 120,90 120,90 120,91
Transportasi dan Komunikasi/Transportation and
Communication 123,45 123,07 123,33 123,83 123,72 124,12
Penambahan Barang Modal/Additional Capital
Goods 109,70 110,28 110,28 111,06 110,59 110,12
Upah Buruh Tani/Wages of Farms Labour 119,73 120,79 121,11 122,09 122,09 122,09
Nilai Tukar Petani/Farmers’Terms of Trade 95,10 95,69 94,84 93,41 93,32 93,34
Nilai Tukar Usaha Pertanian/Farmers’Bussiness Terms
of Trade 103,13 103,78 102,47 100,58 100,90 100,72
Lanjutan Tabel 3. / Continued of Table 3.
Rincian/Details Jan Feb Mar Apr Mei Jun
(1) (2) (3) (4) (5) (6) (7)
Indeks Diterima Petani/Price Received by Farmers
Index 134,93 132,73 130,99 127,69 127,69 125,98
Sayur-sayuran/Vegetables 137,88 135,25 132,97 129,43 129,43 127,53
Buah-buahan/Fruits 118,78 118,92 120,37 118,07 118,07 117,30
Tanaman Obat/Medical Plants 123,20 123,19 120,75 121,82 121,82 122,56
Indeks Dibayar Petani/Price Paid by Farmers Index 124,05 123,85 124,27 123,81 123,81 123,83
Konsumsi Rumah Tangga/Household Consumption 126,85 126,64 127,07 126,57 126,57 126,62
Bahan Makanan/Food Stuff 137,20 136,41 137,17 136,39 136,39 136,15
Makanan Jadi/Prepared Food 119,49 119,79 120,24 120,24 120,24 121,03
Perumahan/Housing 119,72 120,05 120,10 120,32 120,32 120,27
Sandang/Clothing 109,69 110,40 110,40 110,47 110,47 111,01
Kesehatan/Health 114,31 115,03 115,37 115,59 115,59 116,49
Pendidikan, Rekreasi & Olah raga/
Education,Recreation, and Sport 108,43 108,42 108,46 108,46 108,46 108,80
Transportasi dan Komunikasi/Transportation
and Communication 127,01 126,72 126,79 124,68 124,68 124,32
BPPBM/Cost of Production&Additional Capital
Goods 111,24 111,07 111,44 111,16 111,16 111,03
Bibit/Seed 112,64 112,48 112,71 112,39 112,39 111,72
Obat-obatan & Pupuk/Drugs&Fertilizer 107,39 107,50 108,48 108,48 108,48 107,84
Sewa Lahan, Pajak & Lainnya/Land
Rent-al,Tax,Others 105,72 105,80 105,43 105,44 105,44 105,51
Transportasi/Transportation 115,97 114,94 114,44 111,81 111,81 111,78
Penambahan Barang Moda/Additional Capital
Goods 111,45 110,99 112,03 112,04 112,04 112,04
Upah Buruh Tani/Wages of Farm Labour 115,27 115,27 115,68 116,15 116,15 116,60
Nilai Tukar Petani/Farmers’Terms of Trade 108,77 107,17 105,41 103,13 103,13 101,74
Nilai Tukar Usaha Pertanian/Farmers’Bussiness
Nilai Tukar Petani Subsektor HortikulturaProvinsi Sulawesi Utara, 2016
Farmers’ Term Trade of Horticulture Subsector Province of North Sulawesi, 2016 Tabel
Table 4.
Rincian/Details Jul Ags Sep Okt Nov Des
(1) (8) (9) (10) (11) (12) (13)
Indeks Diterima Petani/Price Received by Farmers
In-dex 128,47 123,50 121,64 119,53 120,83 118,99
Sayur-sayuran/Vegetables 130,70 124,76 122,50 120,25 121,67 119,45
Buah-buahan/Fruits 116,42 116,90 117,16 115,72 116,41 116,68
Tanaman Obat/Medical Plants 118,04 114,69 116,00 114,99 116,00 115,01
Indeks Dibayar Petani/Price Paid by Farmers Index 124,38 124,98 124,68 124,77 125,00 125,12
Konsumsi Rumah Tangga/Household Consumption 127,24 127,94 127,58 127,66 127,94 128,13
Bahan Makanan/Food Stuff 136,85 138,00 136,95 136,77 137,07 137,39
Makanan Jadi/Prepared Food 122,96 123,65 124,44 124,87 125,33 125,19
Perumahan/Housing 120,05 120,16 120,02 120,25 120,64 120,66
Sandang/Clothing 111,20 111,29 111,41 111,72 111,84 113,01
Kesehatan/Health 117,00 117,15 117,29 118,04 118,10 117,88
Pendidikan, Rekreasi & Olah raga/
Education,Recreation, and Sport 108,85 109,33 109,35 109,35 109,38 109,39
Transportasi dan Komunikasi/Transportation and
Communication 124,86 125,32 125,45 125,49 125,58 125,60
BPPBM/Cost of Production&Additional Capital Goods 111,27 111,41 111,42 111,53 111,55 111,33
Bibit/Seed 113,23 112,76 112,61 112,88 113,02 113,22
Obat-obatan & Pupuk/Drugs&Fertilizer 107,65 107,31 107,42 107,38 107,38 106,73
Sewa Lahan, Pajak & Lainnya/Land
Rent-al,Tax,Others 105,51 105,52 105,52 105,52 105,52 105,52
Transportasi/Transportation 111,51 111,56 111,56 111,42 111,42 111,55
Penambahan Barang Moda/Additional Capital
Goods 113,03 113,17 113,17 113,31 113,35 112,54
Upah Buruh Tani/Wages of Farm Labour 116,60 117,75 117,75 118,11 118,11 118,11
Nilai Tukar Petani/Farmers’Terms of Trade 103,29 98,81 97,56 95,80 96,67 95,10
Nilai Tukar Usaha Pertanian/Farmers’Bussiness Terms
of Trade 115,46 110,84 109,17 107,18 108,32 106,88
Lanjutan Tabel 4. / Continued of Table 4.
Rincian/Details Jan Feb Mar Apr Mei Jun
(1) (2) (3) (4) (5) (2) (3)
Indeks Diterima Petani/Price Received by Farmers Index 108,51 109,84 111,10 112,88 112,88 112,97
Tanaman Perkebunan Rakyat/Smallholders Estate
Crops 108,51 109,84 111,10 112,88 112,88 112,97
Indeks Dibayar Petani/Price Paid by Farmers Index 123,59 123,35 123,94 123,39 123,39 123,38
Konsumsi Rumah Tangga/Household Consumption 127,01 126,69 127,36 126,70 126,70 126,60
Bahan Makanan/Food Stuff 139,19 138,15 139,47 138,45 138,45 137,79
Makanan Jadi/Prepared Food 118,24 118,51 118,96 118,82 118,82 119,67
Perumahan/Housing 117,66 117,94 117,94 117,94 117,94 117,92
Sandang/Clothing 112,41 112,68 112,66 112,71 112,71 113,32
Kesehatan/Health 113,35 114,15 114,56 114,82 114,82 115,67
Pendidikan, Rekreasi & Olah raga
Education,Recreation&Sport 104,96 105,59 105,63 105,63 105,63 105,74
Transportasi dan Komunikasi
Transportation and Communication 129,05 128,65 128,71 126,45 126,45 126,10
BPPBM/Cost of Production & Additional Capital Goods 110,13 110,15 110,44 110,33 110,33 110,68
Bibit/Seed 115,02 115,73 115,84 115,84 115,84 115,45
Obat-obatan & Pupuk/Drugs& Fertilizer 109,88 109,25 109,21 109,04 109,04 109,04
Sewa Lahan, Pajak & Lainnya/Land Rental,Tax&Others 102,50 102,50 102,50 102,50 102,50 102,50
Transportasi/Transportation 129,25 129,76 129,75 128,35 128,35 128,09
Penambahan Barang Moda/Additional Capital Goodsl 108,51 108,51 108,51 108,53 108,53 108,55
Upah Buruh Tani/Wages of Farm Labour 109,68 110,10 110,97 111,10 111,10 112,22
Nilai Tukar Petani/Farmers’Terms of Trade 87,80 89,05 89,64 91,49 91,49 91,57
Nilai Tukar Usaha Pertanian/Farmers
Bussiness Terms of Trade 98,53 99,72 100,60 102,31 102,31 102,08
Nilai Tukar Petani Subsektor Perkebunan Rakyat Provinsi Sulawesi Utara, 2016
Farmers’ Term Trade of Smallholders Estate Crops Subsector Province of North Sulawesi, 2016
Tabel
Table 5.
Rincian/Details Jul Ags Sep Okt Nov Des
(1) (8) (9) (10) (11) (12) (13)
Indeks Diterima Petani/Price Received by Farmers Index 114,08 114,49 113,61 111,74 111,22 109,90
Tanaman Perkebunan Rakyat/Smallholders Estate
Crops 114,08 114,49 113,61 111,74 111,22 109,90
Indeks Dibayar Petani/Price Paid by Farmers Index 124,23 124,80 124,45 124,32 124,81 124,43
Konsumsi Rumah Tangga/Household Consumption 127,52 128,17 127,74 127,57 128,16 127,68
Bahan Makanan/Food Stuff 138,73 139,73 138,37 137,62 138,66 137,54
Makanan Jadi/Prepared Food 122,06 122,79 123,56 123,99 124,37 124,11
Perumahan/Housing 117,97 118,05 117,96 118,13 118,49 118,51
Sandang/Clothing 113,51 113,64 113,80 114,19 114,38 115,52
Kesehatan/Health 116,21 116,38 116,56 117,28 117,36 116,98
Pendidikan, Rekreasi & Olah raga
Education,Recreation&Sport 105,79 106,00 106,05 106,06 106,08 106,09
Transportasi dan Komunikasi
Transportation and Communication 126,69 127,25 127,36 127,39 127,43 127,46
BPPBM/Cost of Production & Additional Capital Goods 111,23 111,49 111,51 111,49 111,59 111,61
Bibit/Seed 116,00 116,13 117,17 117,84 117,84 117,84
Obat-obatan & Pupuk/Drugs& Fertilizer 109,57 109,38 108,85 108,49 108,49 108,49
Sewa Lahan, Pajak & Lainnya/Land Rental,Tax&Others 102,50 102,50 102,50 102,50 102,84 102,84
Transportasi/Transportation 129,37 129,40 129,44 129,46 130,17 130,24
Penambahan Barang Moda/Additional Capital Goodsl 109,66 109,86 110,79 111,22 111,22 111,29
Upah Buruh Tani/Wages of Farm Labour 112,64 113,49 113,49 113,49 113,49 113,49
Nilai Tukar Petani/Farmers’Terms of Trade 91,83 91,74 91,29 89,88 89,11 88,33
Nilai Tukar Usaha Pertanian/Farmers
Bussiness Terms of Trade 102,56 102,69 101,89 100,22 99,66 98,47
Lanjutan Tabel 5. / Continued of Table 5.
Rincian/Details Jan Feb Mar Apr Mei Jun
(1) (2) (3) (4) (5) (2) (3)
Indeks Diterima Petani/Price Received by Farmers Index 119,07 118,91 118,97 119,69 119,69 120,17
Ternak Besar/Large Livestock 118,25 117,13 117,68 118,42 118,42 118,77
Ternak Kecil/Small Livestock 116,66 117,45 116,57 117,40 117,40 117,80
Unggas/Poultry 120,45 120,24 120,11 120,53 120,53 121,60
Hasil Ternak/Livestock Product 126,93 128,51 129,03 129,64 129,64 130,27
Indeks Dibayar Petani/Price Paid by Farmers Index 118,28 118,24 118,53 117,81 117,81 117,92
Konsumsi Rumah Tangga/Household Consumption 128,64 128,31 129,02 128,22 128,22 128,31
Bahan Makanan/Food Stuff 139,62 138,42 139,79 138,73 138,73 138,61
Makanan Jadi/Prepared Food 119,81 120,32 120,74 120,51 120,51 121,28
Perumahan/Housing 120,19 120,97 121,03 120,99 120,99 120,97
Sandang/Clothing 111,31 111,57 111,57 111,63 111,63 111,91
Kesehatan/Health 112,60 113,26 113,55 113,75 113,75 114,71
Pendidikan, Rekreasi & Olah raga/
Education,Recreation&Sport 108,60 108,73 108,80 108,80 108,80 108,99
Transportasi dan Komunikasi/
Tranpsort&Communication 129,08 128,70 128,86 126,74 126,74 126,27
BPPBM/Cost of Production & Additional Capital Goods 107,33 107,59 107,45 106,81 106,81 106,94
Bibit/Seed 103,50 104,04 103,73 103,74 103,74 103,98
Obat-obatan & Pupuk/Drugs&Fertilizer 108,97 109,44 109,27 109,10 109,10 109,65
Sewa Lahan, Pajak & Lainnya/Land
Rent-al,Tax&Others 103,13 103,20 103,53 104,57 104,57 104,78
Transportasi/Transportation 123,65 122,65 122,49 114,47 114,47 114,47
Penambahan Barang Modal/Additional Capital Goods 102,07 102,27 101,77 102,14 102,14 101,46
Upah Buruh Tani/Wages of Farm Labour 107,54 107,84 108,87 108,87 108,87 108,87
Nilai Tukar Petani/Farmers’Terms of Trade 100,67 100,57 100,37 101,59 101,59 101,91
Nilai Tukar Usaha Pertanian/Farmers’Bussiness Terms
of Trade 110,94 110,52 110,73 112,06 112,06 112,37
Nilai Tukar Petani Subsektor Peternakan Provinsi Sulawesi Utara, 2016
Farmers’ Term Trade of Animal Husbandary Subsector Province of North Sulawesi, 2016
Tabel
Table 6.