Journal of Chemical and Pharmaceutical Research, 2015, 7(11):57-67
1Laboratory of Computational and Electrophotochemical Chemistry, State University of Padang, Air Tawar,
Padang
2Laboratory of Electrophotochemical dan Nanomaterial Chemistry, Andalas University, Limau Manis, Padang 3Faculty of Education and Teaching, University of Riau, Pekanbaru
_____________________________________________________________________________________________
ABSTRACT
This research aims to study process and mechanism of water splitting by photoelectrochemistry. Water splitting to produce hydrogen was initiated by photocatalysis on semiconductor of photovoltaic cell to growth the sufficient voltage so can be used for water electrolysis system by using tandem PV-EC cell. Visualization of water splitting has been monitoring with high resolution CMOS camera, 13 MPixel of OPPO X9006. This visualization has been modeling for hydrogen gas formation mechanism at carbon electrode (graphite) surface. PV Cell use Cu2O/Al as
electrode with 0.003711 m2 surface area. Among ten PV cell series arrangement (surface area = 0.03711 m2), produce voltage between 3.01 V (room lights) ∼ 3.43 V(neon lights) (this voltage was exceed minimum voltage for water splitting with voltage 1,47V) and current 509.8 µA and 438.7 µA. The process of water splitting observed at initiation of formation H2 gas and H2 release at carbon surface. Rate of H2 gas formation in the first 10 minutes is
1.72 x 10⁻⁵ ml/min, and stable with rate 1.17 x 10⁻⁵mL/min after 1 hour and 50 minutes. H2 gas volume produced
reach 0.00281 mL after 5 hours 45 minutes.
Keywords : Photoelectrochemical, Photovoltaic, Indoor Lights
_____________________________________________________________________________________________
INTRODUCTION
Sunlight is one of renewable energy resource with abundant stock. Its potential energy reaches 1000-1369 Watt/m2 or about 3.9 x 10⁶ EJ (1 EJ = 1018 J) from one year total energy (1; 2) and only about 5-12 % (3). We reutilized by humans through photovoltaic technology. In addition, the energy of sunlight does not have negative impacts like fossil fuel.The process of converting sun’s energy was not have waste product so it is one of clean energy resource. Therefore, solar energy has great potential to become the future energy resource, with abundant stock and environmentally friendly(4).
hv placed in a position perpendicular to the direction of the sun coming, according to the zenith position and the light coming. In the tropics, this position is known as AM1, where as the subtropics area AM1.5. The reactor was placed in an open space and designed to be able to interact with the maximum of Solar Cells reactor. Meanwhile, the reactor that can work in room light has not been widely studied. This is because room light has relatively low light energy and solar panels that can work effectively is still not developed. Another factor is the difficulty to directly transform the low-intensity light energy to commercial energy and direct storage such as batteries.
Development of photocells reactor that can use energy from room light with low intensity to another intermediate energy forms as a carrier, in the formation of hydrogen gas continuously, it becomes an attractive option. Room light was used is sunlight coming into the room and the irradiation from lamp, like a neon (7). The conversion process can be done by making a tandem photovoltaic cells and electrolysis cells(PV-EC) to transform indoor light energy into electrical energy that adequate for the electrolysis of water (1,47 V) into hydrogen gases(8; 9). In this study conducted a study on the process of water splitting into hydrogen gas was observed with a high resolution camera on the Oppo X9009 and modeled through calculation assumptions hydrogen gas bubbles in scale to capture images on the surface of the carbon electrode.
EXPERIMENTAL SECTION
Materials and tools
The tools was used in this research are multimeter (Heles), Lightmeter, SEM-EDX (Hitachi S-3400N), XRD, neon Lamp (Philip 10 watt), paper, carbon paper, Furnace, analytical balance, and glass tools.
Materials was used in this research are glass (PT Asahimas), glass glue, Cu plate (PT Metalindo Sejahtera), Al Plate, Natrium sulfat (Na2SO4) (Merck), gelatin, chloroform (Merck) and aquades.
Method
Preparation of Copper Oxide electrode
Copper Oxide electrode was prepared by calcinating Cu plate on various temperature 300, 350, 400, 450 and 500oC, for 1 hour. The resulting Copper Oxide plate was caracterized with SEM EDX and XRD.
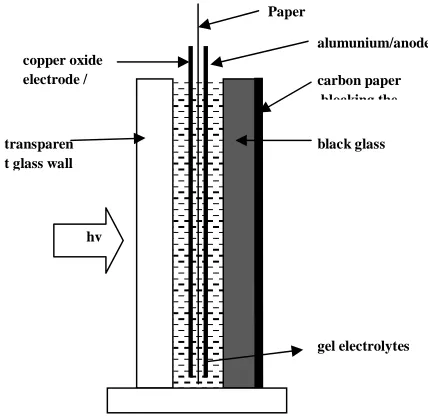
Preparation of photovoltaic cell
Photovoltaic cell was prepared with design like figure 1.
Preparation of Natrium Sulphate (Na2SO4) gelatin electrolyte
3,6 gram Na2SO4was diluted with 100 mL water. Then, the solution was added 0,5 gram gelatin powder. The
mixture was stirred and heated until boiling and become clean. After that was added some drops of chloroform and then solution was filled to cells directly.
Measurement current and voltage of PV cells
Each PV cell was filled by natrium sulfate gelatin, then illumiation under room lights and neon lights. Current and voltage from cells was measured with multimeter.
Preparation PV-EC Tandem Reactor
PV-EC tandem cell was designed like scheme on picture 2.
Figure 2. Scheme of design Photovoltaic and Electrolysis (PV-EC) tandem reactor
Image (Photo) Capturing and Calculation Model of Gas Bubble
Hydrogen gas bubble formation process at cathode in electrolysis cell was captured using high resolution camera CMOS 13 megapixel Oppo X9006. Calculation was done by using 50 time zooming for initial capture and record the mobility of bubble was observed with video capturing at surface of carbon electrode during splitting water into hydrogen takes place.
RESULTS AND DISCUSSION
Assembling of PV Cell
The Making of Electrode at PV Cell and Characterization by SEM-EDX-XRD
0 0.02 0.04 0.06 0.08 0.1 300
350 400 450 500
Mass growth of Copper Oxide (CuxO (gram)
C
a
lc
in
a
ti
o
n
T
em
p
(
o
C
)
Effect of Temperature for Mass of Copper Oxide (CuxO)
Figure 3. Photo of electrode plate (a) Alumunium (b) Copper (c) Surface of copper plat using Oppo X9009 camera and (d) SEM image of copper at 10000x enlargement
Figure 4. Photo of Copper Oxide plate surface at 400oC calcinations (a) CMOS Camera (b) SEM with 10.000 times enlargement (c) EDX
; and d, e, f for 500oC calcinations temperature
Calcinating copper plate causes the formation of oxides on the surface as shown in Figure 3 and 4. The higher of calcination temperature, the oxide layer is formed more and more as shown in figure 5. This is due to the increasing number of reaction between oxygen atoms at the surface of the copper plate. From the camera catches Oppo X9009, visible changes on the surface of the copper plate before and after calcination.
From EDX analysis, there is increasing the amount of oxygen on the surface of the Cu plate which originally 1.22%. After calcination at 400oCwas obtained percent oxygen is 16.5%. and 500oC percent oxygen on the surface of the Cu plate is 15.27%. Increasing of oxygen on the surface of the plate, will lead to an increase in the photocatalytic ability of the semiconductor material, since the formation of the conduction band(10).
From the results of XRD analysis of the copper oxide plate after calcination at 400oC, there two kind of oxides have formed, copper (I) oxide and copper (II) oxide with percentage 26.7% of copper (II) oxide (CuO) and 73.3% of copper (I) oxide (Cu2O), as shown in figure 6. Formation of copper oxide under 1000oC, that is mixture of Cu2O
(firstly) and CuO (secondly) compound(11).
Figure 6. XRD of Copper Oxide Plate
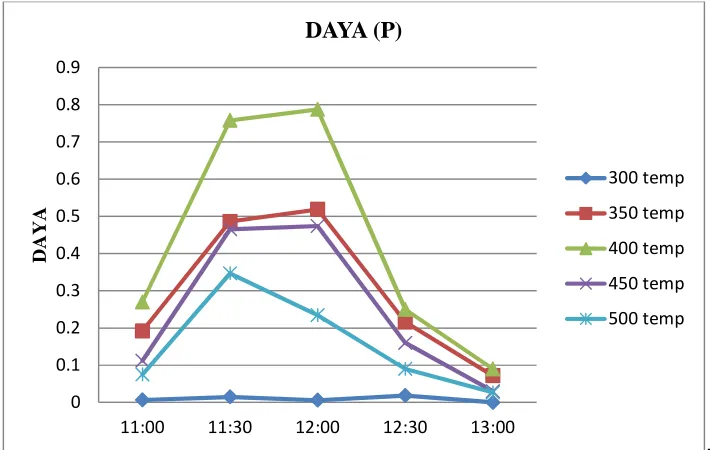
The Result of PV Cell Power Measurement
The optimum current and voltage of PV cells (Cu2O/Cu) was obtained with Cu plate after calcination at 400oC with
power 116.1574 µW/m2. Meanwhile calcination at 300, 350, 450 and 500oC was produced power 2.462948 µW/m2, 80.02695 µW/m2, 66.91997 µW/m2and 41.66532 µW/m2.
.
Figure 7. Power of Cu2O/Cu PV Cell at temperature variations 0
0.1 0.2 0.3 0.4 0.5 0.6 0.7 0.8 0.9
11:00 11:30 12:00 12:30 13:00
D
A
Y
A
DAYA (P)
300 temp
350 temp
400 temp
450 temp
At the time of PV Cells modified by replacing the anode (Cu plate) with plate Al, an increase in power PV cells significantly as shown in Table 1. Increasing the ability of PV cells is because the nature of aluminum plates such as n-type junction that provides electron more than plates Cu that are p-type junction(12). Therefore, plate Al causes a potential difference greater PV cell so as to produce greater power.
Table 1. PV Cell Power of Cu2O/Al at indoor lights from sunligts entering the room and from illumination of neon lamp
PV Cell (Cu2O/Al)
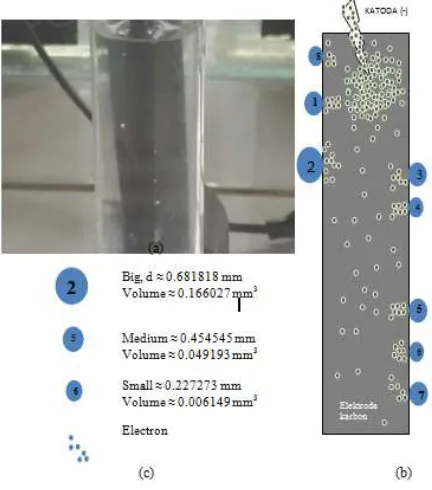
carbon electrodes and marked on the 8 point Hydrogen gas bubble formation. Each H2 gas bubble nucleation point is
observed and measured by capturing image scale method by comparing the size of the carbon electrodes used in EC Cell.
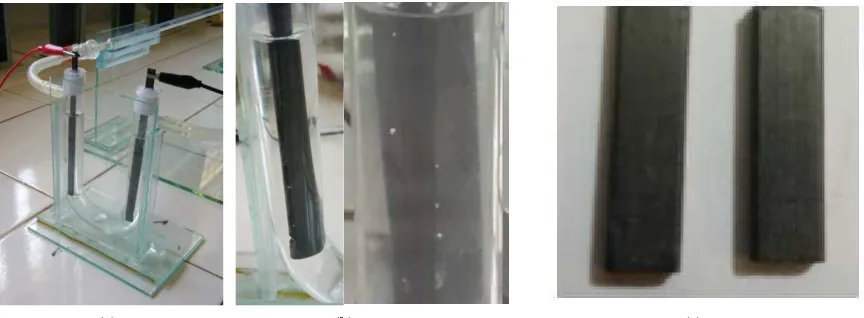
(a) (b) (c)
Figure 8. Electrolysis Cell using Carbon bar at cathode (a) and nucleation point of gas bubbles at Carbon electrode surface (b), sectional Carbon electrode (c)
Based on the measurement scale camera capturing, hydrogen gasbubbleshave formed classified into three groups, i.e, large bubble (x B), medium bubble (x S) and small bubble (x K), with the size of each bubble are 0.68182 mm, 0.45455 mm and 0.22727 mm. The formation of gas bubbles are monitored by camera catches, and shift of bubble in buret scale. However, the formation of H2gas bubbles growth slightly, the method of measurement was done with a
video recording on the surface of the carbon electrode for 5 hours and 45 minutes. Results recorded video capture on the surface of the carbon electrode was analyzed to get accurate results about the mechanism of formation of H2 gas
bubbles.
Analysis of Video Capturing at Carbon Electrode Surface
Capturing video observations for 5 hours 45 minutes reported by calculating the scale on the image 13 MP (Scheider certified professional camera)/50 Mega Pixel Photo Impresive Capturing from Oppo F7a X9006, when gas bubbles are formed and obtained by the real size scale comparators in image capturing. In this study actually gained diameter of each is 0.681818 mm for large size, 0.454545 mm for medium-size and 0.227273 mm for the small size.
Bubble formation occurs at minute 10, characterized by the formation of small bubbles (NBT) and the same time the formation of large bubbles (NBT). After 20 minutes, a bubble is formed again 1 large bubble (NBT) and 1 medium bubble (NST). Meanwhile, the release of gas bubbles occurred after 50 minutes of the release of 2 large bubbles (NBL). 8 minutes later, one huge bubble of H2 gas (NBL) was released from suface of elctrode. The counting
process can be seen in Table 3.
The process of the formation and transport of gas takes place at the time to 39:34 (39 minutes 34 seconds) is the No. 3 gas bubbles smaller gas bubbles move closer No. 4 larger. In the 45th minute, H2 gas bubbles in point 4 was
releasedform electrode surface. H2 gas bubble migration reaction was observed in the recording surface of the Oppo
F7a. 26 seconds later, the initiation point reappear in the same location, namely point 4. H2 gas bubble nucleation
No. 4 getting bigger and the same size as the gas bubbles No. 3 at minute 53. Both of these gas bubbles is approximately 5 mm and engaged with each other approaching at minute 53, second to 13.
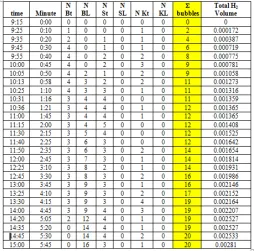
Table 3. The formation H2 gas bubbles at the cathode, NBT = number of large-size H2 bubbles formed, NBL = number of H2 large gas
bubbles escaping from the cathode surface, S = medium, K = small, t = formed, L = apart
bubbles as tabulated in Table 3. The term NBT, NST, HCV, respectively explain the large number of gas bubbles formed to size Large, medium and small. The term L, for the bubbles apart.
From Table 3 have seen that the formation of gas bubbles occur is continuous for 5 hours and 45 minutes. Hydrogen gas bubbles after the point is established, then the bubble is enlarged on the surface of the electrode (cathode) and finally detached from the cathode surface to the water surface.
Nucleation point H2 gas bubbles begin to form after the tandem PV-EC work for 10 minutes 5 seconds. Based on the
observations, H2 growing gas bubbles with a diameter of 0.68 mm as shown in Figure 9. Determination of H2 gas
volume is formed by the following formula (assuming a spherical bubble of H2 gas). The volume of gas bubbles H2
= V = (4/3)3. Where r = radius of H2 gas bubbles (r = ½ diameter). Hydrogen gas bubbles are large in diameter
0.681818 mm, then his fingers can be calculated, ie r=½ mm x 0.681818 = 0.340909 mm. Thus, the volume of H2
gas bubbles are generated is 0167mm3.
Table 4. Sizes and bubbles model of H2 gas
Bubbles d (mm) r (mm) V (mm3) V(cm3) Big 0.681818 0.340909 0.166027 0.000166
Medium 0.454545 0.227273 0.049193 4.92E-05
Small 0.227273 0.113637 0.006149 6.15E-06
On the Figure 9 have seen that H2 gas bubbles is formed with variation sizes. There is three variations sizes, that
small, medium and big, depend on H2 gas bubbles diameter on sectional electrode surface.
Figure 9. Gases bubbles image and models, (a) at carbon surface with 13 MPixel/50 time enlargement, (b) illustration of Hydrogen gas bubbles has formed in interface of Carbon electrode depend on electron distribution theory and (c) representation of H2 gas bubbles has
formed
Theory of Hidrogen Gas Bubbles Formation
Process of H2 bubbles formation on reaction taking place in water splitting at cathode surface.
Cathode (-) : 2H+ + 2e → H2
Analysis of the formation of hydrogen gas on the surface of elektroda.Tahapannya is convection, migration and diffusion. The movement of electrons in the inner electrode is a process of convection currents generated from the electrolyte galvanic cell. In the electrolysis cell, the process of convection is the movement of electrons occurs towards the electrode surface. After the formation of hydrogen gas electrochemically, the movement of gases on the surface of the electrode is a migration process in translation. Gas will be shifted and eventually leave the surface of the electrode as the process of migrating from the liquid phase to the surface of the electrolyte solution. Finally, the movement of gas through the electrolyte to diffuse from the surface of the output pipe, toward the end of the gas storage.
Various factors affect the electrochemical transport period is a surface electrode, electrolyte environmental conditions, in addition to the main factor is the current and potential. The type of electrolyte used very effectively influence the migration process. Migration in acidic, alkaline and salt will have differences. Because of differences in the atmosphere of the electrolyte, affecting the conductivity of the solution. On the electrode surface, convection process is highly dependent on the structure of the electrode surface, which raises the style of style to the style of convection and gas formation on the electrode surface. Surface electrodes that are not symmetrical cause polarization on the electrode surface, as illustrated in Figure 10.
Figure 10. Schematic of electron polization on carbon electrode interface
The phenomenon of the formation of hydrogen gas at the electrode surface was observed with the following stages. Initiation stage, which is the starting point of the formation of hydrogen gas. This point occurs on the surface of the effective where the convection of electrons on the surface of the electrode is more optimum and at this point there is also an effective collision of H2O with the active C interface electrode surface.
Reactions that occur at the initiation stage is the culmination point with the achievement of the activation energy so that the current that flowed on the surface of the carbon electrode (C), allows for the course of the electrochemical reaction of the hydrogen atoms that exist in H2O in the electrolyte solution. The electrochemical process, is a
process of reduction at the cathode where the flow of electrons from the electrode surface to the hole point of the reactant species. At the same time, the oxidation reaction occurs at the anode where the reactant species that carry electrons give electrons to the hole area (+) on the surface of the C electrode (anode).
Its reaction :
Cathode (-) : 2H+(aq) + 2e → 2H2→ H2(g)
Figure 11. Scheme of H2 gas bubbles formation on C electrode surface
The second stage is the formation of gas bubbles on the surface of the carbon electrode on the active side. This process was observed by the formation of small dots on the surface of the electrode that eventually become small bubble size diameter of 0.2 mm to 0.67 mm. The starting point of the formation of gas bubbles called nucleation sites on the electrode surface. This gas bubble formation will inhibit the electrochemical processes at the electrode surface until H2 gas bubbles regardless of nucleation points. Phenomenon that occurs in the formation of H2 gas
bubbles are:
1. The spontaneous formation of gas bubbles at nucleation sites. After the gas bubble diameter of 0.6 mm, the bubbles is separated from the surface so that the electrochemical processes can walk back. During the nucleation process until the moment the release of H2 gas bubbles, the electrode surface has blocked for core nucleation
reaction of H2 gas.
2. The movement of the electrode surface after nucleation of H2 gas formed at the adjacent position (about 1-3 mm)
with some movement patterns. The movement of the point of H2 gas bubble size is very small tend to be attracted or
moving closer to larger gas bubbles. The second movement of the other is moving closer to each other bubbles to form larger bubbles. The process of movement on the surface of the electrode runs translational and when the bubble is getting bigger, the next process is the process of release of H2 gas bubbles from the electrode surface.
On the electrode surface nucleation sites that are far away from each other, point 7 and 8 in the scheme of H2 gas
bubble formation, the H2 gas discharge becomes difficult to occur. This can be overcome with the vibration of the
electrode so as to increase the momentum of H2 gas bubbles and the gas transport leaving the electrode surface.
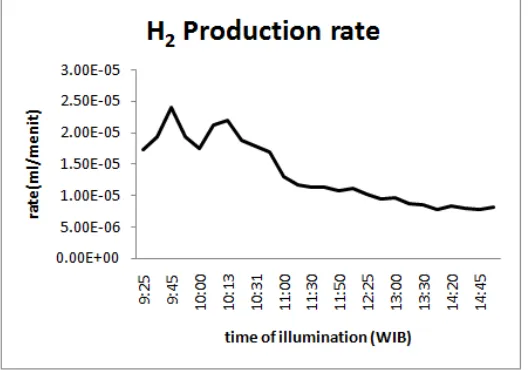
Based on Figure 12, rate of H2 gas production at cathode is 1.72 x 10⁻⁵ ml/minute in time range of first 10 minute,
and its will increase in 1 hours after that, about 2.19 x 10⁻⁵ mL/minute, thus finally decrease until 1.17 x 10⁻⁵ mL/minute after 1 hours 50 minute. From table 3, has been showed that after 6 hours, Hidrogen gas was achievely produced 0.00281 mL.
CONCLUSION
Photoelectrosplitting water for H2 gas production has taken place at the Carbon electrode surface with initiation
process by nucleation point under illumination indoor lights. We can make tandem electrolysis-photovoltaic (PV-EC) reactor cell with 3010 mV voltage (room lights) and 3430 mV voltage (neon light). Both of them can produce H2 gas bubbles with 2 step, which spontaneously bubble formation and nucleation-accumulation bubble formation.
Visualization of H2 production mechanism has monitored and recorded by image and video capturing with high
resolution camera. Rate of H2 production is 1.17 x 10⁻⁵ mL/minute, and the future research can be increased by
modified at electrode surface of electrolysis cell.
REFERENCES
[1]Parlevliet D, Moheimani NR. 2014. Aquatic biosystems 10:4
[2]Zuttel A, Remhof A, Borgschulte A, Friedrichs O. 2010. Philosophical transactions. Series A, Mathematical, physical, and engineering sciences 368:3329-42
[3]Hanmin Tian XY, Jiyuan Zhang, Wenfeng Duan, Fenglan Tian and Tao Yu. 2012. Int. J. Electrochem. Sci. 7:pg 4686-91
[4]Peter LM. 2011. Philosophical transactions. Series A, Mathematical, physical, and engineering sciences
369:1840-56
[5]Ur Rehman A, Lee SH. 2013. TheScientificWorldJournal 2013:470347 [6]Wei D, Amaratunga G. 2007. Int. J. Electrochem. Sci. 2:897-912
[7]Zainul R, Alif A, Aziz H, Arief S, Syukri, Munaf E. 2015. Research Journal of Pharmaceutical Biological Chemical Science 6.4. July-August:353-61
[8]Kudo A. 2003. Catalysis Surveys from Asia Vol. 7, No. 1, April 2003
[9]Sigfusson TI. 2007. Philosophical transactions. Series A, Mathematical, physical, and engineering sciences
365:1025-42
[10]Sears WM, Fortin E. 1984. Solar Energy Materials 10 93-103
[11]Musa. AO, Akomolafe T, Carter MJ. 1998. Solar Energy Materials and Solar Cells 51:305—16