COMPETITIVENESS AND EXPORT SIMILARITY OF INDONE
SIAN HORTICULTURE IN THE ASEAN-ASEAN+3Daya Saing dan Kemiripan Struktur Ekspor Hortikultura Indonesia dalam
Kerangka Asean-asean+3
Nur Chasanah1, Jangkung Handoyo Mulyo2, Dwidjono Hadi Darwanto3 1Student of Graduate Program, 2Lecturer, 3Professor
1,2,3 Department of Agriculture Socio Economic, Faculty of Agriculture,
Universitas Gadjah Mada
Jl. Flora, Bulaksumur, Kec.Depok, Kabupaten Sleman, Daerah Istimewa Yogyakarta 55281
2Population and Policy Studies Center (PSKK), Universitas Gadjah Mada
Jl. Tevesia, Bulaksumur, Kec.Depok, Kabupaten Sleman, Daerah Istimewa Yogyakarta 55281
[email protected]; [email protected]; [email protected]/ [email protected]
Diterima tanggal 2 Juni 2017 ; Disetujui tanggal 13 Juni 2017
ABSTRACT
In the framework of ASEAN+3 integration, Indonesian horticultural trade is facing a dilemmatic position. Being in the middle of a fi erce competition with benchmark countries, it is important that Indonesia gain the highest profi t from its integration strategy. Evaluation is n of needed to investigate Indonesian’s position in ASEAN +3 horticultural markets and the sustainability of specifi c trading prospect on each member country. Therefore, this study aims to investigate competitiveness and similarity of Indonesian horticultural export structure in intra-ASEAN+3. Revealed Comparative Advantage (RCA) analysis shows that Indonesian horticulture does not have aggregate competitiveness in ASEAN+3 market. The average of Indonesian RCA decreased from 1,64 in ASEAN level during 1999-2014 to 0,45 in ASEAN+3 level. In addition, based on Export Similarity Index (ESI) analysis, Indonesia has the highest and the most consistent similarity of horticultural export structure with Singapore, both in ASEAN and ASEAN+3 level. Meanwhile, Thailand has the highest level of export structure similarity in ASEAN with ESI index of 93,77. Integration of ASEAN+3 has led to an alteration in trading scheme in which ESI with each member country generally decrease. The highest level of export structure similarity occurs with Singapore with ESI index of 85,95. Overall, the trade of horticultural commodity in the framework of ASEAN+3 integration is dominated by export structure similarity which may lead to a competition between the members of ASEAN+3.
Keywords: comparative advantage, horticulture, similarity index
INTISARI
spesifi k dengan masing-masing negara anggota. Maka, penelitian ini bertujuan untuk mengetahui daya saing serta kemiripan struktur ekspor hortikultura Indonesia di intra-ASEAN+3. Analisis menggunakan Revealed Comparative Advantage (RCA) menunjukkan bahwa secara agregat hortikultura Indonesia tidak memiliki daya saing di pasar ASEAN+3. Rerata RCA Indonesia selama 1999-2014 sebesar 1,64 di tingkat ASEAN menurun menjadi 0,45 di tingkat ASEAN+3. Sementara itu, berdasarkan analisis dengan Export Similarity Index (ESI), Indonesia memiliki kemiripan struktur ekspor hortikultura yang tinggi dan paling konsisten dengan Singapura baik di tingkat ASEAN maupun ASEAN+3. Kemiripan struktur eksporter tinggi di ASEAN terjadi dengan Thailand pada indeks ESI sebesar 93,77. Integrasi ASEAN+3 menyebabkan perubahan skema perdagangan di mana ESI secara umum menurun dengan masing-masing negara anggota lainnya. Kemiripan struktur ekspor tertinggi di pasar ASEAN+3 terjadi dengan Singapura pada indeks ESI sebesar 85,95. Secara keseluruhan, perdagangan komoditas hortikultura dalam kerangka integrasi ASEAN+3 masih didominasi oleh kemiripan struktur ekspor yang berpotensi menyebabkan kompetisi antar anggota.
Kata kunci: comparative advantage, hortikultura, similarity index
the division of trading blocks is based on geographical approach in order to support effi ciency and welfare improvement for the members of the trading blocks (Krugman, 1991). The main reason of establishing trading blocks is to increase the volume of goods and services trade, mobility of capital and labors, production, production efficiency and product competitiveness which are expected to improve the welfare of the member countries. It is supported by improvement of production specialization which is based on comparative advantage (Lapipi, 2005).
In addition to economic integration, l i b e r a l i z a t i o n e r a a l s o b r i n g s a n implication on the importance of world trade liberalization scheme, particularly regarding agricultural products since developing countries heavily depend on agricultural sector including horticultural INTRODUCTION
The 1997 crisis and the failure of Doha Round cause an increase on ASEAN’s preference on economic integration in form of regional trade agreement. Even though ASEAN countries can still gain advantages from liberalization of multilateral trade in WTO, they believe that countries will receive greater and faster benefits from regional trade agreement. ASEAN recognizes the importance of the role of developed countries in fostering economic growth of ASEAN members. Therefore, ASEAN invited China, South Korea and Japan into a regional trade agreement and established ASEAN+3.
sub-sector. Indonesia is also included in these developed countries. Horticultural commodities are in strategic position for Indonesia since they have various benefits including food, plant-based biopharmaceutical and aesthetic purposes. T h o s e b e n e f i t s o p e n m o r e m a r k e t opportunities, especially for Indonesia whose agro climate and biodiversity support become its comparative advantage. ASEAN+3 have 30% of the world’s population in 2015. Mentioned, there are approximately 67 million household in consuming class with total income of USD 7.500/ year in ASEAN. The number is estimated to increase to 125 million in 2025. It makes ASEAN+3 an economic area with great potential market (Eastpring Inverstments Indonesia, 2016).
T h e t r e n d o f h o r t i c u l t u r a l consumption in ASEAN+3 increase each year. However, the increased consumption is followed by a decrease in export of ASEAN+3 countries from 54,17% in 2010 to 49,71% in 2014. With 31,52% export to ASEAN+3, Indonesia merely achieve only 2,43% of all market which make Indonesia the second lowest in ASEAN+3, it is lower than Indonesian market in ASEAN. In ASEAN+3, Indonesia has to compete with not only great producers such as Thailand and Philippines, but also China which has a very effective production system. More than half of total consumption of ASEAN+3 members are dependent on China. The big
three dominating countries in ASEAN+3 market in every period are China, Thailand and Philippines. Meanwhile, three main destinations of Indonesian export in every period are Singapore, China and Malaysia.
As the owner of great endowment factor, Indonesia has a privilege of being a potential country as target market as well as a big player. Indonesia is the home of 41% of total ASEAN population and 12% of total ASEAN+3 population. Meanwhile, regarding the GDP, Indonesia dominates 35% of ASEAN economy and 5% of ASEAN+3 economy. However, the development of horticultural sub-sector in Indonesia is rather disappointing. Indonesian horticultural trade shows defi cit balance for every year during 2010-2014. The defi cit comes from trade with China and Thailand. It is caused mostly by import of various fruit and vegetable products (Erwidodo, 2014).
F r o m t h e t o t a l o f I n d o n e s i a n horticultural export, 42,05% of the total export circulated in ASEAN+3 in 2010. The value decreased into 31,26 in 2014 that occurred in the middle of relatively signifi cant improvement of world export and Indonesian export to global market. It could be an indication of obstacles encountered by Indonesia regarding market penetration in the context of ASEAN+3 market.
economic development level and socio-cultural background (Kwan and Qiu, 2010). It will support economic growth of the members since there is not much head to head competition in some sectors. Diversity will prevent trade diversion because of high complementarity.
However, it is different when it comes to agricultural sector, especially horticultural sub-sector. In ASEAN level, the ratifi cation of ASEAN Free Trade Agreement in 1993 did not increase the volume of trade because of relatively similar products between members of ASEAN. Referring to comparative advantage, especially in horticultural sub-sector, the similarity of natural resources may lead to competition among the members. Moreover, in ASEAN+3 level, there is China as a great producer which may encourage a fi erce competition.
Market extension and the fact that the members of ASEAN+3 members have similar natural resources may create a complexity which will infl uence performance effectiveness of ASEAN+3 integration whereas one main reason of a free trade area establishment is to make use of existing complementarity (Sinaga, 2010). Otherwise, the aim of integration in the context of horticultural commodity cannot be achieved.
Market extension leads to a more dynamic market. Competitions in domestic and international market become more intense. ASEAN+3 is a potential target
market for Indonesia. However, ASEAN+3 is also an important target market for other countries. This phenomenon gains serious attention in the middle of liberalization and regional integration issues since each country has similar interest to make the most of the open market access.
Indonesia is concerned that ASEAN+3 may create a distortion especially related to the risk of fl uctuation in price which will be diffi cult to be handled by Indonesian farmer with relatively limited skill, fi erce competition and pressure to efficiently decrease transaction cost. Indonesia must compete to dominate the market share. On the other hand, Indonesia becomes a great target market for other members. The interdependence of the relationship needs a sustainable evaluation in order to avoid unequal benefi t distribution.
country’s competition level (Yao and Wan, 2014). Therefore, competitiveness position needs to be complemented by an analysis of export structure similarity which also becomes information regarding potential regional integration in the future (Nasrudin, et al., 2014). Both of them will be indicators for Indonesia to determine its position in order to maintain its existence and make the most of the ASEAN+3 trading integration.The effects of regional integration, especially trade integration, have always been important information for policymakers. It is useful for knowing the benefi ts of regional trade cooperation to a country, as well as showing potential sectors to be harmed from higher market competition (Sudsawasd, 2012).
METHODS
This study uses secondary data which include the data of export and import of horticultural commodities based on code HS 1998: 06, 07, 08, and0910 from UN Comtrade (comtrade.un.org). The data was taken in a period of 16 years (1999-2004) from eight main countries in ASEAN+3 namely Indonesia, Malaysia, Singapore, Thailand, Philippines, China, South Korea, and Japan. These ASEAN countries were included in the analysis based on similarity in natural resources, particularly in horticulture sub-sector, and the continuity of data availability during the research period.
Revealed Comparative Advantage
(RCA)
The equation of RCA (Revealed Comparative Advantage) index in this research is taken from Balassa which is written as follows (Balassa, 2013).
where is the export value of i country on k commodity to ASEAN+3, is the total export value of ASEAN+3 on k commodity,
is the total export value of i country to ASEAN+3, and
is the total export value of ASEAn+3. i represents Indonesia, Malaysia, Singapore, Thailand,Philippines, China, South Korea and Japan, while k is aggregation of horticultural commodity group with code HS 1998: 06, 07, 08, and 0910.
RCA indexes range from 0 to infi nity (0≤RCApi≤∞). Based on its RCA value, comparative advantage can be classifi ed into four categories of comparative advantage: very strong (RCA>2,5), s t r o n g ( 1 , 2 5≤R C A≤2 , 5 ) , m e d i u m (0,8≤RCA≤1,25), and weak (RCA<0,8) (Wang, 2015).
Export Similarity Index(ESI)
especially with very different export structures) would not make sense.Thus, ESI is used completing the analysis. The equation formula of ESI is written as follows (Finger and Kreinin, 1979):
ESI = x 100
Where:
= Export value of k commodity from i country to ASEAN+3 = Export value of k commodity
from j country to ASEAN+3 = Total export value from i country
to ASEAN+3
= Total export value from j country to ASEAN+3
i = Indonesia
j = Malaysia, Singapore, Thailand, Philippines, China, South Korea, and Japan
k = Horticultural commodity group with code HS 1998: 06,07,08, and 0910
The variation of ESI indexes range from 0-100 (Peters, 2008). Zero value indicates that the structures of commodity export between i country and j country are totally different. 100 on ESI indicates that the structures of commodity export between i country and j country are similar. Therefore, values which are closer to 100 indicate that the commodity export structures between the two countries are
similar and the competition in the global market will be more intensive (Fundira, 2013).ESI is subject to aggregation bias implying the more disaggregated the data considered, the lower is likely to be the value of the index. Thus,there is a certain degree of arbitrariness due to product/ industry choice (Gul, 2014).
RESULTS AND DISCUSSION
T h e C o m p a r i s o n o f I n d o n e s i a n
Horticultural Competitiveness in
Intra-ASEAN+3
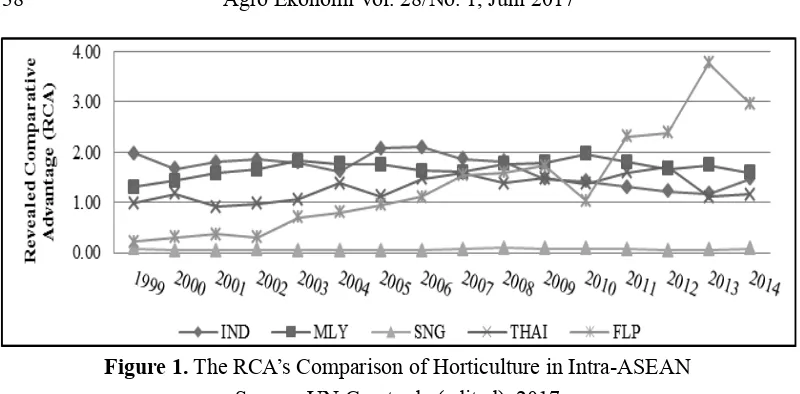
According to figure 1, Indonesia started its competitive performance with a value of RCA which was the highest and consistently has had competitiveness in every period. Until 2008, Indonesian horticulture competitiveness in intra-ASEAN had shown the best performance. At the end of this period, Indonesian competitiveness was in the third position after Philippines and Malaysia. Since 2010, Philippines have appeared with a signifi cant developing competitiveness, and have been superior to the other countries until the recent period. However, the development of Philippines’ competitiveness occurs in the middle of its export segment which is the lowest in intra-ASEAN. That denotes that Philippines have the potency to be a great player in horticulture commodity trade, even in a wider market scale.
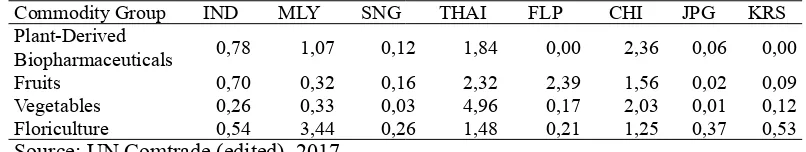
commodity group. The best performance was in plant-derived biopharmaceuticals products. Indonesia’s plant-derived biopharmaceuticals or spices usually keep changing positions between developing category and potential category, especially before or after economic crisis (Hermawan, 2016). Conversely, competitiveness performance for each group was still below the other countries. Indonesia’s plant-derived biopharmaceuticals, vegetables, and floriculture were competitive with Malaysia while fruits with Philippines. Generally, Indonesia’s main rival in most products in ASEAN was Malaysia. Nevertheless, the distributions of Indonesia
proved the most balanced in those four commodity groups. That meant Indonesia had a balanced potential in horticulture products generally. An integrated and consistent management brought big profi ts for mastering Indonesia’s export segment which was wider and for minimizing the risk of being depended on only one commodity group of horticulture thus could lessen performance fl uctuation.
A similar potential also owned by Malaysia. On the other side, Thailand and Philippines only superior in fruit products. Philippines’ fruit competitiveness was very high but not with the other products. With a signifi cant weight in fruits category in Figure 1. The RCA’s Comparison of Horticulture in Intra-ASEAN
Source: UN Comtrade (edited), 2017
Table 1. The RCA’s Comparison of Horticulture in Intra-ASEAN 2014 per Commodity Group
Commodity Group IND MLY SNG THAI FLP
Plant-Derived Biopharmaceuticals 1,91 2,61 0,24 0,08 0,00
Fruits 1,64 0,83 0,41 1,43 5,01
Vegetables 1,19 2,49 0,20 0,95 0,41
Floriculture 1,16 3,04 0,09 0,54 0,01
Source: UN Comtrade (edited), 2017
ASEAN, that level of competitiveness led Philippines to the best position in intra-ASEAN aggregately. Weight represented how the comparisons of the specialty of horticulture export commodity group composition between a country and the other countries in global market were (Abu, 2012).
The agreement of free trade of ASEAN+3 resulted in a wider market opportunity. Every intra-ASEAN+3 c o u n t r y w a s p r o v i d e d w i t h e q u a l opportunities to build on their exports by the accesses which were easier. The capability of a country to benefit that open market access could determine its
competitive performance. Figure 2 displays that ASEAN+3 markets did not cause each country’ competitive performance to grow equally. From those eight countries, that was only Thailand, Philippines, and China which had competitiveness in horticulture commodity aggregately. Thailand and Philippines was two ASEAN countries which experienced signifi cant competitive performance development in ASEAN+3 markets while the other ASEAN countries experienced dropping off. Philippines and Thailand respectively led the achievement of RCA value in the level of ASEAN+3. Both countries successfully benefit the openess of markets to escalate their exports Figure 2. The RCA’s Comparison of Horticulture in Intra-ASEAN+3
Source: UN Comtrade (edited), 2017
Table 2. The RCA’s Comparison of Horticulture in Intra-ASEAN+3 in 2014 per Commodity Group
Commodity Group IND MLY SNG THAI FLP CHI JPG KRS Plant-Derived
Biopharmaceuticals 0,78 1,07 0,12 1,84 0,00 2,36 0,06 0,00 Fruits 0,70 0,32 0,16 2,32 2,39 1,56 0,02 0,09 Vegetables 0,26 0,33 0,03 4,96 0,17 2,03 0,01 0,12 Floriculture 0,54 3,44 0,26 1,48 0,21 1,25 0,37 0,53 Source: UN Comtrade (edited), 2017
especially to countries outside ASEAN. That also became a strategy to benefit wider market diversifications thus that could minimize similarity factors which had happened earlier in ASEAN scale.
Performance developments of Philippines and Thailand happening in every year had come along with the reduction of China’s competitiveness tendency. That happened in the middle of China’s export segment when reached the highest value in ASEAN+3. That condition showed that ASEAN+3 markets were well and aggresively benefi ted through market segment acceleration by Thailand and Philippines instead of China. The infl uence of horticulture commodity originated from those two countries got bigger, had excelled China especially after period 2004 or since the enforcement of ACFTA agreement.
According to fi gure 2, the infl uence of those three countries was very dominant in intra-ASEAN+3. If viewed from the fl uctuation, the best RCA value movement trend occured in Thailand. That was caused by Thailand’s potency distribution on various horticulture commodity groups which were equal thus affect the level of performance dependency and stability aggregately.
On ASEAN+3 level, Thailand and China showed the most well distribution competitiveness with the competitiveness in each horticulture commodity group. That was different in Philippines which only
had competitiveness in fruit products but its RCA value reached 12,39. Aggregately that caused Philippines’ competitiveness fluctuation relatively high compared with the other countries especially Thailand and China. Nevertheless, that condition also illustrated that Philippines tended to specialize fruit products. That Specialization consistently happened both in intra-ASEAN and intra-ASEAN+3. In the other commodity groups, Thailand stood out on vegetables, Malaysia stood out on fl oriculture, while China stood out on plant-derived biopharmaceuticals.
to carry out reformation of trade facilities in order to improve export performances, especially for those developing countries, s u c h a s I n d o n e s i a ( P e r e z , 2 0 1 2 ) . Furthermore, table 2 also showed several changing in competitiveness positions of commodity groups. The plant-derived biopharmaceuticals group which was held by Malaysia then was taken by China and Thailand. The fruits group was still held by Philippines with Thailand and China became its main competitor. On vegetables group, Thailand appeared with very strong competitiveness on fi rst position before China. On floriculture group, the RCA of Malaysia still showed the highest competitiveness before Thailand which appeared with significant improved performance compared to performances on ASEAN level. Aggregately, China became the main competitor for Philippines and Thailand and partially became the main competitor for each leading country in every commodity group. Thailand and Philippines which were Indonesia’s bench mark in ASEAN level had risen to be important players with their capability to benefi t the openess and the expanding markets in ASEAN+3 frameworks. That became a challenge for Indonesia, whether to grow to be an active player or a passive player which would result in Indonesia to be other markets’ target in the future.
In the effort to defend domestic product, the government’s issued import
limitation policy which was stated in H o r t i c u l t u r e C o m m o d i t y I m p o r t Recommendation (RIPH) through the Ministerial Regulation of Agriculture No: 60/PERMENTAN/OT.140/9/2012 which had been in force since January 2013 (Pusat Sosial Ekonomidan Kebijakan Pertanian, 2012). That policy had led to some export and then trade balance performances improvements in the last two years of this research although not so significantly. The trade balance can be an indicator of successful or unsuccessful competition in trading. Meanwhile, the value of the export-import unit determines the price or quality competition (Bojnec and Ferto, 2012).
The Similarity of Indonesia
Intra-ASEAN+3 Horticulture Commodity
Export Structure
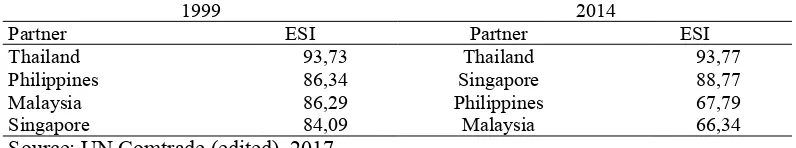
The structure of Indonesia horticulture export to ASEAN had consisted of 63,44% of fruit products, 30,92% of vegetable products, 2,28% of fl oriculture products, and 3,36% of plant-derived biopharmaceuticals products since the period of 1999-2014. On those product compositions, Indonesia had export similarity which was the most consistent with Thailand and Singapore. On the end of period, the ESI between those two countries showed the highest value. There were competitiveness improvements but not so signifi cantly. Conversely, Malaysia and Philippines experienced the contrary. Until the end of period, Philippines and Malaysia proved to be on the least two similarity positions.
The highest export similarities experienced with Thailand confi rmed that since the begining the endowment factor similarityhad been the biggest competitiveness booster for those two countries. The biggest commodity groups which became the competitiveness contributors were fruit and vegetable with a very close export segment scale. On the other hand, that was interesting that there was high similarity between Indonesia and Singapore. Geographically, Singapore was a country with a very small farm land compared to Indonesia. Moreover, that country was more known to be an industry country than an agrarian country.
Singapore imported great amount of horticultural products from Indonesia with consideration of geographical distance and export restriction from China, to be re-exported in form of their derivative products with their own branding. In this case, Singapore takes the value-added products through its downstream industries. It was supported by the availability of special harbor for horticultural products which enabled effi ciency of products fl ow, especially from its neighboring countries. It could be a threat for Indonesia, as mentioned in (Sari, 2010) where Indonesia’s competitiveness decreased because competitors re-exported commodities from Indonesia which had undergone industrialization process and became higher-grade commodities.
floriculture, and 3,26% plant-derived biopharmaceuticals.
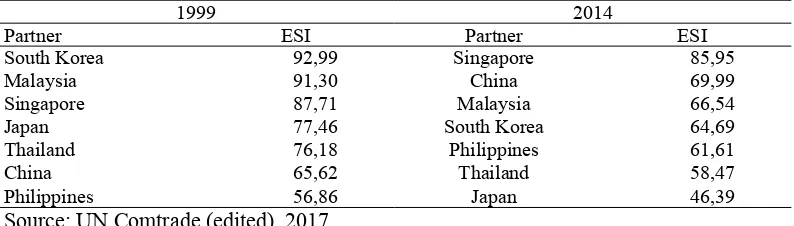
Similarity level which brings implication on competition potential with each member also shows a very different ranking compared to the ASEAN level. In ASEAN+3 level, Indonesia is implied to have fiercest competition with Singapore in the end ofperiod. It is indicated by the highest ESI compared to the other countries (85,95). The index did not change significantly compared to the beginning of the period (87,71) as indicated by table 4. It means that the two countries remain in a good competition in ASEAN and ASEAN+3 level from time to time. Through its special harbor, Singapore imported horticultural products
not only from Indonesia but also from Malaysia, Thailand and Philippines. The greatest contributors to the competition were various fruits and vegetables. The decrease during 1999-2014 was caused by the decrease of Singapore’s market share particularly in vegetable. It was in line with increasing consumption demand of vegetables in Singapore so that the import was not proportional with the export.
South Korea, which initially was in the highest position of competition with Indonesia, had a quite signifi cant decrease of ESI index until the end of the period. It was mainly caused by the decrease in South Korea fruits and Indonesian vegetables market share. A decrease of Malaysian fruit market share also caused a signifi cant Figure 3.ESI of Indonesian Horticulture in Intra-ASEAN
Source: UN Comtrade (edited), 2017
Table 3. The Change of Indonesia Competition Level in Horticulture Commodity Trade in Intra-ASEAN
1999 2014
Partner ESI Partner ESI
Thailand 93,73 Thailand 93,77
Philippines 86,34 Singapore 88,77
Malaysia 86,29 Philippines 67,79
Singapore 84,09 Malaysia 66,34
shift of ESI. On the other hand, China went up to the second position in the end of the period even though the ESI increase was not really high. It means that the level of competition between Indonesia and China before and after ASEAN+3 was relatively the same. China’s export structure was dominated by various vegetables, while Indonesia’s by balanced proportion of fruits and vegetables.
Thailand and Japan also had quite significant ESI shift until the end of the period while Philippine’s index increased. The opposite conditions between Thailand and Philippines were caused by Philippine’s export preference which was
more oriented to ASEAN+3 market with faster acceleration of share compared to Thailand, especially regarding various fruit products. Fruits nearly became the only source of competition between Philippines and Indonesia. On the other hand, Thailand’s share in ASEAN+3 market was dominated by various vegetables. Meanwhile, ESI decrease with Japan was caused by a signifi cant change of Japan’s structure. There was a decrease in Japan’s share of various fruits and vegetables, while Indonesian’s market share was still higher. However, Japan’s increasing share of fl oriculture was not followed by Indonesia’s share of the same product. Figure 4.ESI of Indonesian Horticulture in Intra-ASEAN+3
Source: UN Comtrade (edited), 2017
Table 4. The Change of Indonesia Competition Level in Horticulture Commodity Trade in Intra-ASEAN+3
1999 2014
Partner ESI Partner ESI
South Korea 92,99 Singapore 85,95
Malaysia 91,30 China 69,99
Singapore 87,71 Malaysia 66,54
Japan 77,46 South Korea 64,69
Thailand 76,18 Philippines 61,61
China 65,62 Thailand 58,47
Philippines 56,86 Japan 46,39
CONCLUSION AND SUGGESTION
Conclusion
Market extension after ASEAN+3 integration brings weak competitiveness performance of Indonesian horticultural commodities, both aggregate and partial. The average Indonesia’s RCA decreased from 1,64 in 1999-2014 to 0,45 in ASEAN+3 level. ASEAN+3 market is dominated by three main exporters: Philippines, Thailand and China. Further analysis shows that Indonesia has high export similarity of horticultural in ASEAN and the highest index occurred in trade with Thailand (93,77). ASEAN+3 integration has changed trade scheme in which general ESI with each member decreased though the decrease was not signifi cant. In ASEAN+3 market, Indonesia has the highest similarity with Singapore on ESI index of 85,95 which is relatively consistent with its index in ASEAN level. The similarities of export between Indonesia and the other members are relatively high (above 50). The only exception is similarity between Indonesia and Japan. Similarity indexes with the other countries are in relatively close sequence of numbers. The implication is that Indonesia has the highest potential of competition with Singapore compared to other countries in intra-ASEAN+3 and generally in relatively equal distribution with the other members. Overall, horticultural commodities trade is still dominated with export similarities
which may lead to potential competition between members.
Suggestion
Intra-ASEAN+3 competitiveness performance and export similarity in this research is an aggregate condition o f h o r t i c u l t u r a l s u b - s e c t o r. We a k competitiveness after integration in ASEAN+3 level with relatively high export similarity may caused by specifi c conditions of each included commodity. This possibility make relevant policy implication will be very much determined by the availability of specifi c information of each commodity especially those which play important roles in infl uencing aggregate horticultural dynamics. In addition, market potential of ASEAN+3 for Indonesia’s horticultural trade is very great. Meanwhile, researches in the context of Indonesian agriculture, either aggregate or partial, is still limited. On the other hand, other countries, particularly China, have massively conducted research regarding this topic. It is important since the integration of ASEAN+3 will continue creating dynamic horticultural market which leads to a need of specifi c interventionist policies.
competitiveness in ASEAN+3, especially plant-derived biopharmaceuticals. This commodity is relatively specifi c in terms of its endowment factor since it can be found only in certain countries. Long term optimal management will support Indonesia to specialize in this horticultural product and encourage aggregate horticultural performance improvement. In addition, development of downstream industries and support of trading infrastructure are also important to increase products’ added value and trade fl ow. Finally, those will help Indonesia to be able to make the most of ASEAN+3 integration.
REFERENCES
Abu, H.R.A., Shoumann, N.A., and Xuexi, H. 2012. Exploring Egypt trade: dynamics and prospects. Journal of Economic Studies 39(3): 314-326.
Arifi n, B. 2013. On the competitiveness and sustainability of the Indonesian agricultural export commodities. ASEAN Journal of Economics, Management and Accounting 1(1): 81-100.
Balassa, B. 1965. Trade liberalization and revealed comparative advantage. The Manchester School of Economics and Social Studies 33(2): 9-123.
B o j n e c , S . , a n d F e r t o , I . 2 0 1 2 . C o m p l e m e n t a r i t i e s o f t r a d e advantage and trade competitiveness measures. Applied Economics 44: 399-408.
Eastpring Investments Indonesia. 2016. Kehadiran sang penantang. http:// eastspring.co.id.[31 Desember 2016].
Erwidodo. 2014. Memperkuat daya saing produk hortikultura: strategi menghadapi MEA 2015. Badan Penelitian dan Pengembangan Pertanian. Jakarta Selatan.
Finger J.M. and Kreinin, M.E. 1979. A measure of export similarity and its possible uses. Economic Journal 89: 905-912.
Fundira, T. 2013. An analysis of Africa’s export performance and export similarity for select countries within the Tripartite Free Trade Area market. Trade Law Center Trade Brief S13TB 03(10): 1-23.
Gul, A. 2014.Analyzing Pakistan’s trade opportunity with Turkey. The Lahore Journal of Economics 19: 349-370.
Hermawan, I. 2016. Dayasaingrempah Indonesia di pasar ASEAN periode pra dan pasca krisis ekonomi global. Buletin Ilmiah Litbang Perdagangan 8(2): 153-178.
Krugman, P. 1991. The Move Toward Free Trade Zones, in Policy Implications of Trade and Currency Zones. Kansas City, Wyoming, Federal Reserve Bank of Kansas City. Kwan, Y.K., and Qiu, L.D. 2010.The
ASEAN+3 trading bloc. Journal of Economic Integration 25(1): 1-31.
Lapipi. 2005. Analisis Efek Integrasi Ekonomi Asean dan Manfaatnya Bagi Perdagangan Negara-Negara ASEAN. Universitas Indonesia, Depok.
Peters, E.D. 2008. The impact of China’s global economic expansion on Latin America. World Economy & Finance Research Programme, 4: 1-55.
Perez, A.P., and Wilson, J.S. 2012. Export performance and trade facilitation reform: hard and soft infrastructure. Journal of World Development 40(7): 1295-1307.
Pusat Sosial Ekonomi dan Kebijakan P e r t a n i a n . 2 0 1 2 . C u p l i k a n P e r a t u r a n M e n t e r i P e r t a n i a n N o : 6 0 / P E R M E N T A N / O T . 1 4 0 / 9 / 2 0 1 2 T e n t a n g R e k o m e n d a s i I m p o r P r o d u k Hortikultura. Analisis Kebijakan Pertanian 10(3): 289-297.
Sari, P.S., dan Hartono, S. 2010.Analisis dinamika ekspor minyak nilam
Indonesia ke Amerika Serikat. Jurnal Agro Ekonomi 17(1): 19-28.
Sinaga, L.C. 2010. Indonesia di tengah k e s e p a k a t a n A C F TA . J u r n a l Penelitian Politik 7(2): 1-13.
Sudsawasd, S. 2012. Trade integration in East Asia: an empirical assessment. Modern Economy 3: 319-329.
Wang, L. 2015. An analysis of trade structure, comparative advantage and complementarity of agricultural p r o d u c t s b e t w e e n C h i n a a n d Main East Asian countries. Asian Agricultural Research 7(15): 14-20.