SERVICE PROVISION IN THE HOTEL INDUSTRY: A CASE STUDY
OF SURABAYA PLAZA HOTEL
Yusak Anshori
Doctorate Candidate Airlangga University Surabaya General Manager Surabaya Plaza Hotel Executive Director Surabaya Tourism Promotion Board
e-mail: yusak@sby.pphotels.com
Viviane Langner
School of Economics, INHOLLAND Hogeschool Haarlem, Netherlands e-mail: vivihome77@gmx.net
Abstract: Surabaya Plaza Hotel (SPH) is very well accepted by its present clientele, but nonetheless the guests have a few factors of complaint. The overall image of SPH is highly positive. SPH also provides superior quality and services. Providing the guests with satisfactory services and experiences is a key to success in the hotel industry. In order to reach a supreme level of customer satisfaction, the guests’ opinions and ideas should be employed on ongoing processes of total quality management.
Keywords: hospitality, services, customer satisfaction, improvement, competition, total quality management, Six Sigma.
Customer service is an organization’s ability to supply their customers’ wants and needs (Ward, 2007, p. 1). Customer is defined as anyone who receives that which is produced by the individual or organization that has value. Customer expectations are conti-nuously increasing. Brand loyalty is a thing of the past. Customers seek out products and producers that are best able to satisfy their requirements. A product does not need to be rated highest by customers on all dimensions, only on those they think are important (Kotelnikov, 2007, p. 1).
Customer satisfaction is a critical component of profitability. Exceptional customer service results in greater customer retention, which in turn results in higher profitability. Customer loyalty is a major contributor to sustainable profit growth. To achieve success, you must make superior service second nature of your organization. A seamless integration of all components in the service-profit chain – employee satisfaction, value creation, customer satisfaction, customer loyalty, and profit and growth – links all the critical dynamics of top customer service. Sadly, mature companies often forget or forsake the thing that made them successful in the first place: a customer-centric business model. They lose focus on the customer and start focusing on the bottom line and quarterly results. They look for ways to cut costs or increase revenues, often at the expense of the customer. They forget that satisfying customer needs and continuous value innovation is the only path to sustainable growth. This creates opportunities for new,
smaller companies to emulate and improve upon what made their bigger competitors successful in the first place and steal their customers (p. 1).
In general, the hospitality industry can be characterized as highly saturated, with travellers that are ever more experienced and informed. Thus, it is an extremely competitive environment. Implementing a service quality or customer satisfaction management program to provide the hotel guests with exceedingly satisfactory services and experiences, therefore, has become an industry norm in the past three decades. High service quality and customer satisfaction have been proven to result in increased return rates of customers.
Acknowledging this prerequisite for success, the key aims of this research are 1). to gain insight into the concepts regarding customer satisfaction in the hotel industry; and 2). to explore the very needs and wants of Surabaya Plaza Hotel’s guests in order to discover the opportunities a hotel Management has in improving the experiences of current guests and in becoming most competitive in winning new custom-mers.
Tabel 1. Direct Competitor Analysis January-December 2004
Hotel 4* Occupancy Rev.PAR (Rupiah)
Market Share
Fair Market Share Surabaya Plaza Hotel 81.1% 199,680 20.6% 16.1%
Novotel 71.7% 156,678 18.2% 16.1%
Somerset 63.4% 156,031 29.8% 29.8%
Garden Palace 57.4% 121,152 24.5% 29.5% Hilton (Singgasana) 37.4% 82,297 5.6% 9.5%
TOTAL 63.4% 146,242 100% 100%
Source: Hotel Data Report Casa Grande Surabaya 2004
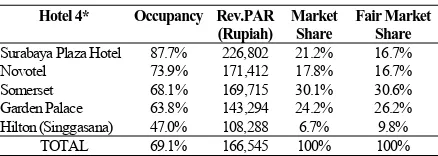
Tabel 2. Direct Competitor Analysis January-December 2005
Hotel 4* Occupancy Rev.PAR (Rupiah)
Market Share
Fair Market Share Surabaya Plaza Hotel 87.7% 226,802 21.2% 16.7%
Novotel 73.9% 171,412 17.8% 16.7%
Somerset 68.1% 169,715 30.1% 30.6%
Garden Palace 63.8% 143,294 24.2% 26.2% Hilton (Singgasana) 47.0% 108,288 6.7% 9.8%
TOTAL 69.1% 166,545 100% 100%
Source: Hotel Data Report Casa Grande Surabaya 2005
Tabel 3. Direct Competitor Analysis January-December 2006
Hotel 4* Occupancy Rev.PAR (Rupiah)
Source: Hotel Data Report Casa Grande Surabaya 2006
Furthermore, the position of SPH in the market can be narrowed down to defining it as a business hotel, as it is focussing on business travellers and not on the leisure market. Yet, although providing several meeting rooms, SPH is not specialized as much on the MICE sector as some other hotels in Surabaya. The target market of Surabaya Plaza Hotel is divided into two main groups; since SPH is a business hotel, their key target is corporate clients (broken up into four distinguishable groups), yet walk-in/individual guests also represent a small percentage of all guests. Moreover, the hotel may also have some guests that are not directly their customers.
LITERATURE REVIEW
Creating Total Customer Satisfaction
Increasing competition (whether for-profit or nonprofit) is forcing businesses to pay much more attention to satisfying customers. The role of customer satisfaction in the overall context of product or service
development and management. Customer satisfaction is defined as overall attitude regarding a good or service after its acquisition and use it is a post choice evaluate judgement resulting from a specific purchase selection (Mowen, 1995, p. 511). The factor most important to satisfaction is the level of performance of the product; if the level of product quality is high, customer tend to be satisfied, even if the expected such levels of performance (McNamara, 2007, p. 1).
According to Wikipedia (version 1.2, 2002, pp. 1-2) “The Six Sigma process was originally definedas a methodology to reduce defect levels below 3.4 Defects Per Million Opportunities (DPMO)”. In addition to Motorola, companies which also adopted Six Sigma methodologies early-on and continue to practice it today include Bank of America, Honeywell International and General Electric. Six Sigma as a problem-solving approach has traditionally been used in fields such as business, engineering, and production processes.
At its core, Six Sigma revolves around a few key concepts, which are the following:
♦ Critical to Quality: Attributes most important to
the customer
♦ Defect: Failing to deliver what the customer wants ♦ Process Capability: What your process can deliver ♦ Variation: What the customer sees and feels ♦ Stable Operations: Ensuring consistent, predictable
processes to improve what the customer sees and feels
♦ Design for Six Sigma: Designing utilizing tools,
training and measurements to enable a company to design products and processes that meet customer expectations and can be produced at Six Sigma Quality.
There are two different approaches to these con-cepts (Wikipedia, 2002, p. 3):
1) DFSS (Design for Six Sigma)
2) DMAIC (Define, Measure, Analyze, Improve and Control): It is systematic, scientific and fact-based process for continued improvement. It eliminates unproductive steps, often focuses on new measure-ments, and applies technology for improvement.
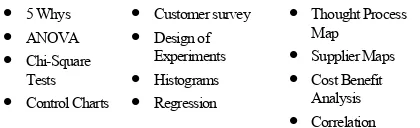
Table 4. Key Tools Used for Six Sigma
• 5 Whys • ANOVA • Chi-Square
Tests • Control Charts
• Customer survey • Design of
Experiments • Histograms • Regression
• Thought Process Map
• Supplier Maps • Cost Benefit
Analysis • Correlation Source: Wikipedia, 2002
According to Powers and Barrows (2006, p 633) Six Sigma has become an element of many Total Quality Management (TQM) initiatives. The concept has been around for almost 20 years now and originated, as many theories and techniques do in the manufacturing segment. It was first used by Motorola and later embraced by General Electric, among others. It has only recently been introduced to the hospitality industry, through, when Starwood Hotels adopted it into their hotels in 2001.
Six Sigma is a statistically based business strategy that companies attempt to apply to help in reducing (and virtually eliminating) defects in products and services. In the case of the hospitality Industry, in theory, it could be used to improve services from hotel check-in to waiting times for tables in restaurants.
Total Quality Management(TQM)
Total Quality Management is a management strategy aimed at deeply involving awareness of quality in all organizational processes. Total Quality is a description of the culture, attitude and organization of a company that aims to provide, and continue to provide, its customers with products and services that satisfy their needs. The culture requires quality in all aspects of the company’s operations, with things being done right first time, and defects and waste eradicated from operations (Stark, 1998, p1).
TQM requires that the company maintains this quality standard in all aspects of its business. This entails ensuring that things are done right the first time and that defects and waste are eliminated from operations. “Total Quality (TQ) provides an umbrella under which everyone in the organization can strive and create customer satisfaction. TQ is a people-focused management system with the objective of constant increase in customer satisfaction at continually lower real costs”(Wikipedia, 2002, p1).
Hansen (2005, p 4) mentioned that the principles of TQM are as follows:
♦ Quality can and must be managed. ♦ Everyone has a customer and is a supplier. ♦ Processes, not people are the problem. ♦ Every employee is responsible for quality. ♦ Problems must be prevented, not just fixed.
♦ Quality must be measured.
♦ Quality improvements must be continuous. ♦ The quality standard is defect free.
♦ Goals are based on requirements, not negotiated. ♦ Life cycle costs, not front end costs.
♦ Management must be involved and lead. ♦ Plan and organize for quality improvement.
Moreover, the ten steps to TQM are the follow-ing:
1. Pursue new strategic thinking 2. Know your customers
3. Set true customer requirements
4. Concentrate on prevention, not correction 5. Reduce chronic waste
6. Pursue a continuous improvement strategy
7. Use structured methodology for process
improvement 8. Reduce variation 9. Use a balanced approach
10. Apply to all functions (Hansen, 2005, p3)
TQM has been widely used in manufacturing, education, government, and service industries, as well as NASA space and science programs. Companies who have implemented TQM include Ford Motor Company, Motorola, and Toyota Motor Company.
PRIMARY RESEARCH METHOD
It shall be guaranteed that the research was carried out objectively, critically, logically, and diligently. In order to find out how SPH could attract more customers and improve its present services and overall quality it was necessary to find out how satisfied the guests of SPH currently are and what kind of factors influence them to come back to Surabaya and to the hotel and which factors keep them from doing so. Second, it was important to discover how exactly the familiarity, the good image, and the positive experiences of the guests could be enhanced in future marketing and promotion campaigns.
As it was regarded most appropriate to theorise before beginning the research inquiry, the following theory was brought up in order to have a formal statement on which to base the research: ‘SPH needs to improve its quality of services and products (physical hotel improvements) in order to host fully satisfied guests.’ This statement is merely a theory and does not reflect any hard facts. The population of focus in the research was all general guests – corporate and walk-in – staying in the rooms of SPH.
possible to reach a qualitative and useful result, before starting any research first a concrete research plan was set up, including the types of information and sources that would be needed. When starting the desk research, first particular sub-questions were designed to lead the inquiries. These were:
1. What are the special (business) tourism features of Surabaya?
2. What does SPH have to offer?
3. What are the general needs and wants of the guests at Surabaya Plaza Hotel?
4. What is the current image of SPH among the target group?
Very positive
Positive
Very positive Negative
5. What does SPH recently do to promote itself and how can efforts be made more effective and efficient, how can they be more tailored to the needs of the target market?
As primary research style, the survey method was chosen as the most appropriate and effective means in exploring the thoughts, opinions, and attitudes of the guests. That entailed the design two different self-administered questionnaires to be completed by the respondents themselves, one questionnaire for each of the basic segments: guests staying in the rooms and guests using the banquet facilities. The questionnaires were designed with great care, for it was supposed to be easily understandable in question formulation and instruct-tions. Yet, many different, improved versions of both questionnaires were produced, as ever new imper-fections and obscurities for the respondents became apparent. The research approach was quantitative, since numeric data was collected, the research settings were impersonal and controlled, and the process and procedure of data collection were rational and scientific.
It was decided that the first questions should be very general, followed by the key questions, the rather personal information should be asked in the very end. To fill the questionnaire was not supposed to take more than four to five minutes, the length of the questionnaire being two pages.
Then the distribution was started, and every individual of the population was given a rather equal chance of being included in the research, since the distribution system entailed handing the questionnaire to all check-out guests. A total of 300 questionnaires was collected in the period from 23 February to 23 March 2007.
After collecting the data, the information from the guests was processed with the SPSS software. With this program, special charts and tables could be created on the various aspects that had been determined to be analysed.
Finally, a conclusion and specific recommenda-tions were put together, representing an evaluation of the results of the field research and explaining the consequences that preferably should be taken by the management of SPH.
PRIMARY RESEARCH FINDINGS
The first (open) question in the survey was how many times the respondent had stayed at the hotel until the day of filling the questionnaire. With only seven missing answers, the response with the highest percentage of all valid answers was “2-5 times” (39.6%), followed on second place by “1 time” (33.4%). Only one respondent had stayed above 100 times. Overall, most people had stayed between one and ten times at SPH.
Then, SPH wanted to find out how many days the guests stayed on average. There were no missing values, and the most-given answer, with 70%, was “1-2 nights”. On the other side, only 1% said that they generally stayed longer than two weeks.
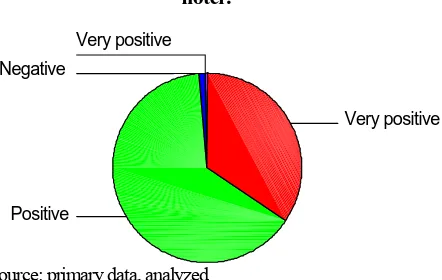
In the next question the respondents were asked what their overall image/first impression of the hotel was. The scale of possible answers ranged from “very positive” to “very negative”. The overall outcome as can be seen at figure 1 was very much in favour of SPH. With no missing values, the most-frequent reply was “positive” (64.3%), followed by “very positive” with 34.3%. Only three people replied “negative” and one “very negative”.
What is your overall image/first impression of this hotel?
Source: primary data, analyzed
Figure 1. Overal Image/First Impression Towards SPH
Furthermore, SPH wanted to discover how much the respondents agreed on three different statements about the hotel. For all three statements there were 25 missing cases, so that 275 valid cases could be recorded for each. The first statement was “This hotel is offering me all the facilities and services I need”. The responses were very positive, with 72.7% for “agree” and 21.5% for “strongly agree”. Besides, 15 guests chose “neutral”, only 1 guest replied with “disagree”, and there were no guests answering “strongly disagree”.
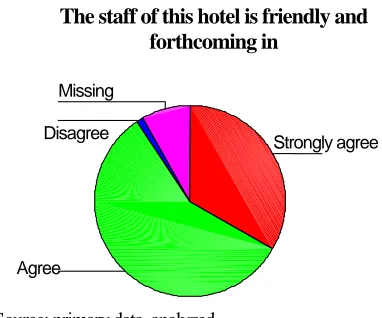
The second statement was “The staff of this hotel is friendly and forthcoming in providing the services I need”. Most responses on this shown at figure 2 were positive as well: 62.5% opted for “agree” and 36.4% for “strongly agree”. Only three guests chose “neutral”, while there were no replies for “disagree” or “strongly disagree”.
The staff of this hotel is friendly and forthcoming in
Source: primary data, analyzed
Figure 2. Friendliness of SPH Staff
The most positive responses were given for the third statement, which was “This hotel is situated in a very strategic location”. A total of 99.3% of all valid answers related to “strongly agree” (49.1%) and “agree” (50.2%). There were no guests that chose “strongly disagree” or “disagree”, and only 0.7% opted for “neutral”.
Question 12 of the questionnaire was designed as multiple-answer question and to find out what particular aspects the guests were especially satisfied with while staying at SPH. The number of missing cases was 66, so that 234 cases were valid. With a total of 430 responses, there was an average of 1.84 answers per person. There were a total of 18 categories and the five factors that were mentioned by most guests were:
1] “Service” (24.9%)
2] “Staff” (17%), especially regarding the reception personnel
3] “Rooms” (16.3%), particularly concerning the size and the cleanliness
4] “Food” (10.5%), often just in general but many times also about the variety and quality of the breakfast menu
5] “Location” (9.8%), mainly because the hotel is situated in the city centre and is close to business activities/offices, across from the World Trade Centre (WTC) building and next to Surabaya Plasa mall. In addition to those top five there were two other points that found rather high mentioning, namely “cleanliness” (35 people) and “facilities” (23 people).
The next question asked the respondents whether or not they would recommend the hotel to others. The outstanding result was that, although there were 13 missing cases, of the 287 valid answers 98.6% were for “yes”. Therefore, only four people said they would not recommend the hotel to somebody else. This supports the outcomes of question 4, where most guests stated their image of SPH was highly positive.
The last questions concerned the respondents’ demographics. Question number 14 was about the gender of the guests. The result was that seven people did not (want to) indicate their age, and 84% of the valid answers were “male”, while 16% were “female”. In question 15 the guests were asked for their age. There were 12 missing cases, and the age range with the highest response rate (42.4%) was “31-40”. On second place, with 24%, was “20-30”, followed on third place by “41-50” (23.6%). Only three guests reported their age to be “above 60”, and 26 reported to be “51-60”. This shows that the people staying at SPH are rather young.
Missing
Disagree
Strongly agree
Agree
What is your age?
Source: primary data, analyzed
Missing above 60
51-60 20-30
41-50
31-40
Besides all the above aspects, SPH also wanted to discover what other activities (besides business) the guests might generally be interested in when visiting Surabaya and the hotel. Seven different options were given in the questionnaire, plus one option “not interested”. This was a question where the guests could give multiple responses, so that there was a total of 388 responses, meaning an average of 1.54 answers per person. The three activities with most interest from the respondents were “dining” (94 people), “shopping” (90 people), and “having a city tour” (88 people). Also much asked-for was “day trips” (74 people), while the least popular activity was “health and beauty” (7 people). Medium-popular were “”culture and history” (21 people) and “golf” (14 people).
Analysis of Paired Questions
This section will consist of a short summary of the analysis of paired up questions that were regarded as most fitting and that provided useful information for later recommendations for the hotel management. First, questions 4 (image) and 8 (satisfaction with facilities and services) were paired up. The result was that the better an overall image the guests have, the more positive will be their perception of the facilities and services. In fact, 42 people with a very positive image of SPH also strongly agreed and 48 agreed that the hotel was offering them all the facilities and services they needed. In addition, of the guests that had a positive image of SPH another 17 also strongly agreed and 148 agreed that the hotel was offering them all the facilities and services they needed. Moreover, there was nobody who had a very positive image of SPH and who strongly disagreed that the hotel was offering them all the facilities and services they needed. On the other side, there is no obvious inverse correlation between the factors, since there was no guest with a very negative image of SPH who also strongly disagreed that the hotel was offering them all the facilities and services they needed.
Second, questions 4 (image) and 9 (satisfaction with staff) were paired up. Like in the previous combination of answer categories, many of the guests with a very positive or positive image of the hotel actually also strongly agreed or agreed that the staff of SPH was friendly and forthcoming in providing the services the guests needed. Hence, a positive correlation between the two aspects can be confirmed. Yet, there was only one respondent with a very negative image of SPH who also disagreed with the statement, so that an inverse correlation is not confirmed.
Third, questions 4 (image) and 10 (satisfaction with location) were paired up. The hypothesis was that that the more positive the guests’ general image, the more they were also satisfied with the location of SPH. In fact, from the crosstable outcomes it was proven that once again most respondents with a very positive or positive image of SPH also strongly agreed (69 and 63) or agreed (26 and 111) on the statement. Yet, also in this case a negative or very negative image did not cause the guests to disagree with the statement.
Fourth, questions 4 (image) and 13 (recommend or not) were paired up. The supposition was that if the guests had a good image of SPH, they would also recommend it to somebody else. Indeed, this was apparently confirmed by the data, which showed that of the guests that would recommend the hotel to someone else, 101 had a very positive and 180 a positive overall image of SPH. On the other hand, the ones who would recommend it, none had a very negative and only two a very negative image of SPH. Moreover, only one person that would not recommend the hotel had a very negative image and one other had a negative image. Yet, none of the respondents who would not recommend SPH had a very positive image of it and only two had a positive image.
Fifth, questions 6 (leisure activities - shopping) and 14 (gender) were paired up in order to find out whether it was mainly women who were interested in shopping or also men. In fact, in the data it could be found that of all male guests 68 said they were interested in shopping, while only 19 female guests agreed on an interest in shopping. Moreover, 167 male respondents reported not to be interested in shopping, while 28 female guests said they were not interested. This might seem like a rather bizarre imbalance. Yet, it has to be considered that the percentage of male respondents (84%) was much higher than that of the female respondents (16%). Therefore, the above-mentioned numbers cannot be used as they are to confirm the hypothesis. Now, the main indication to see whether or not mainly women are interested in shopping lies in the fact that not all men said “no”, and not all women said “yes”. Hence, although the overall number of female survey participants was low, not all women reported interest in shopping, while many men did. Thus, interest is rather spread out among the two genders.
Yet, although 14 men said they would be interested in golf, there were also 221 that reported they were not interested.
Seventh, questions 6 (activities - city tour) and 15 (age) were paired up to determine if older people were more interested in city tours than younger people. The crosstable with the data outcomes showed that between the ages of 20 and 40 there were a combined total of 67 interested people, while all the other age groups had a combined number of 20 people with interest. This stands in contrast with what had been expected, since the age group of people that were interested in city tours was rather young, not old.
Finally, questions 6 (activities - day trips) and 15 (age) were paired up to find out whether younger guests at SPH were more interested in day trips than are older guests. When looking at the crosstable, it could be seen that the largest age group of interested people was between 31 and 50, with a total of 46 guests. There were only 17 younger guests that were interested, and only seven older than 31 to 50. Hence, the initial theory that younger people should be more interested in city tours than older people was neither confirmed nor denied, as the age of the interested guests was neither particularly young nor old.
CONCLUSIONS AND RECOMMENDATIONS
The key conclusion of the primary research is that Surabaya Plaza Hotel is very well accepted by its present guest clientele, but nonetheless the guests have a few factors of complaint. These weak points of SPH will have to be eliminated as quickly as possible in the ambition to provide complete customer satisfaction, facilitate total quality management at the hotel and remain competitive.
From the primary research it can be concluded that the overall image among SPH’s guests is positive or very positive. Moreover, the three questions regarding the facilities, services, staff, and location of SPH showed that most respondents were very satisfied with those factors. In addition, service, staff, rooms, food, and location were mentioned by the highest percentage of guests as the features of the hotel they were most satisfied with. Besides, almost all respondents stated they would recommend SPH to others.
These results can be regarded as a great proof that SPH is providing superior quality and services. Also, almost 80% of all respondents said they preferred the 4-star hotel category over the 3-, or 5-star categories. Yet, all the above are no ultimate facts and no absolute proof that SPH is providing ideal customer satisfaction and has an effective system of total quality manage-ment.
What is more, the research proved that currently most guests have not stayed very many times at SPH, which might show that there are constantly new people who try the hotel. On the other hand, it could also be a proof for insufficient customer loyalty and an indication that after trying SPH, people decide to try another hotel or move back to their established hotel(s) of preference. Then, present guests also typically have very short stays at SPH, most of them only staying for one or two nights. This should prospectively be changed by means of new promotions, packages and events at the hotel. It might be a difficult task considering that most guests at SPH are busy business people, yet the longer the guests will stay at the hotel, the more loyalty it might build and the more revenues it can bring for SPH.
Furthermore, looking at the gender of present guests it can be said that almost 85% are male. This result could be a reason to think about how much SPH should be oriented towards the needs of female guests versus male guests. In addition, the people staying at SPH are rather young, most of them with an age between 20 and 40. This is another factor that might be worth of some consideration in designing hotel promotions and packages.
Additionally, the relation between gender, age and interest in non-business activities represents an important aspect to consider for the sales and promotion activities of SPH. Since the four most sought-after activities were dining, shopping, city tours and day trips, these factors can be of great benefit when promoted or packaged most effectively by SPH. The location of the hotel is optimal for all four activities, which represents a good promotion opportunity. It should be considered that the survey showed that interest in shopping is rather spread out among the two genders, that no female guests replied they would be interested in golf, and that 221 men reported they were not interested in golf. Moreover, when designing promotions it needs to be kept in mind that the age group of people that were interested in city tours was rather young , while the age of people interested in city tours seems neither particularly young nor old.
they provide the primary services for the guests and are typically the main point of communication with the hotel guests. Yet, the Human Resources department can greatly support the other departments by selecting the right employees and giving the right training to all employee levels, while the Sales and Marketing team can convince prospective clients of the quality of service at the hotel.
Finally, the initial hypothesis that SPH needs to improve its quality of services and products in order to host fully satisfied guests can be confirmed from the primary research. While the conceptual theory implies that all hotels should employ strategies of total quality management and Six Sigma in order to reach highest levels of customer satisfaction, which in turn will provide the hotels with competitive advantages.
LIMITATIONS OF RESEARCH
It has to be considered that not all the data from the guest survey can be taken for granted as it is, since there were many factors of influence at the moment each guest filled the questionnaire. It cannot be determined in what mood the guests were, what their mind-set was, which personal factors might have affected their answers, which previous experiences influenced their opinions about their recent stays, or how much their answers were affected by time pressures. Moreover, only 300 guests were surveyed, which is a rather limited sample to represent a much larger total population – considering that in total an approximated 90.000 guests stayed at SPH in 2006 and in the period the survey was conducted there was a total of 7300 guests at the hotel –. Additionally, human and technical mistakes during processing the data with the SPSS software, including small typing errors, can never be eliminated, which means that none of the outcomes can be regarded as 100 percent credible.
REFERENCES
Casa Grande Surabaya. (2004), Hotel data report.
Casa Grande Surabaya. (2005), Hotel data report.
Casa Grande Surabaya. (2006), Hotel data report.
Hansen, D. A. (2005), Total quality management (TQM) Tutorial/help page, [retrieved April 24, 2007 from http://home.att.net/~iso9k1/tqm/tqm. html]
Kotelnikov, V. (2007), “Winning customers: Custo-mer satisfaction- the prime concern of your
business and critical component“, [retrieved
April 20, 2007 from http://www.1000ventures. com/business_guide/crosscuttings/customer_sa tisfaction.html]
McNamara, C. (1997-2007), Product and service management (recurring activities to manage a product or service), [retrieved April 23, 2007
from http://www.management help.org/prod_
mng/prod_mng.htm]
Mowen, J. C. (1995), Consumer behavior, internatio-nal edition, New Jersey: Prentice Hall Inc.
Powers, T., Clayton W. B.. (2006), Introduction to
management in hospitality industry, New
Jersey:John Wiley & Sons.
Stark, J. (1998), A few words about TQM, [retrieved April 23, 2007 from http://www.johnstark.com/ fwtqm.html]
Ward, S. (2007), “Customer service”, Small business: Canada, [retrieved April 20, 2007 from
http://sbinfocanada.about.com/cs/marketing/g/ custserv.htm?p=1]
Wikipedia, the free online encyclopedia, last modified April 17, 2007 from http://en.wikipedia.org/ wiki/Six_sigma