Correlation between Body Mass Index, Gender, and Skeletal Muscle
Mass Cut off Point in Bandung
Richi Hendrik Wattimena, Vitriana, Irma Ruslina Defi
Department of Physical Medicine and Rehabilitation, Faculty of Medicine, Universitas Padjajaran-Dr. Hasan Sadikin General Hospital, Bandung
Abstract Objective: To determine the average skeletal muscle mass (SMM) value in young adults as a reference population; to analyze the correlation of gender, and body mass index to the cut off point; and to determine skeletal muscle mass cut off points of population in Bandung, Indonesia.
Methods: This was a cross-sectional study involving 199 participants, 122 females and 77 males. The sampling technique used was the multistage random sampling. The participants were those who lived in four major regions in Bandung, Indonesia: Sukajadi, Cicadas, Buah Batu, and Cibaduyut.
Results: The average appendicular skeletal mass index (ASMI) in females and males based on body mass index (BMI) were identified. The average ASMI values for normal BMI in females was 5.982±0.462 kg/m2 while the average
ASMI values normal BMI for males was 7.581±0.744 kg/m2
Conclusions: A correlation between BMI and ASMI that was considered statistically significant was found in females (0.7712; p<0.05) and a very significant correlation was seen in males (0.870; p<0.05). The cut off points were defined by the normal BMI, which were 5.059 for females and 6.093 for males.
Keywords:Appendicular skeletal muscle mass index, body mass index, cut off point, gender, skeletal muscle mass
pISSN: 2302-1381; eISSN: 2338-4506; http://doi.org/10.15850/ijihs.v5n2.990 IJIHS. 2017;5(2):47–51
Received:
December 14, 2016
Revised: April 11, 2017
Accepted: August 24, 2017
Correspondence:
Richi Hendrik Wattimena, Department of Physical Medicine and Rehabilitation, Faculty of Medicine, Universitas Padjajaran-Dr. Hasan Sadikin General Hospital
Jl. Pasteur No. 38, Bandung, Indonesia
e-mail: [email protected]
Introduction
Skeletal muscle mass (SMM) is considered as the biggest tissue in human body which covers approximately 40–50% of body mass.1 Composition of SMM may be stable during the age of 20–40 years old and begins to decrease significantly after the age of 45 years old. The decrease in SMM occurs with aging process as a physiological change that is due to decreases in the amount and diameter of muscle fibers. In addition, there are also increases in non-contractile tissues in the muscle compartment, such as in the intramuscular fat and muscle connective tissues.2 These conditions trigger
reduced physical ability, quality of life (Qol), and cardiopulmonary metabolism function. Increases in fall risks, physical disabilities, and even death are also seen.3,4
One of the distinctive ways to measure SMM is by using bioelectrical impedance analysis (BIA). The bioelectrical impedance analysis is commonly considered as a tool to measure body fat and lean body mass which has several advantages compared to other measurement tools. This analysis is also affordable, accurate, easy to use, fast, free from radiation, and can be used done in patients who are bed-ridden without having to mobilize the patients.3,5,6
Recent studies reported that the cut off points of muscle mass can vary in different areas due to the fact that body composition as the main variable is influenced by ethnicity, age, physical activity, gender, and body mass index (BMI).7–11 The body mass index is also considered as a major parameter reflecting the population characteristics that correlate to physical activities and eating habit that will further influence the skeletal mucle mass. Early studies have proposed BMI as one of the parameters in determining the cut off point of SMM, and showed a correlation between BMI and the cut off point. 3,8,12
No SMM cut off point has been used as a benchmark in Bandung because of the lack of normative data related to the amount of muscle mass in adult population based on gender and BMI. Therefore, this study aimed to analyze the correlation between BMI, gender, and muscle mass, as well as defining the SMM average value which is important to determine a cut off point, and to determine the cut off point for decreased SMM based on the skeletal muscle mass index (SMI) in young adult population with normal BMI n Bandung, Indonesia.
Methods
A cross-sectional study has been performed by involving 199 participants selected using the the multistage random sampling approach in 4 different areas, Sukajadi, Cicadas, Buah Batu and Cibaduyut, in the period of January to February 2016. The participants who met the inclusion criteria were adults aged 20–40 years, Bandung citizens, healthy (based on anamnesis and physical examination), and with no risk factors for congenital disease, including diabetes mellitus. The participant candidates who were excluded were those who had weight problems in the last 6 months, consumed medicines or supplements that influenced their body composition, used artificial pacemaker as well as athlete, dan pregnant women.
Muscle mass was measured using BIA single variant type (Tanita BC-601, Tokyo, Japan). This measurement was conducted in stand up position without footwear on the electrode with hand grasping the electrode handle in abduction position. Average SMM value was defined by the average ASMI value in kg/m2. The SMM cut off point was obtained using the Asian Working Group for Sarcopenia (AWGS) reference which is 2 standard deviation (SD)
below the average value of healthy young adult SMM. The BMI value was obtained by using BIA (kg/m2). Body mass index was then classified into underweight (<18.5 kg/m2), normal (18.5–22.9 kg/m2), overweight (23– 24.9 kg/m2), grade I obesity (25–29.9 kg/m2), and grade II obesity (≥30 kg/m2). Informed consent was gained from the participants for their involvement in the study.
Data in this study were analyzed statistically using the normality test, descriptive statistics, t or Mann Whitney U tests based on the data distribution, and Pearson or Spearman correlation tests. The study was approved by the Health Research Ethic Committee, Faculty of Medicine, Universitas Padjadjaran, Bandung, Indonesia.
Results
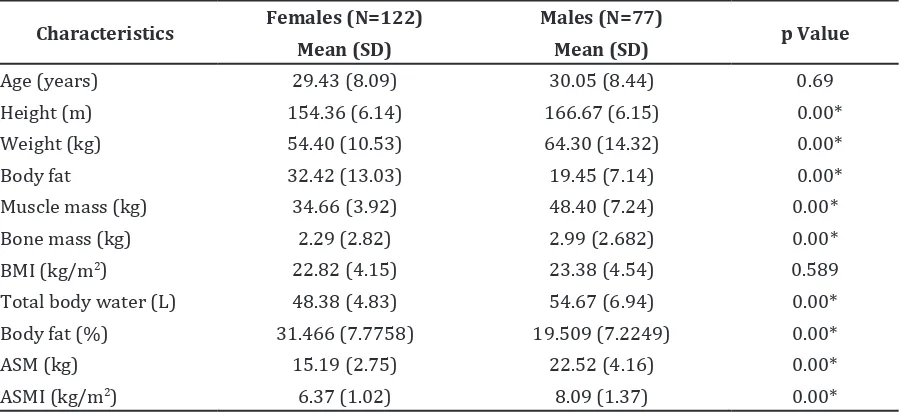
The participants included in this study were 199 subjects consisted of 122 females and 77 males. There was a significant differences in the characteristics between female and male participants except in the age and BMI (Table 1). Therefore, further analyses were performed based on gender.
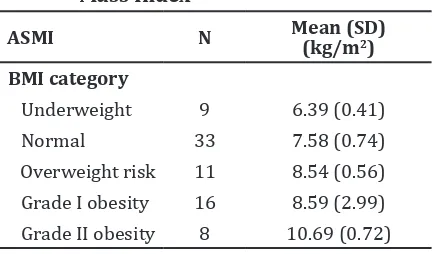
General increase in BMI leads to increase of ASMI value (Table 2 and 3). Based on Spearman correlation coefficient test, this study found a strong correlation between gender and ASMI in both genders [males (r=0.71; p<0.05); females (r=0.65; p<0.05)] and between BMI and ASMI [male (r=0.81; p<0.05); female (r=0.77; p<0.05)], respectively.
The Asian Working Group for Sarcopenia (AWGS) suggest using a 2 standard deviation (SD) below the average SMM value in the young population as a reference of SMM cut off point.5 The cut off point by using BIA was defined by ASMI. The result was obtained through a comparison between total SMM and height squared. The total SMM was measure as the appendicular skeletal muscle mass (ASM) which value was obtained from the total muscle mass off both upper and lower extremities.2,4,10 The cut off points of SMM found in this study were 5.059 kg/m2 in females and 6.093 kg/m2 in males for normal category of BMI.
Discussion
Table 1 Participant Characteristics
Characteristics Females (N=122) Males (N=77) p Value
Mean (SD) Mean (SD)
Age (years) 29.43 (8.09) 30.05 (8.44) 0.69
Height (m) 154.36 (6.14) 166.67 (6.15) 0.00*
Weight (kg) 54.40 (10.53) 64.30 (14.32) 0.00*
Body fat 32.42 (13.03) 19.45 (7.14) 0.00*
Muscle mass (kg) 34.66 (3.92) 48.40 (7.24) 0.00*
Bone mass (kg) 2.29 (2.82) 2.99 (2.682) 0.00*
BMI (kg/m2) 22.82 (4.15) 23.38 (4.54) 0.589
Total body water (L) 48.38 (4.83) 54.67 (6.94) 0.00*
Body fat (%) 31.466 (7.7758) 19.509 (7.2249) 0.00*
ASM (kg) 15.19 (2.75) 22.52 (4.16) 0.00*
ASMI (kg/m2) 6.37 (1.02) 8.09 (1.37) 0.00*
Notes: * p value <0.05; SD= standar deviation; ASM= appendicular skeletal muscle mass; ASMI= appendicular skeletal
muscle mass Index; BMI= body mass index
the consequence of aging process.3,7 In the age of 20–40 years bone stops growing so muscle do not have to adapt to this change anymore, which is characterized by decreasing hormon production, particularly the testosterone, after puberty.13–15
A correlation between gender and MM was found. A strong correlation was also found between BMI and ASMI. These results were similar to a study that reported a different cut off point based on BMI.8 This study also revealed that the SMM cut off points were divided into several types: (a) in females, underweight: 5.15 kg/m2, normal: 5.52 kg/ m2, overweight: 6.39 kg/m2, obesity: 6.77 kg/ m2, and (b) in males, underweight: 7.23 kg/m2, normal: 7.29 kg/m2, overweight: 8.00 kg/m2, obesity: 8.32 kg/m2. These are in line with a finding that the BMI can be used to measure muscle mass which may influence the cut off points.8,16 Meanwhile, the height and weight are the BMI parameters to determine that the human body composition generally consists of water, body fats, proteins, and minerals. These are several underlying rationales that BMI can be used as a proper parameter to observe body changes which may be caused by lifestyles, eating habits, and physical activities.8,16
Differences in muscle mass cut off points between gender were discovered. The result showed that the cut off point in females was lower than males. This result is similar to
the previous studies which revealed a cut off point of 7.26 kg/m2 in males and 5.45 kg/m2 in females. Kim reported a cut off point of 7.40 kg/m2 in males and 5.14 kg/m2 in females.10,11
The cut off points may vary, which is due to the differences in body compositions between males and females.3 Women in general have lower height, lower weight, and shorter bone length, leading to a smaller SMM and higher body fat than men.17 Another study stated that bone length correlates with SMM, the longer bone length, the bigger the SMM is.18 This is in line with the condition that several body movements use SMM and bone length balances.
ASMI N=122 Mean (SD)
(kg/m2)
BMI category
Underweight 15 5.49 (0.31)
Normal 50 5.98 (0.46)
Overweight risk 22 6.77 (1.69) Grade I obesity 25 6.85 (0.54) Grade II obesity 10 7.51 (0.72)
Notes: *SD= standard deviation; ASMI= appendicular skeletal muscle mass; BMI= body mass index
Appendicular Skeletal Muscle Mass Index in Females based on Body Mass Index
ASMI N Mean (SD) (kg/m2)
BMI category
Underweight 9 6.39 (0.41)
Normal 33 7.58 (0.74)
Overweight risk 11 8.54 (0.56) Grade I obesity 16 8.59 (2.99) Grade II obesity 8 10.69 (0.72)
Notes: *SD= standard deviation; ASMI= appendicular skeletal muscle mass; BMI= body mass index
The cut off points in normal BMI found in this study shows that the the results are lower than those of the previous studies. Baumgartner et al.10 in United States reported a muscle mass cut off point of 7.26 kg/m2 and 5.45 kg/m2 for males and females, respectively. Chien in Taiwan stated cut off points of 8.87 kg/m2 in males and 6.42 kg/m2 in females while Tanimoto in Japan presented cut off points of 7.0 kg/m2 in males and 5.8 kg/m2 in females. Kim in Korea discovered cut off points of 6.75 kg/m2 in males and 5.07 kg/m2 in females.6,13,19 These diferences in ASMI and muscle mass cut off points are influenced by gender, race, and physical activity. Therefore, the body composition may differ between race characteristics and rural-urban areas.
The influence of race characteristics toward muscle mass cut off pointwas examined by a study which reported that the Mexicans have lower cut off points than the Caucasians with a comparison of 5.86 to 7.26 in males and 4.72 to 5.45 in females.7 In addition, AWGS discovered that the average ASMI among Chinese is 17% lower than the Caucasians. A study found that different race may cause different body shape sand compositions.17 The northern Chinese have bigger body with bigger SMM than the southern Chinese. Chinese has smaller bone and SMM than the Caucasian.7,8,17 Caucasian Americans have lower body fat compared to Caucasian Europeans. Also, Africans and Caucasians have longer legs and bigger
SMM than Asians. The skeleton and skeletal muscle mass of Asians are smaller than the Caucasians. The Chinese people have lower body fat than Indians and Malayans.17 A study reported that Indonesians have higher body fat than Caucasians but Malay-Indonesians have smaller skeleton and higher body fat than Chinese-Indonesians.18 Lower skeletal muslce mass cut off point in Indonesia found in this study may be caused by diferent ethnic groups which lead to higher body fat with smaller SMM compared to other ethnics. Therefore, different body shape, skeleton, and leg length are several factors of lower cut off points in Indonesia. Race characteristics can be included as a major data in a further study.
A study has revealed that urbanization as well as progresses in transportation and economic development can change people’s physical activities.18 A sedentary lifestyle is one of the factors of higher level of body fat. According to the data in 2013, the physical activity proportions of Indonesian people are ineffective.20 In addition, the Indonesian people sedentary proportion is ≥6 hours per day or 24.1% of the total activities; thus, a further study should be conducted to analyze these incidences. However, this study does not include participant daily physical activities, such as occupation and leisure activities which may influence the results of the study.
In conclusions, the average ASMI in females with normal BMI is 5.98±0.46 kg/m2 and the average ASMI values in males with normal BMI is 7.58±0.74 kg/m2. A strong correlation is found between sex and ASMI and between BMI and ASMI with moderate correlation in females and very strong in males. The cut off point based on normal BMI in females is 5.06 kg/m2 and in male was 6.09 kg/m2.
A further study that also considers race characteristics and physical activities is also needed in order to determine the accurate respondent SMM cut off point. The use of SMM cut off point with BIA can be performed to analyze the decrease of SMM to be able to start early interventions. Immediate intervensions may prevent the SMM decrease and improve the functional capacity status and quality of life.
References
1. Sakuma K, Aoi W, Yamaguchi A. The intriguing regulators of muscle mass in sarcopenia and
muscular dystrophy. Front Aging Neurosci. 2014;6(1):1–17.
Appendicular Skeletal Muscle Mass Index in Males based on Body Mass Index
2. Stenholm S, Harris TB, Rantanen T, Visser M, Kritchevsky SB, Ferrucci L. Sarcopenic obesity: definition, cause and consequences. Curr Opin Clin Nutr Metab Care. 2008;11(6):693–700. 3. Chen LK, Liu LK, Woo J, Assantachai P,
Auyeung TW, Bahyah KS, et al. Sarcopenia in
Asia: consensus report of the Asian Working Group for Sarcopenia. J Am Med Dir Assoc. 2014;15(2):95–101.
4. Cruz-Jentoft AJ, Baeyens JP, Bauer JM, Boirie Y, Cederholm T, Landi F, et al. Sarcopenia:
European consensus on definition and diagnosis. 2010;39(4):412–23.
5. Yamada Y, Watanabe Y, Ikenaga M, Yokoyama K, Yoshida T, Morimoto T, et al. Comparison
of single- or multifrequency bioelectrical impedance analysis and spectroscopy for assessment of appendicular skeletal muscle in the elderly. J Appl Physiol. 2013;115(6):812–8. 6. Chien MY, Huang TY, Wu YT. Prevalence of
sarcopenia estimated using a bioelectrical impedance analysis prediction equation in community-dwelling elderly people in Taiwan. J Am Geriatr Soc. 2008;56(9):1710–5.
7. Alemán-Mateo H, Valenzuela RER. Skeletal muscle mass indices in healthy young Mexican adults aged 20–40 years: implications for diagnoses of sarcopenia in the elderly population. Sci World J [serial on the internet]. 2014 [cited 2016 June 20];2014(1):[about 5p.]. Available from: http://www.hindawi.com/ journals/tswj/2014/672158/.
8. Krzymińska-Siemaszko R, Czepulis N, Suwalska A, Dworak LB, Fryzowicz A, Madej-Dziechciarow B, et al. The significance of body
mass index in calculating the cut-off points for low muscle mass in the elderly: methodological issues. Bio Med Res Int. [serial on the internet]. 2014 [cited 2016 June 20];2014(1):[about 8p.]. Available from: http://www.hindawi.com/ journals/bmri/2014/450396/.
9. Wen X, Wang M, Jiang CM, Zhang YM. Are current definitions of sarcopenia applicable for older Chinese adults? J Nutr Health Aging. 2011;15(10):847–51.
10. Baumgartner RN, Koehler KM, Gallagher D, Romero L, Heymsfield SB, Ross RR, et al. Epidemiology of sarcopenia among the
elderly in New Mexico. Am J Epidemiol. 1998;147(8):755–63.
11. Kim TN, Yang SJ, Yoo HJ, Lim KI, Kang HJ,
Song W, et al. Prevalence of sarcopenia and
sarcopenic obesity in Korean adults: the Korean sarcopenic obesity study. Int J Obes (Lond). 2009;33(8):885–92.
12. Woods JL, Iuliano-Burns S, King SJ, Strauss BJ, Walker KZ. Poor physical function in elderly women in low-level aged care is related to muscle strength rather than to measures of sarcopenia. Clin Interv Aging. 2011;6(1):67– 76.
13. Mukaka MM. Statistics corner: a guide to appropriate use of correlation coefficient in medical research. Malawi Med J. 2012;24(3):69– 71.
14. Malafarina V, Uriz-Otano F, Iniesta R, Gil-Guerrero L. Sarcopenia in the elderly: diagnosis, physiopathology and treatment. Maturitas. 2012;71(2):109–14.
15. Kalyani RR, Corriere M, Ferrucci L. Age-related and disease-related muscle loss: the effect of diabetes, obesity, and other diseases. Lancet Diabetes Endocrinol. 2014;2(10):819–29. 16. Ranasinghe C, Gamage P, Katulanda P,
Andraweera N, Thilakarathne S, Tharanga P. Relationship between body mass index (BMI) and body fat percentage, estimated by bioelectrical impedance, in a group of Sri Lankan adults: a cross sectional study. BMC Public Health. [serial on the internet]. 2013 [cited 2016 June 25];13(797):[about 8p.]. Available from: https://bmcpublichealth.biomedcentral. com/articles/10.1186/1471-2458-13-797. 17. Deurenberg P, Deurenberg Yap M, Wang J, Lin
FP, Schmidt G. The impact of body build on the relationship between body mass index and percent body fat. Int J Obes Metab Disord. 1999;23(5):537–42.
18. Gurrici S, Hartriyanti Y, Hautvast JG, Deurenberg P. Differences in the relationship between body fat and body mass index between two different Indonesian ethnic groups: the effect of body build. Eur J Clin Nutr. 1999;53(6):468–72. 19. Tanimoto Y, Watanabe M, Sun W, Hirota C,
Sugiura Y, Kono R, et al. Association between
muscle mass and disability in performing instrumental activities of daily living (IADL) in community-dwelling elderly in Japan. Arch Gerontol Geriatr. 2012;54(2):230–3.