Studying the Effects of Industrial Waste Water on
Chemical and Physical Properties of Sandy Soil
Mahdi O. Karkush Dhergham Abdul Jalel Resol
Civil Engineering Department/Baghdad University
[email protected] [email protected]
Abstract
The present work highlights on the impact of liquid industrial waste on the chemical and physical properties of sandy soil obtained from Al-Najaf governorate which is located to the south west of Iraq. The soil sample is classified as sandy soil according to unified soil classification system (USCS). The contaminant is liquid industrial waste obtained from Al-Musayyib thermal power plant which is disposed as side product. The soil samples are synthetically contaminated with four percentages 10, 20, 40 and 100 % by the weight of distilled water used in soaking process which is continued for 30 days. The results proved that the contaminant solution has considerably effects on some properties of soil and a slight effects on the others. Increasing the percentages of contaminant, led to a slight increase in both the liquid limit and particle size and significant increase in the optimum moisture content, while there was slight decrease in the specific gravity and maximum dry density. Also, there was considerable changes in the chemical composition of soil samples.
Key Words: Industrial waste water, soil contamination, soil properties, sandy soil.
ﺔﺼﻼﺨﻟﺍ
wastes differ in quantity and quality from place to another depending on the degree of urbanization. The geoenvironmental engineering is devoted to study the diverse effects of wastes on the properties of soil and groundwater (Reddi and Inyang, 2000). Most of industrial wastes were disposed from important industries such as cement, metallurgical, petrochemicals, textiles, food, and chemical and pharmaceutical industries. Industrial solid waste may be divided into hazardous and non-hazardous depending on the inherent dangers associated with its physical and chemical properties. Non-hazardous wastes are those that do not meet the EPA's definition of hazardous waste. Industrial waste may be toxic, ignitable, corrosive or reactive, so it can be recognized as hazardous wastes according to these measures. If improperly managed, this waste can pose dangerous health and environmental consequences and that may affect negatively on the geotechnical properties of soil (Rowe, 2001 and Sharma and Reddy, 2004).noticed a decrease in plasticity and swelling characteristics for soil samples contaminated with tannery and textile effluents, whereas the plasticity and swelling characteristics were increased for soil samples contaminated with battery effluent. Karkush et al. (2013) studied the effects of different types of contaminants on the geotechnical properties of soil. Four types of contaminants were used: kerosene, ammonium hydroxide, lead nitrate, and copper sulphate, each of them was added in two percentages 10% and 25% of dry weight of soil sample. The soaking period was 30 days. The results showed that the contaminants had significant effects on the geotechnical properties of the soil, where: LL, PL, maximum dry density and initial void ratio increased with increasing the percentages of contamination, while the specific gravity and optimum moisture content were decreased.
The present work is focusing on determining the effects of industrial waste water on the chemical composition and physical properties of sandy soil contaminated with different percentages of industrial waste water.
2. Field Work
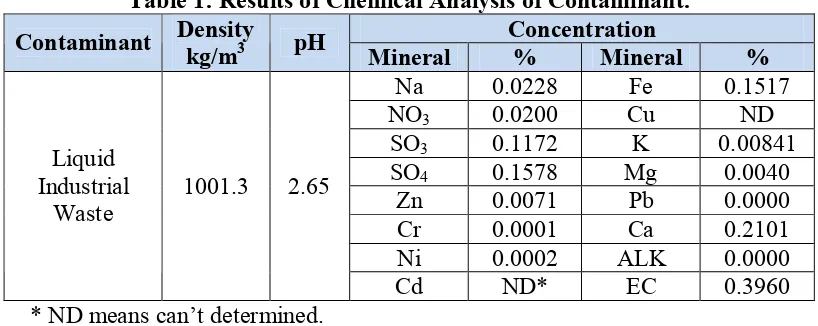
2.1 MaterialsThe materials used in the present work consisted of sandy soil and industrial waste. The soil samples were obtained from Al-Kufa, which is located to the east of Al-Najaf city/Iraq. The location of soil samples is determined by using GPS (UTM: 33N 0488377, 2302942). While, the contaminant is liquid industrial waste disposed from Al-Musayyib thermal power plant which is consist of hydrocarbons and acidic wastes. The chemical analysis of contaminant is given in Table 1.
Table 1: Results of Chemical Analysis of Contaminant. Concentration
Contaminant Density kg/m3 pH Mineral % Mineral %
Na 0.0228 Fe 0.1517
NO3 0.0200 Cu ND
SO3 0.1172 K 0.00841
SO4 0.1578 Mg 0.0040
Zn 0.0071 Pb 0.0000
Cr 0.0001 Ca 0.2101
Ni 0.0002 ALK 0.0000
Liquid Industrial
Waste 1001.3 2.65
Cd ND* EC 0.3960
* ND means can’t determined.
2.2 Drilling and Sampling
Disturbed soil samples were used to measure the effects of contaminant on the chemical and physical properties of soil. The surface layer of soil in Al-Kufa city is medium to dense granular soil with some gypsum, it extended to a depth of 4 to 8m from the natural ground surface. The ground water table varied from (2 to 2.5) m below the ground surface. The soil samples were obtained from depth equal to 1.75m by hand drilling. Then, the soil samples putted in plastic containers and labeled with necessary information. Then, transported to the laboratory.
3. Laboratory Work
To investigate the effects of different percentages of contaminant on the properties of soil samples, the following testing program were conducted on these soil samples.
3.1 Soaking Process
contaminant and completed with distilled water to get the sufficient quantity which is enough to cover soil samples and in order to facilitate the penetration of contaminant into the soil. The soil samples tested in the present study were designated as follows:
ko is intact soil sample; k1 is soil sample contaminated with 10%; k2 is soil sample contaminated with 20%; k3 is soil sample contaminated with 40% and k4 is soil sample contaminated with 100% of industrial waste.
3.2 Chemical Tests and X-Ray Diffraction
The chemical composition of soil sample is important to understand the geotechnical behavior of contaminated soil sample. The chemical tests were carried out on soil samples before and after contamination. The following chemical tests were conducted according to ASTM and XRD techniques.
a) Chloride content (ASTM D512 A). b) Three sulfate ions (ASTM D516). c) pH value (ASTM D4972).
d) Heavy metals (Cu, Ni, Cr, Pb, Cd, Fe).
3.3 Physical Tests
The physical properties tested in the present work were: the particle size distribution of soil samples was conducted according to ASTM (D 422); the liquid limit of soil samples was tested by falling cone method according to (BS: 1377, 1976); the specific gravity for soil samples was tested according to (BS: 1377, 1975, Test 6B) and the maximum dry density and optimum moisture content were determined by using standard Procter test, ASTM (D 698) and modified Procter test, ASTM (D 1557).
4. Results and Discussion
The results of chemical and physical properties of intact soil were compared with those of contaminated soil samples to understand the impacts of the contaminant on these properties.
4.1 Chemical and X-Ray Diffraction Tests 4.1.1 Chemical Tests
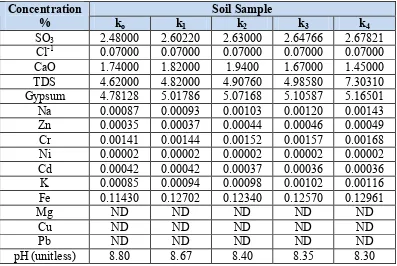
The results of chemical tests conducted on soil samples are given in Table 2. The results of chemical tests showed that all soil samples (intact and contaminated) have (SO3) radical. Sulfates are salts or esters of sulfuric acid H2SO4, formed by
replacing one or both of the hydrogen's with a metal (e.g., sodium) or a radical (e.g., ammonium or ethyl). Most metal sulfates are readily soluble in water, but calcium and mercuric sulfates are only slightly soluble, while barium, lead, strontium, and mercurous sulfates are insoluble. Sulfates play a significant role both in chemical industries and in biological systems.
Table 2: Results of Chemical Tests for Soil Samples. Soil Sample
Concentration
% ko k1 k2 k3 k4
SO3 2.48000 2.60220 2.63000 2.64766 2.67821
Cl-1 0.07000 0.07000 0.07000 0.07000 0.07000
CaO 1.74000 1.82000 1.9400 1.67000 1.45000
TDS 4.62000 4.82000 4.90760 4.98580 7.30310
Gypsum 4.78128 5.01786 5.07168 5.10587 5.16501
Na 0.00087 0.00093 0.00103 0.00120 0.00143
Zn 0.00035 0.00037 0.00044 0.00046 0.00049
Cr 0.00141 0.00144 0.00152 0.00157 0.00168
Ni 0.00002 0.00002 0.00002 0.00002 0.00002
Cd 0.00042 0.00042 0.00037 0.00036 0.00036
K 0.00085 0.00094 0.00098 0.00102 0.00116
Fe 0.11430 0.12702 0.12340 0.12570 0.12961
Mg ND ND ND ND ND
Cu ND ND ND ND ND
Pb ND ND ND ND ND
pH (unitless) 8.80 8.67 8.40 8.35 8.30
The percentage of total dissolved salts (TDS) increased when contaminant percentage increased due to the effect of grinding soil particles and suspension forming in soil water system. A slight change was noticed in the potassium ion content after soil contamination because of the lower percent of potassium in contaminant solute.The gypsum content in soil is correlating and function of the sulfate ions. The increase in percentage of contaminant causes increase in concentration of sulfate ions. The calcium oxide ions are initially increased when soil contaminated with 10% and 20% of contaminant and after continue with increasing the percentage of contamination, the calcium ions are reduced. This reduction depends on the sulfate ions participation in new reaction with soil mineral.
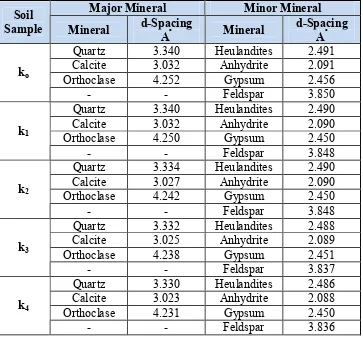
4.1.2 X-Ray Diffraction Tests
The results of X-ray diffraction tests are given in Table 3. The d-spacing of minerals, which is the distance between different planes of atoms in the crystal lattice are given in Table 3. X-ray tests results have shown major reflections at (3.340, 3.032 and 4.252) Aº. This data reveals the presence of quarts, calcite, and orthoclase as
Table 3: Results of X-ray Diffraction Tests.
Major Mineral Minor Mineral
Soil
Sample Mineral d-Spacing Aº Mineral d-Spacing Aº
Quartz 3.340 Heulandites 2.491
Calcite 3.032 Anhydrite 2.091
Orthoclase 4.252 Gypsum 2.456
ko
- - Feldspar 3.850
Quartz 3.340 Heulandites 2.490
Calcite 3.032 Anhydrite 2.090
Orthoclase 4.250 Gypsum 2.450
k1
- - Feldspar 3.848
Quartz 3.334 Heulandites 2.490
Calcite 3.027 Anhydrite 2.090
Orthoclase 4.242 Gypsum 2.450
k2
- - Feldspar 3.848
Quartz 3.332 Heulandites 2.488
Calcite 3.025 Anhydrite 2.089
Orthoclase 4.238 Gypsum 2.451
k3
- - Feldspar 3.837
Quartz 3.330 Heulandites 2.486
Calcite 3.023 Anhydrite 2.088
Orthoclase 4.231 Gypsum 2.450
k4
- - Feldspar 3.836
4.2 Physical Properties of Soil 4.2.1 Particle-Size Distribution
The summary of particle-size distribution tests is given in Table 4. It’s clear that the particles of soil samples become finer after contamination that either due to effect of acidic contaminant which caused corrosion the grains of soil during socking period or due to the property of acidic contaminant solute to dissolve the organic matter in soil sample or dissolution of unstable soil particles and leading to produce more fine particles.
Table 4: Results of Physical Testsfor Soil Samples.
Soil
Sample Gs Gravel % Sand % Silt and Clay % LL % PL % k×10 -6 m/sec
ko 2.64 1.97 97.41 0.61 15 NP 10.4
k1 2.62 1.67 97.00 1.33 15 NP 8.91
k2 2.61 1.68 96.97 1.35 17 NP 6.66
k3 2.61 1.33 97.28 1.39 18 NP 4.78
k4 2.61 1.27 97.33 1.40 21 NP 4.18
4.2.2 Specific Gravity
4.2.3 Atterberg's Limits
The results of Atterberg's limits for studied soil samples are given in Table 5. The contaminant causes increasing liquid limit value’s with increasing the percentage of contaminant added to the soil sample. This action is due to the decreasing in soil particle’s size, which causes increasing surface area of solid particles and the need for additional water content to allow soil to start flow. No plastic limit can be measured due to the non cohesive property of soil samples.
4.2.4 Permeability Tests
The results of constant head permeability tests (CHT) are given in Table 4. The increase in percentage of contamination causes decreasing in permeability of contaminated soil samples consecutively. This reduction is due to increasing the fines of soil particles as result of the effect of acidic contaminants solute.
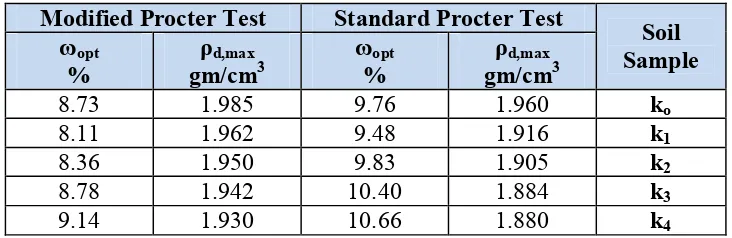
4.2.5Maximum Density
The results of standard and modified compaction tests are given in Table 5. The results of tests indicated that maximum dry density decreased in contaminated soil samples. During soaking process, a light weight material generated at the surface of container, which resulted from the chemical reaction between soil sample and contaminant or due to corrosion of weak surface layer of soil particle. This light material has property of black putrid and glutinous material.
The dissolved salts cover soil particles causes decrease in the maximum dry density, it was noticed that contamination of intact soil sample with 10% of industrial waste causes reducing the maximum dry density and optimum moisture content, but increasing the percentage of contaminant above 10% causes decreasing the maximum dry density and increasing the optimum moisture content. This behavior appeared in standard compaction test, which means a relation between compaction effort and percentage of contamination. In modified Procter tests, the maximum dry density decreased slightly with increasing the percentage of contamination, but the optimum moisture content decreased for 10 and 20% of contamination and start to increase for the other two percentages.
Table 5: Results of CompactionTests. Standard Procter Test
Modified Procter Test Soil
Sample
References
Al-Duwaisan, D. B. and Al-Naseem A. A. ,2011 , ''Characteristic of Oil Contaminated Soil'', International Conference of Environmental Science and Technology. IPCBB, Vol. 6, pp. 439-441.
Annual Book of ASTM Standards ,2003, "Soil and Rock; Building; Stone; Peats". BS 1377 ,1976, "Methods of Testing for Civil Engineering Purpose", British
Standards Institution, London.
Head, K. H.,1984, "Manual of Soil Laboratory Testing", Vol.1, Pentech Press, London: Plymouth.
Head, K. H.,1988,"Manual of Soil Laboratory Testing", Vol.2, Pentech Press, London: Plymouth.
Karkush, M. O., Zaboon, A. T. and Hussien, H. M.,2013, ''Studying the Effects of Contamination on the Geotechnical Properties of Clayey Soil'', Coupled Phenomena in Environmental Geotechnics, Taylor & Francis Group, London, pp. 599-607.
Rao, A. V. N. and Chittaranjan, M. ,2012, ''Effect of Certain Industrial Effluents on Plasticity and Swelling Characteristics of an Expansive Soil - a Comparative Study'', International Journal of Engineering Science and Technology (IJEST), Vol. 4(10), pp.4390-4397.
Reddi, L. N. and Inyang, H. I.,2000, ''Geoenvironmental Engineering: Principles and Applications'', Kansas State and Massachusetts Lowell University of Lowell, Massachusetts, New York, Basel.
Rowe, R. K.,2001, ''Geotechnical and Geoenvironmental Engineering Handbook'', Springer Science and Business Media, New York.