UML
for
Java
Programmers
Robert Cecil Martin
Object Mentor Inc.
Prentice Hall, Englewood Cliffs, New Jersey 07632
The author and publisher of this book have used their best efforts in preparing this book. These efforts include the development, research, and testing of the theories and pro-grams to determine their effectiveness. The author and publisher shall not be liable in any event for incidental or consequential damages in connection with, or arising out of, the furnishing, performance, or use of these programs.
All rights reserved. No part of this book may be reproduced, in any form or by any means, without permission in writing from the publisher.
Printed in the United States of America
10 9 8 7 6 5 4 3 2 1
ISBN 0-13-203837-4 Publisher: Alan Apt
Production Editor:
Cover Designer:
Copy Editor:
© 2002 by Prentice-Hall, Inc.
A Simon & Schuster Company Martin, Robert Cecil.
The Principles, Practices, & Patterns of Agile Software Development
/Robert Cecil Martin.
p. cm.
“An Alan R. Apt Book.”
Includes index.
PRENTICE-HALLINTERNATIONAL(UK) Limited,London
PRENTICE-HALL OFAUSTRALIAPTY. LIMITED,Sydney
PRENTICE-HALLCANADA, INC.,Toronto
PRENTICE-HALLHISPANOAMERICANA,S.A.,Mexico
PRENTICE-HALL OFINDIAPRIVATELIMITED,New Delhi
PRENTICE-HALL OFJAPAN, INC.,Tokyo
SIMON& SCHUSTERASIAPTE. LTD.,Singapore
This book is dedicated to my grandchildren:
XXX: the son of Micah and Angelique.
Alexis: the daughter of Angela and Matt.
It has been said that grandchildren are the desert of life.
If that’s so, what am I supposed to do with all the many
Source Code and Contact Information:
Much of the source code presented in this book can be obtained from the Object Mentor Inc. web site.www.objectmentor.com/UMLFJP
Robert C. Martin: [email protected]
i Chapter :
Chapter 1:
Overview of UML for Java Programmers
...1
Diagram Types
...2
Class Diagrams...4
Object Diagrams...5
Sequence Diagrams ...6
Collaboration Diagrams ...6
State Diagrams ...7
Conclusion
...8
Bibliography
...8
Chapter 2:
Working with Diagrams
...9
Why Model?
...9
Why build models of software? ...10
Why should we build comprehensive designs before coding? ...10
Making Effective use of UML
...10
Communicating with Others. ...11
Back end Documentation ...13
What to keep, and What to throw away. ...14
Iterative Refinement
...15
Behavior first...15
Check the structure...17
Envisioning the code. ...19
Iterative Refinement ...20
Minimalism
...21
When and how to draw diagrams.
...21
When to draw diagrams, and when to stop. ...21
CASE Tools...22
But what about documentation? ...23
And Javadocs?...23
Conclusion
...24
ii
The Basics
...25
Classes ...25
Association ...26
Multiplicity...26
Inheritance ...27
An Example Class Diagram
...28
The Details
...30
Class Stereotypes...30
Abstract classes ...31
Properties...31
Aggregation ...32
Composition ...33
Multiplicity...34
Association Stereotypes ...35
Inner Classes ...36
Anonymous Inner Classes ...36
Association classes ...37
Association Qualifiers ...38
Conclusion
...38
Bibliography
...39
Chapter 4:
Sequence Diagrams
...41
The Basics
...41
Objects, Lifelines, Messages, and other odds and ends. ...41
Creation and Destruction...43
Simple Loops...44
Cases and Scenarios ...44
Advanced Concepts
...48
Loops and Conditions...48
Messages that take time...49
Asynchronous Messages. ...51
Multiple Threads ...53
Active Objects ...54
Sending Messages to Interfaces. ...54
iii Chapter :
Chapter 5:
Use Cases
...57
Writing Use Cases
...57
What is a use case...58
The Primary Course ...58
Alternate Courses ...59
What else? ...59
Use Cases Diagrams
...60
System Boundary Diagram ...60
Use Case Relationships ...61
Conclusion
...61
Chapter 6:
Principles of OOD
...63
Design Quality
...63
Design Smells...63
Dependency Management ...64
The Single Reponsibility Principle (SRP)
...64
The Open Closed Principle (OCP)
...66
The Liskov Substitution Principle (LSP)
...78
The Dependency Inversion Principle (DIP)
...80
The Interface Segregation Principle
...81
Conclusion
...82
Bibliography
...83
Chapter 7:
The Practices: dX
...85
Iterative Development
...85
The Initial Exploration ...85
Estimating the features ...86
Spikes ...87
Planning
...87
Planning Releases...87
Planning Iterations...87
iv
Velocity Feedback...89
Organizing the Iterations into Management Phases
...89
What’s in an Iteration?
...89
Developing in Pairs ...90
Acceptance Tests ...90
Unit Tests ...91
Refactoring ...91
Open Office ...92
Continuous Integration ...92
Conclusion
...92
Bibliography
...93
Chapter 8:
Packages
...95
Java Packages
...95
Packages ...95
Dependencies ...96
Binary Components -- .jar files.
...97
Principles of Package Design
...97
The Release/Reuse Equivalency Principle (REP) ...98
The Common Closure Principle (CCP)...98
The Common Reuse Principle (CRP) ...99
The Acyclic Dependencies Principle (ADP)...99
The Stable Dependencies Principle (SDP)...99
The Stable Abstractions Principle (SAP) ...100
Conclusion
...100
Chapter 9:
Object Diagrams
...103
A Snapshot in Time.
...103
Active Objects
...105
Conclusion
...108
v Chapter :
The Basics
...109
Special Events ...110
Super States ...111
Initial and Final Pseudo States ...113
Using FSM Diagrams
...113
SMC ...114
ICE: A Case Study ...116
Conclusion
...121
Chapter 11:
Heuristics and Coffee
...123
The Mark IV Special Coffee Maker
...123
A Challenge...126
A Common, but Hideous, Coffee Maker Solution...126
MissingMethods. ...126
Vapor Classes ...127
Imaginary Abstraction...128
God Classes ...129
A Coffee Maker Solution
...129
Crossed Wires ...130
The Coffee Maker User Interface...131
Use Case 1: User pushes brew button. ...131
Use Case 2: Containment Vessel not Ready. ...132
Use Case 3: Brewing Complete. ...132
Use Case 4: Coffee all gone. ...134
Implementing the Abstract Model...134
Use Case 1. User pushes Brew Button (Mark IV) ...135
Implementing the isReady() functions. ...136
Implementing the start() functions. ...137
How does M4UserInterface.checkButton get called? ...138
Completing the Coffee Maker...139
The Benefits of this design...141
How did I really come up with this design?...141
vi
Caveat Emptor...153
Unit Tests. ...154
The SMCRemote System.
...154
SMCRemoteClient
...154
SMCRemoteClient Command Line ...155
SMCRemote Communication Protocols ...155
SMCRemoteClient ...157
The Loggers...164
The Remote Sessions. ...165
RemoteSessionBase ...166
The Remote Registrar...169
The Remote Compiler ...171
FileCarrier ...176
SMCRemoteClient Conclusion ...177
SMCRemoteServer
...178
SocketService ...178
SMCRemoteService ...183
SMCRemoteServer...187
ServerSession ...190
Three Level FSM ...192
UserRepository...192
OReillyEmailSender...202
PasswordGenerator...202
Conclusion.
...203
Tests for SMCRemoteClient
...204
Tests for SocketService
...211
Tests for SMCRemoteServer
...214
Other Tests
...224
ServerController (SMC Generated)
...227
1
________________________
1
________________________
Overview of UML for Java
Programmers
The Unified Modeling Language (UML) is a graphical notation for drawing diagrams of software concepts. One can use it for drawing diagrams of a problem domain, a proposed software design, or an already completed software implementation. Fowler1 describes
these three different levels asConceptual,Specification, andImplementation. This deals with the last two.
SpecificationandImplementationlevel diagrams have a strong connection to source code. Indeed it is the intent for aSpecificationlevel diagram to be turned into source code. Likewise it is the intent for anImplementationlevel diagram to describe existing source code. As such there are rules and semantics that diagrams at these levels must follow. Such diagrams have very little ambiguity, and a great deal of formality.
On the other hand, diagrams at theConceptuallevel are not strongly related to source code. Rather they are related tohumanlanguage. They are a shorthand used describe con-cepts and abstractions that exist in the human problem domain. They don’t follow strong semantic rules and therefore their meaning can be ambiguous and subject to interpretation.
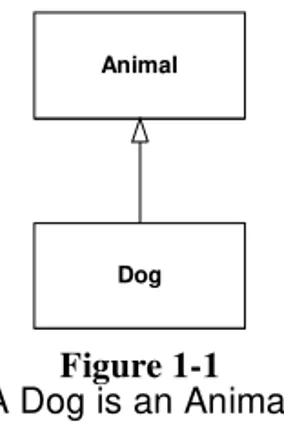
Consider, for example, the following sentence:A dog is an animal. We can create a
ConceptualUML diagram that respresents this sentence. (See Figure 1-1.)
This diagram depicts two entities namedAnimal andDogconnected by generaliza-tionrelationship. AnAnimalis a generalization of aDog. ADogis a special case of an
Animal. That’s all the diagram means. Nothing more can be inferred from it. We might be asserting that our pet dog, Sparky, is an animal; or we might be asserting that dogs, as a
2
Diagram Types
biological species, belong to the animal kingdom. Thus, the diagram is subject to interpre-tation.
However, the same diagram at theSpecificationorImplementationlevel has a much more precise meaning:
public class Animal {}
public class Dog extends Animal {}
This source code defines Animal and Dog as classes connected by an inheritance
relationship. Whereas theConceptualmodel says nothing at all about computers, data pro-cessing, or programs, theSpecificationmodeldescribes part of a program.
It is unfortunate that the diagrams themselves don’t communicate what level they are drawn at. Failure to recognize the level of a diagram is the source of significant miscom-munication between programmers and analysts. A Conceptual level diagram does not
define source code, nor should it. ASpecificationlevel diagram that descibes the solution to a problem does not have to look anything like the Conceptual level diagram that describes that problem.
All the rest of the diagrams in this book will be at theSpecification/Implementation
level, and will be accompanied by corresponding source code where feasible. We have seen our lastConceptuallevel diagram.
Diagram Types
Below is a very quick tour of the primary diagrams used in UML. Once you read through it, you will be able to read and write most of the UML diagrams you will usually need. What remains, and what subsquent chapters address, are the details and formalisms that you will need to become proficient in UML.
UML has three main kinds of diagrams. Static diagrams describe the unchanging log-ical structure of software elements by depicting classes, objects, and data structures; and the relationships that exist between them. Dynamic diagrams show how software entities change during execution by depicting the flow of execution, or the way entities change
Figure 1-1
A Dog is an Animal
Animal
3 Chapter : Overview of UML for Java Programmers
state. Physical diagrams show the unchanging physical structure of software entities by depicting physical entities such as source files, libraries, binary files, data files, etc., and the relationships that exist between them.
Consider the code in Listing 1-1. This program implements a map based upon a sim-ple binary tree algorithm. Familiarize yourself with the code before you consider the dia-grams that follow.
Listing 1-1
TreeMap.java
public class TreeMap {
TreeMapNode topNode = null;
public void add(Comparable key, Object value) { if (topNode == null)
topNode = new TreeMapNode(key, value); else
topNode.add(key, value); }
public Object get(Comparable key) {
return topNode == null ? null : topNode.find(key); }
}
class TreeMapNode {
private final static int LESS = 0; private final static int GREATER = 1; private Comparable itsKey;
private Object itsValue;
private TreeMapNode nodes[] = new TreeMapNode[2];
public TreeMapNode(Comparable key, Object value) { itsKey = key;
itsValue = value; }
public Object find(Comparable key) {
if (key.compareTo(itsKey) == 0) return itsValue; return findSubNodeForKey(selectSubNode(key), key); }
private int selectSubNode(Comparable key) {
return (key.compareTo(itsKey) < 0) ? LESS : GREATER; }
private Object findSubNodeForKey(int node, Comparable key) { return nodes[node] == null ? null : nodes[node].find(key); }
public void add(Comparable key, Object value) { if (key.compareTo(itsKey) == 0)
itsValue = value; else
4
Diagram Types
Class Diagrams
The Class Diagramin Figure 1-2 shows the major classes and relationships in the program. It shows that there is aTreeMapclass that has public methods namedaddand get. It shows that TreeMap holds a reference to aTreeMapNode in a variable named topNode. It shows that eachTreeMapNodeholds a reference to two otherTreeMapNode instances in some kind of container namednodes. And it shows that eachTreeMapNode instance holds references to two other instances in variables named itsKey and itsValue. TheitsKeyvariable holds a reference to some instance that implements the Comparableinterface. TheitsValuevariable simply holds a reference to some object.
We’ll go over the nuances of class diagrams in a subsequent chapter. For now, there are only a few things you need to know.
• Rectangles represent classes, and arrows represent relationships.
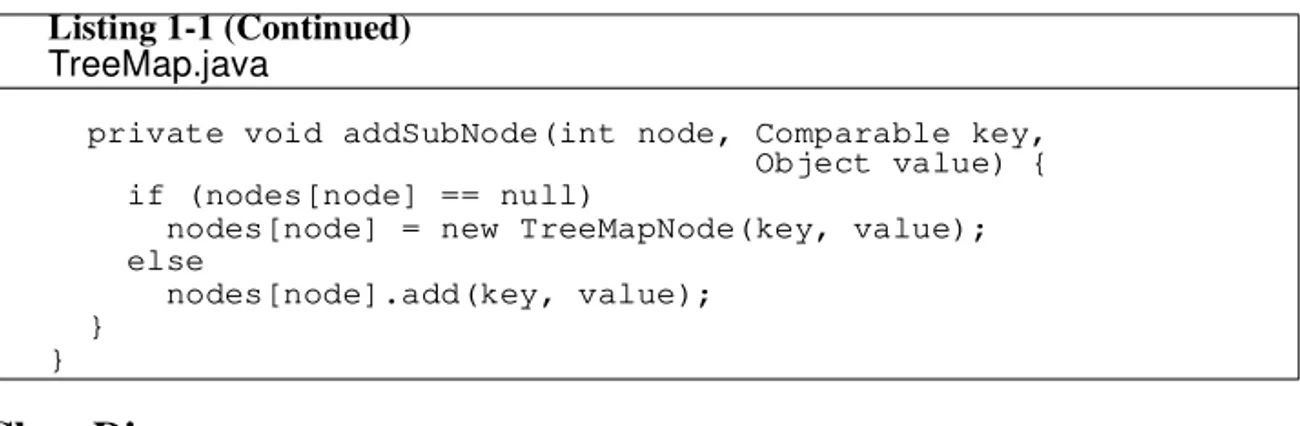
• In this diagram all the relationships areassociations. Associations are simple data relationships in which one object holds a reference to, and invokes methods private void addSubNode(int node, Comparable key,
Object value) { if (nodes[node] == null)
nodes[node] = new TreeMapNode(key, value); else
nodes[node].add(key, value); }
}
Figure 1-2
Class Diagram of TreeMap
Listing 1-1 (Continued)
TreeMap.java
+ add(key, value) + get(key)
TreeMap
+ add(key, value) + find(key)
TreeMapNode
topNode
2 nodes
Comparable
«interface»
Object
itsKey
5 Chapter : Overview of UML for Java Programmers
upon, the other.
• The name on an association maps to the name of the variable that holds the refer-ence.
• A number next to an arrowhead typically shows the number of instances held by the relationship. If that number is greater than one then some kind of container, usually an array, is implied.
• Class icons can have more than one compartment. The top compartment always holds the name of the class. The other compartments describe functions and vari-ables.
• The«interface»notation means thatComparableis an interface. • Most of the notations shown are optional.
Look carefully at this diagram and relate it to the code in Listing 1-1. Notice how the association relationships correspond to instance variables. For example, the association from TreeMap to TreeMapNode is namedtopNode and corresponds to the topNode variable withinTreeMap.
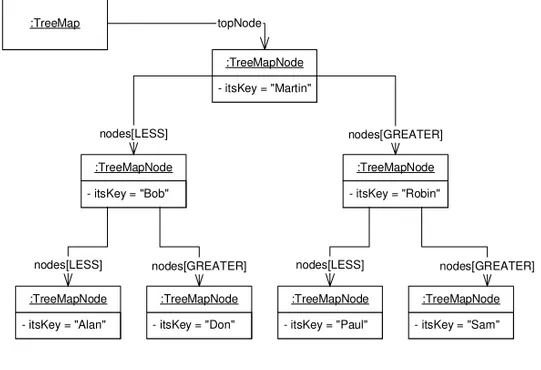
Object Diagrams
Figure 1-3 is anObject Diagram. It shows a set of objects and relationships at a par-ticular moment in the execution of the system. You can view it as a snapshot of memory.
Figure 1-3
TreeMap Object Diagram
:TreeMap
- itsKey = "Martin" :TreeMapNode
- itsKey = "Bob" :TreeMapNode
- itsKey = "Don" :TreeMapNode
- itsKey = "Alan" :TreeMapNode
- itsKey = "Paul" :TreeMapNode
- itsKey = "Sam" :TreeMapNode - itsKey = "Robin"
:TreeMapNode nodes[GREATER] nodes[LESS]
6
Diagram Types
In this diagram the rectangle icons represent objects. You can tell that they are objects because their names are underlined. The the name after the colon is the name of the class that the object belongs to. Note that the lower compartment of each object shows the value of that object’sitsKeyvariable.
The relationships between the objects are called links, and are derived from the asso-ciations in Figure 1-3. Note that the links are named for the two array cells in thenodes array.
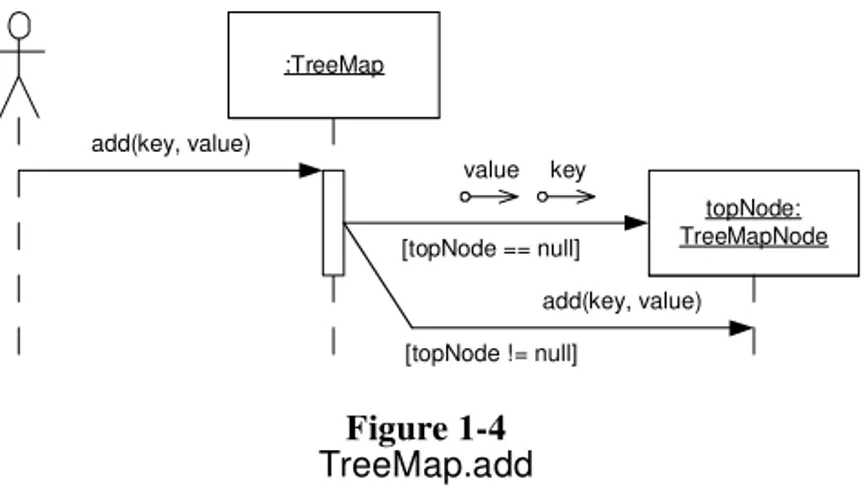
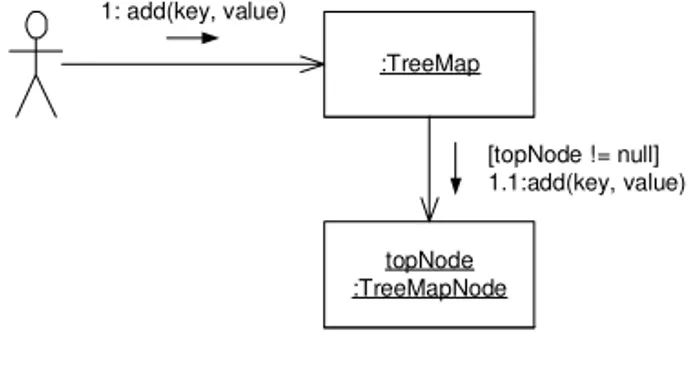
Sequence Diagrams
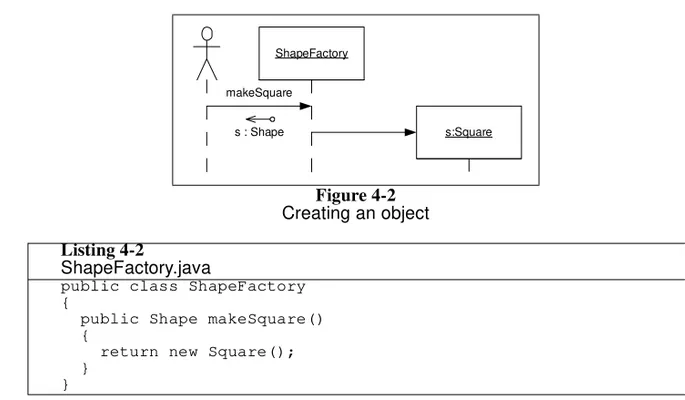
Figure 1-4 is aSequence Diagram. It describes how theTreeMap.addmethod is imple-mented.
The stick figure represents an unknown caller. This caller invokes theaddmethod on aTreeMapobject. If thetopNodevariable isnull, thenTreeMapresponds by creating a newTreeMapNodeand assigning it totopNode. Otherwise theTreeMapsends theadd message totopNode.
The boolean expressions inside square brackets are calledguards. They show which path is taken. The message arrow that terminates on the TreeMapNodeicon represents construction. The little arrows with circles are calleddata tokens. In this case they depict the construction arguments. The skinny rectangle belowTreeMapis called anactivation. It depicts how much time theaddmethod executes.
Collaboration Diagrams
The diagram in Figure 1-5 is a Collaboration Diagram depicting the case of TreeMap.addwhere treeNodeis notnull. Collaboration diagrams contain the same information that sequence diagrams contain. However whereas sequence diagrams make the order of the messages clear, collaboration diagrams make the relationships between the objects clear.
Figure 1-4
TreeMap.add
:TreeMap
add(key, value)
topNode: TreeMapNode key
value
[topNode == null] add(key, value)
7 Chapter : Overview of UML for Java Programmers
The objects are connected by relationships called links. A link exists wherever one object can send a message to another. Traveling over those links are the messages them-selves. They are depicted as the smaller arrows. The messages are labeled with the name of the message, its sequence number, and any guards that apply.
The dot structure of the sequence number shows the calling hierarchy. The TreeMap.addfunction (message 1) invokes the TreeMapNode.addfunction (message 1.1). Thus message 1.1 is the first message sent by the function invoked by message 1.
State Diagrams
UML has a very comprehensive notation for finite state machines. Figure 1-6 shows just the barest subset of that notation.
Figure 1-6 shows the state machine for a subway turnstile. There are two states
namedLockedandUnlocked. Twoeventsmay be sent to the machine. Thecoinevent means that the user has dropped a coin into the turnstyle. Thepassevent means that the user has passed through the turnstile.
The arrows are calledtransitions. They are labeled with the theeventthat triggers the transition, and the action that the transition performs. When a transition is triggered it causes the state of the system to change.
Figure 1-5
Collaboration Diagram of one case of TreeMap.add
Figure 1-6
State Machine of a Subway Turnstile
:TreeMap
topNode :TreeMapNode 1: add(key, value)
[topNode != null] 1.1:add(key, value)
Locked
Unlocked coin / Unlock
pass / Lock
8
Conclusion
We can translate Figure 1-6 to english as follows:
• If we are in theLockedstate, and we get acoinevent, then we transition to the Unlockedstate and we invoke theUnlockfunction.
• If we are in theUnlockedstate and we get apassevent then we transition to the Lockedstate and we invoke theLockfunction.
• If we are in theUnlockedstate and we get acoinevent, then we stay in the Unlockedstate and we call theThankyoufunction.
• If we are in theLockedstate and we get apassevent then we stay in the Lockedstate and we call theAlarmfunction.
Diagrams like this are extremely useful for figuring out the way a system behaves. They give us the opportunity to explore what the system should do in unexpected cases, like when a user drops a coin, and then drops another coin for no good reason.
Conclusion
The diagrams shown in this chapter are enough for most purposes. Most programmers could live without any more knowledge of UML that what is shown here.
Bibliography
9
________________________
2
________________________
Working with Diagrams
“Before we explore the details of UML, it would be wise to talk about when and why we use it. Much harm has been done to software projects through the misuse and overuse of UML.
Why Model?
Why do engineers build models? Why do aerospace engineers build models of aircraft? Why do structural engineers build models of bridges? What purposes do these models serve?
These engineers build models to find out if their designs will work. Aerospace engi-neers build models of aircraft and then put them into wind tunnels to see if they will fly. Structural engineers build models of bridges to see if they will stand. Architects build models of buildings to see if their clients will like the way they look.Models are built to find out if something will work.
This implies that models must be testable. It does no good to build a model if there are no criteria you can apply to that model in order to test it. If you can’t evaluate the model, the model has no value.
10
Making Effective use of UML
Why build models of software?
Can a UML diagram be tested? Is it much cheaper to create and test than the software it represents? In both cases the answer is nowhere near as clear as it is for aerospace engi-neers and structural engiengi-neers. There are no firm criteria for testing a UML diagram. We can look at it, and evaluate it, and apply principles and patterns to it; but in the end the evaluation is still very subjective. UML diagrams are less expensive to draw than software is to write; but not by a huge factor. Indeed, there are times when it’s easier to change source code than it is to change a diagram. So then, does it make sense to use UML?
I wouldn’t be writing this book if UML didn’t make sense to use. However, the above illustrates just how easy UML is to misuse.We make use of UML when we have something definitive we need to test, and when using UML to test it is cheaper than using code to test it.
For example, lets say I have an idea for a certain design. I need to test whether the other developers on my team think it is a good idea. So I write a UML diagram on the whiteboard and ask my teammates for their feedback.
Why should we build comprehensive designs before coding?
Architects, aerospace engineers, and structural engineers all draw blueprints. Why? Because one person can draw the blueprints for a home that will require five or more peo-ple to build. A few dozen aerospace engineers can draw blueprints for an airplane that will require thousands of people to build. Blueprints can be drawn without digging founda-tions, pouring concrete, or hanging windows. In short, it ismuchcheaper to plan a build-ing up front, than it is to try to build it without a plan. It doesn’t cost much to throw away a faulty blueprint, but it costs alotto tear down a faulty building.
Once again things are not so clear cut in software. It is not at all clear that drawing UML diagrams is much cheaper than writing code. Indeed, many project teams have spent
moreon their diagrams than they have on the code itself. It is also not clear that throwing away a diagram is much cheaper than throwing away code. Therefore, it is not at all clear that creating a comprehensive UML design before writing code is a cost effective option.
Making Effective use of UML
11 Chapter 2: Working with Diagrams
Communicating with Others.
UML is enormously convenient for communicating design concepts between software developers. A lot can be done with a small group of developers at a whiteboard. If you have some ideas that you need to communicate to others, UML can be a big benefit.
UML is very good for communicating focussed design ideas. For example, the dia-gram in Figure 2-1 is very clear. We see theLoginServletimplementing theServlet interface and using the UserDatabase. Apparently the classes HTTPRequest and HTTPResponseare needed by theLoginServlet. One could easily imagine a group of developers standing around a whiteboard debating a diagram like this. Indeed, the diagram makes it very clear what the code structure would look like.
On the other hand, UML is not particularly good for communicating algorithmic detail. Consider the simple bubble sort code in Listing 2-1. Expressing this simple module in UML is not very satisfying..
Figure 2-1
Login Servlet
Listing 2-1
Bubble Sort
public class BubbleSorter {
static int operations = 0;
public static int sort(int [] array) {
operations = 0;
if (array.length <= 1) return operations;
for (int nextToLast = array.length-2; nextToLast >= 0; nextToLast--)
for (int index = 0; index <= nextToLast; index++) compareAndSwap(array, index);
return operations; }
Servlet HTTPRequest
HTTPResponse
+ processRequest()
Login Servlet
«interface»
+ getUser()
12
Making Effective use of UML
The diagram in Figure 2-2 gives us a rough structure, but is combersome and reflects none of the interesting details. The diagram in Figure 2-3 is no eaiser to read than the code and is substantially more difficult to create. UML for these purposes leaves much to be desired.
private static void swap(int[] array, int index) {
int temp = array[index]; array[index] = array[index+1]; array[index+1] = temp;
}
private static void compareAndSwap(int[] array, int index) {
if (array[index] > array[index+1]) swap(array, index);
operations++; }
}
Figure 2-2
Bubble Sorter
Figure 2-3
Bubble Sort Sequence Diagram
Listing 2-1 (Continued)
Bubble Sort
BubbleSorter
+ sort(array: int[]) : int - swap(array : int[], index : int)
- compareAndSwap(array : int[], index : int)
BubbleSorter
sort
13 Chapter 2: Working with Diagrams
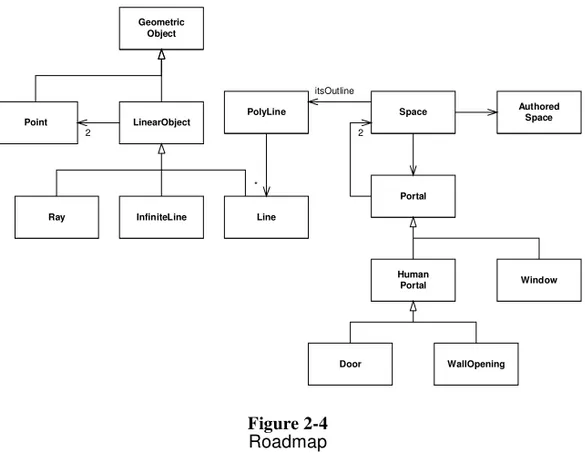
UML can be useful for creating roadmaps of large software structures. Such road-maps give developers a quick way to find out which classes depend upon which others and provide a reference to the structure of the whole system.
For example, in Figure 2-4 it is easy to see thatSpaceobjects have aPolyline con-structed of many Lines which are derived from LinearObject which contains two Points. Finding this structure in code would be tedious. Finding it in a roadmap diagram is trivial.
Such roadmaps can be useful teaching tools. However, any team member ought to be able to throw such a diagram up on the whiteboard at a moments notice. Indeed, I drew the one above from my memory of a system I was working on five years ago. Such diagrams capture the knowledge that all the developers must keep in their heads in order to work effectively in the system. So, for the most part, there is not much point is going to a lot of trouble to create and archive such documents. Their best use is, once again, at the white-board.
Back end Documentation
When is the best time to create a design document? At the end of the project as the last act of the team. Such a document will accurately reflect the state of the design as the team left it, and could certainly be useful to an incomming team.
Figure 2-4
Roadmap
Space Authored Space
Portal
Human
Portal Window
Door WallOpening
2
PolyLine
Line
itsOutline
*
LinearObject
InfiniteLine Ray
Geometric Object
Point
14
Making Effective use of UML
However, there are some pitfalls. UML diagrams need to be carefully considered. We don’t want a thousand pages of sequence diagrams! Rather, we want a few very salient diagrams that describe the major issues in the system. No UML diagram is worse than one that is cluttered with so many lines and boxes that you get lost in the tangle (See Figure
2-5).Don’t do this.
What to keep, and What to throw away.
Get into the habit of throwing UML diagrams away. Better yet, get into the habit of not creating them on a persistent medium. Write them on a whiteboard, or on scraps of paper. Erase the whiteboard frequently, and throw the scraps of paper away. Don’t use a case tool or a drawing program as a rule. There is a time and place for such tools, but most of your UML should be short-lived.
Some diagrams, however, are useful to save. There are diagrams that express a com-mon design solution in your system. There are diagrams that record complex protocols that are hard to see in the code. There are diagrams that provide roadmaps for areas of the
Figure 2-5
fravitz fradle fivvle
parnangle gabaduchi turnatls gazatch
goassach
coriadon
dorasifus
gilmaso
teliadora
tolanomatine
bisotias
Kobe Sobe castigamator
zelsofus
quidatle
sagatock garmatos
Gossage
Gorsage
freedle meek
Kaastor
15 Chapter 2: Working with Diagrams
system that aren’t touched very often. There are diagrams that record designer intent in a way that is better than code can express it.
There is no point in hunting for these diagrams; you’ll know them when you see them. There’s no point in trying to create these diagrams up front. You’ll be guessing, and you’ll guess wrong. The real useful diagrams will keep showing up over and over again. They’ll show up on whiteboards or scraps of paper in design session after design session. Eventually someone will make a persistent copy of the diagram just so it doesn’t have to be drawn again. That is the time to place the diagram in some common area that everyone has access to.
It is important to keep common areas convenient and uncluttered. Putting useful dia-grams on a web server, or a networked knowledge base, is a good idea. However, don’t allow hundreds or thousands of diagrams to accumulate there. Be judicious about what diagrams are truly useful, and which could be recreated by anybody on the team at a moments notice. Keep only those whose long term survival has lots of value.
Iterative Refinement
How do we create UML diagrams? Do we draw them in one brilliant flash of insight? Do we draw the class diagrams first and then the sequence diagrams? Should we scaffold the whole structure of the system first before we flesh in any of the details?
The answer to all these questions is a resounding NO. Anything humans do well they do by taking tiny little steps and then evaluating what they have done. The things that humans do not do well are things that they do in great leaps. We desire to create useful uml diagrams. Therefore we will create them in tiny little steps.
Behavior first.
I like to start with behavior. For those problems where I think UML will help me think the problem through, I’ll start by drawing a simple sequence diagram of the problem. Condis-der, for example, the software that controls a cellular phone. How does this software make the phone call?
We might imagine that the software detects each button press and sends a message to some object that controls dialing. So we’ll draw aButtonobject and aDiallerobject and show theButtonsending thedigitmessage to theDialler.
16
Iterative Refinement
What will theDiallerdo when it recieves thedigitmessage? Well, it needs to get the digit displayed on the screen. So perhaps it’ll send displayDigit to theScreen object.
Next theDiallerhad better cause a tone to be emitted from the speaker. So we’ll have it send thetonemessage to theSpeakerobject.
At some point the user will press the “send” button indicating that he wants the call to go through. At that point we’ll have to tell the cellular radio to connect to the cellular net-work and pass along the phone number that was dialled.
Once the connection has been established, theRadiocan tell theScreento light up the “in use” indicator. This message will almost certainly be sent in a different thread of control (which is denoted by the letter in front of the sequence number). The final collabo-ration diagram is shown in Figure 2-6.
: Button :Dialler 1*:digit(n)
: Screen
1.1 : displayDigit(n)
: Button :Dialler 1*:digit(n)
: Screen
1.1 : displayDigit(n)
: Speaker
1.2: tone(n)
: Button :Dialler 1*:digit(n)
: Screen
1.1 : displayDigit(n)
: Speaker
1.2: tone(n) 2:Send send : Button
17 Chapter 2: Working with Diagrams
Check the structure
This little exersize has shown how we build a collaboration from nothing. Notice how we invented objects along the way. We didn’t know these objects were going to be there ahead of time, we just knew we needed certain things to happen, so we invented objects to do them.
But now, before we go much further, we need to examine what this collaboration means to the structure of the code. So we’ll create a class diagram that supports the collab-oration. This class diagram will have a class for each object in the collaboration, and an association for each link in the collaboration.
Those of you who are familiar with UML will note that I have ignored aggregation and composition. That’s intentional. There’ll be plenty of time to consider whether any of those relationships apply nor not.
Figure 2-6
Cell Phone Collaboration Diagram
Figure 2-7
Cell Phone Class Diagram
: Button :Dialler 1*:digit(n)
: Screen
1.1 : displayDigit(n)
: Speaker
1.2: tone(n) 2:Send
send : Button
:Radio 2.1 : connect(pno)
A1 : inUse
Button Dialler Radio
18
Iterative Refinement
What’s important to me right now is an analysis of the dependencies. Why should Buttondepend uponDialler? If you think about this, it’s pretty hideous. Consider the implied code:
public class Button {
private Dialler itsDialler; public Button(Dialler dialler) {itsDialler = dialler;}
... }
I don’t want the source code of Buttonmentioning the source code of Dialler. Buttonis a class that I can use in many different contexts. For example, I’d like to use the Buttonclass to control the on/off switch, or the menu button, or the other control buttons on the phone. If I bind the Button to the Dialler, then I won’t be able to reuse the Buttoncode for other purposes.
I can fix this by inserting an interface betweenButton andDialleras shown in Figure 2-8. Here we see that each Buttonis given a token that identifies it. When the Button class detects that the real button has been pressed, it invokes the buttonPressed method of the ButtonListener interface, passing the token. This breaks the dependence ofButtonuponDiallerand allowsButtonto be used virtually anywhere that needs to recieve button presses..
Notice that this change has had no effect upon the dynamic diagram in Figure 2-6. The objects are all the same, it’s just the classes that have changed.
Unfortunately now we’ve made Dialler know something about Button. Why shouldDiallerexpect to get its input from ButtonListener? Why should it have a
Figure 2-8
Isolating Button from Dialler
- token
Button
Dialler Radio
Speaker Screen
+ buttonPressed(token)
ButtonListener
19 Chapter 2: Working with Diagrams
method within it named buttonPressed? What has the Dialler got to do with Button?
We can solve this problem, and get rid of all the token nonsense, by using a batch of little adapters. The ButtonDiallerAdapterimplements theButtonListener inter-face. It receives the buttonPressed method and sends a digit(n) message to the Dialler. Thedigitpassed to theDialleris held in the adapter.
Envisioning the code.
We can easily envision the code for the ButtonDiallerAdapter. It appears in Listing 2-2. Being able to envision the code is critically important when working with diagrams. We use the diagrams as a shortcut for code, not a replacement for it. If you are drawing dia-grams and cannot envision the code that they represent, then you are building castles in the air.Stop what you are doing, and figure out how to translate it to code.Never let the dia-grams become an end unto themselves. You must always be sure you know what code you are representing.
Figure 2-9
Adapting Buttons to Diallers
Listing 2-2
ButtonDiallerAdapter.java
public class ButtonDiallerAdapter implements ButtonListener {
private int digit; private Dialler dialler;
public ButtonDiallerAdapter(int digit, Dialler dialler) {
this.digit = digit; this.dialler = dialler; }
Button
+ digit(n)
Dialler
Radio
Speaker Screen
+ buttonPressed()
ButtonListener
«interface»
- digit
20
Iterative Refinement
Iterative Refinement
Note that the last change we made in Figure 2-9 has invalidated the dynamic model back in Figure 2-6. The dynamic model knows nothing of the adapters. We’ll change that now. See Figure 2-10.
This shows how the diagrams evolve together in an iterative fashion. You start with a little bit of dynamics. Then you explore what those dynamic imply to the static relation-ships. You alter the static relationships according to the principles of good design. Then you go back and improve the dynamic diagrams.
Each of these steps intiny. We don’t want to invest any more than 5 minutes into a dynamic diagram before exploring the static structure implied. We don’t want to spend any more than 5 minutes refining that static structure before we consider the impact on the dynamic behavior. Rather, we want to evolve the two diagrams together using very short cycles.
Remember, we’re probably doing this at a whiteboard, and we are probably not recording what we are doing for posterity. We aren’t trying to be very formal or very pre-cise. Indeed, the diagrams I have included in the figures above are a bit more precise and
public void buttonPressed() {
dialler.digit(digit); }
}
Figure 2-10
Adding Adapters to the Dynamic Model
Listing 2-2
ButtonDiallerAdapter.java
: ButtonDialler
Adapter :Dialler 1.1:digit(n)
: Screen 1.1.1 : displayDigit(n)
: Speaker
1.1.2: tone(n) 2.1:Send :SendButton
DiallerAdapter
:Radio 2.1.1 : connect(pno)
A1 : inUse :Button
ButtonListener
ButtonListener 2:buttonPressed
21 Chapter 2: Working with Diagrams
formal than you would normally have to be. The goal at the whiteboard is not to get all the dots right on your sequence numbers. The goal is to get everybody standing at the board to understand the discussion. The goal is to stop working at the board and start writing code.
Minimalism
This book will show you all the various widgets and icons you can adorn a UML diagram with. Using these adornments you can make your diagrams very complex. It is possible to represent an amazing amount of detail in a UML diagram. However, I advise against this.
As we’ll discuss below, diagrams are most useful for communicating with other, and for helping you work out design problems. It is important that you only use the amount of detail necessary to accomplish your goal. Loading a diagram up with lots of adornments is possible, but counter-productive. Keep your diagrams simple and clean. UML diagrams are not source code and should not be treated as the place to declare every method, vari-able, and relationship.
When and how to draw diagrams.
Drawing UML diagrams can be a very useful activity. It can also be a horrible waste of time. A decision to use UML can be a very good thing, or it can be a very bad thing. It depends upon how, and how much, you choose to use it.
When to draw diagrams, and when to stop.
Don’t make a rule that everything must be diagrammed. Such rules are worse than useless. Enormous amounts of project time and energy can be wasted in pursuit of diagrams that no one will ever read.
When to draw diagrams:
• Draw diagrams when several people need to understand the structure of a partic-ular part of the design because they are all going to be working on it simulta-neously. Stop when everyone agrees that they understand.
• Draw diagrams when two or more people disagree on how a particular element should be designed, and you want team consensus. Put the discussion into a time-box choose a means for deciding, like a vote, or an impartial judge. Stop at the end of the timebox, or when the decision can be made. Then erase the diagram.
22
When and how to draw diagrams.
• Draw diagrams when you need to explain the structure of some part of the code to someone else, or to yourself. Stop when the explanation would be better done by looking at code.
• Draw diagrams when it’s close to the end of the project and your customer has requested them as part of a documentation stream for others.
Whennotto draw diagrams:
• Don’t draw diagrams because the process tells you to.
• Don’t draw diagrams because you feel guilty not drawing them or because you think that’s what good designers do. Good designers write code and draw dia-grams only when necessary.
• Don’t draw diagrams to create comprehensive documetation of the design phase prior to coding. Such documents are almost never worth anything and consume immense amounts of time.
• Don’t draw diagrams for other people to code. True software architects partici-pate in the coding of their designs, so that they can lay in the bed they have made.
CASE Tools.
UML CASE tools can be beneficial, but they can also be expensive dust collectors. Be
verycareful about making a decision to purchase and deploy a UML CASE tool.
• Don’t UML CASE tools make it easier to draw diagrams?
No, they make it significantly harder. There is a long learning curve to get profi-cient; and even then the tools are more cumbersome than whiteboards. White-boards are very easy to use. Developers are usually already familiar with them. If not, there is virtually no learning curve.
• Don’t UML CASE tools make it easier for large teams to collaborate on dia-grams?
In some cases. However, the vast majority of developer and development projects do not need to be producing diagrams in such quantities and complexi-ties that they require an automated collaborative system to coordinate their activ-ities. In any case, the best time to purchase a system to coordinate the preparation of UML diagrams is when a manual system has first been put in place, is starting to show the strain, and there is no other choice but to automate.
• Don’t UML CASE tools make it easier to generate code?
Gener-23 Chapter 2: Working with Diagrams
ating code from diagrams may sound like a good idea; but I stronly urge you to measure the productivity increase before you spend a lot of money.
• What about these CASE tools that are also IDEs and show the code and dia-grams together?
These tools are definitely cool. However, I don’t think the constant presence of UML is important. The fact that the diagram changes as I modify the code, or that the code changes as I modify the diagram, does not really help me much. Frankly, I’d rather buy an IDE that has put its effort on figuring out how to help me manipulate my programs than my diagrams. Again, measure productivity improvement before making a huge monetary committment.
In short, look before you leap, and look very hard. Theremaybe a benefit to outfitting your team with an expensive CASE tool; but verify that benefit with your own experi-ments before buying something that could very well turn into shelfware.
But what about documentation?
Good documentation is essential to any project. Without it the team will get lost is a sea of code. On the other hand, too much documentation of the wrong kind is worse; because then you have all this distracting and misleading paper, and you still have the sea of code.
Documentation must be created, but it must be created prudently. Often the choicenot
to document is just as important as the choice to document. A complex communication protocol needs to be documented. A complex relatoinal schema needs to be documented. A complex reusable framework needs to be documented.
However, none of these things needs a hundred pages of UML. Software documenta-tion should beshort, and to the point. The value of a software document is inversely pro-portional to its size.
For a project team of 12 people working on a project of a million lines of Java, I would have a total of 25 to 200 pages of persistent documentation, with my preference being for the smaller. These documents would include UML diagrams of the high level structure of the important modules, ER diagrams of the relational schema, a page or two about how to build the system, testing instructions, source code control instructions, etc.
I would put this documentation into a wiki, or some collaborative authoring tool so that anyone on the team can have access to it on their screens and search it, and anyone can change it as need be.
It takes a lot of work to make a document small, but that work is worth it. People will read small documents. They won’t read 1,000 pages tomes.
And Javadocs?
24
Conclusion
enough information to help the user understand. Javadocs that describe private utility functions or methods that aren’t for wide distribution can be much smaller.
Conclusion
A few folks at a whiteboard can use UML to help them think through a design problem. Such diagrams should be created iteratively, in very short cycles. It is best to explore dynamic scenarios first, and then determine their implications on static structure. It is important to evolve the dynamic and static diagrams together using very short iterative cycles on the order of 5 minutes or less.
UML CASE tools can be beneficial in certain cases; but for the normal development team they are likely to be more of a hindrance than a help. If you think you need a UML CASE tool; even one integrated with an IDE, run some productivity experiments first. Look before you leap.
25
________________________
3
________________________
Class Diagrams
UML class diagrams allow us to denote the static contents of, and relationships between classes. In a class diagram we can show the member variables, and member functions of a class. We can also show whether one class inherits from another, or whether it holds a ref-erence to another. In short, we can depict all the source code dependencies between classes.
This can be valuable. It can be much eaiser to evaluate the dependency structure of a system from a diagram than from source code. Diagrams make certain dependency struc-tures visible. We canseedependency cycles, and determine how best to break them. We can see when abstract classes depend upon concrete classes, and determine a strategy for rerouting such dependencies. .
The Basics
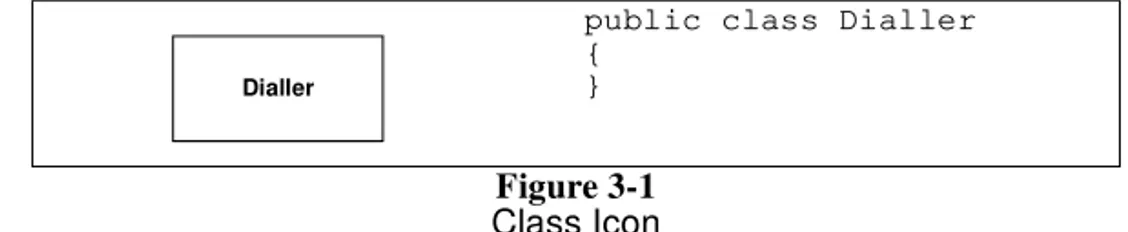
Classes
Figure 3-1 shows the simplest form of class diagram. The class namedDialleris repre-sented as a simple rectangle. This diagram represents nothing more than the code shown to its right.
public class Dialler {
}
Figure 3-1
Class Icon
26
The Basics
This is the most common way you will represent a class. The classes on most dia-gramd don’t need any more than their name to make clear what is going on.
A class icon can be subdivided into compartments. The top compartment is for the name of the class, the second is for the variables of the class, and the third is for the meth-ods of the class. Figure 3-2 shows these compartments and how they translate into code.
Notice the character in front of the variables and functions in the class icon. A dash (-)denotesprivate, hash(#)denotesprotected, and plus(+)denotespublic.
The type of a variable, or a function argument is shown after the colon following the variable or argument name. Similarly, the return value of a function is shows after the colon following the function.
This kind of detail is sometimes useful; but should not be used very often. UML dia-grams are not the place to declare variables and function. Such declarations are better done in source code. Use these adornments only when they are essential to the purpose of the diagram.
Association
Associations between classes most often represent instance variables that hold references to other objects. For example, in Figure 3-3 we see an association between Phoneand Button. The direction of the arrow tells us thatPhoneholds a reference toButton. The name near the arrowhead is the name of the instance variable. The number near the arrow-head tells us how many references are held.
Multiplicity
The number near the arrowhead represents the number of objects that connected to the other associate. In Figure 3-3 above we saw that fifteenButtonobjects were connected to
public class Dialler {
private Vector digits; int nDigits;
public void digit(int n);
protected boolean recordDigit(int n); }
Figure 3-2
public class Phone {
private Button itsButtons[15]; }
Figure 3-3
+ digit(n : int)
# recordDigit(n : int) : boolean - digits : Vector
- nDigits : int
Dialler
Phone Button
27 Chapter : Class Diagrams
thePhoneobject. Below, in Figure 3-4, we see what happens when there is no limit. A Phonebookis connected tomanyPhoneNumberobjects. The star means many. In Java this is most commonly implemented with aVector, aList, or some other container type.
Why didn’t I use HASA?
You may have noticed that I avoided using the word“has”. I could have said: “A Phonebook has many PhoneNumbers.” This was inten-tional. The common OO verbs HASA and ISA have lead to a number of unfortunate mis-understandings. We’ll explore some of them later in Chapter 6. For now, don’t expect me to use the common terms. Rather, I’ll use terms that are descriptive of what actually hap-pens in software.
Inheritance
You have to be very careful with your arrowheads in UML. Figure 3-5 shows why. The little arrowhead pointing atEmployeedenotesinheritance1. If you draw your arrowheads
carelessly, it may be hard to tell whether you mean inheritance or association. To make it clearer, I often make inheritance relationships vertical and associations horizontal.
In UML all arrowheads point in the direction ofsource code dependency. Since it is the SalariedEmployee class that mentions the name of Employee, the arrowhead points atEmployee. So, in UML, inheritance arrows point at the base class.
UML has a special notation for the kind of inheritance used between a Java class and a Java interface. It is shown, in Figure 3-6, as a dashed inheritance arrow2. In the diagrams
to come, you’ll probably catch me forgetting to dash the arrows that point to interfaces. I public class Phonebook
{
private Vector itsPnos; }
Figure 3-4
1. Actually, it denotesGeneralization, but as far as a Java programmer is concerned, the difference is moot.
public class Employee {
... }
public class SalariedEmployee extends Employee {
... }
Figure 3-5
2. This is called a Realizes relationship. There’s more to it than just inheritance of interface, but the difference is beyond the scope of this book.
Phonebook Phone
Number
*
itsPnos
Employee
28
An Example Class Diagram
suggest you forget to dash the arrows that you draw on whiteboards too. Life’s too short to be dashing arrows.
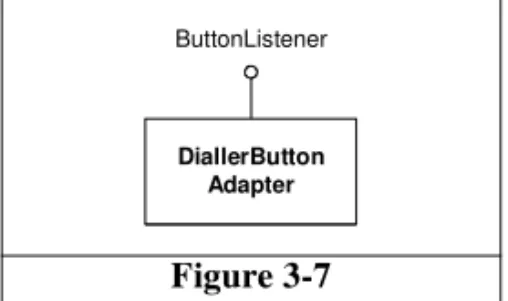
Figure 3-7 shows another way to convey the same information. Interfaces can be drawn as little lollipops on the classes that implement them. We often see this kind of notation in COM designs.
An Example Class Diagram
Figure 3-8 shows a simple class diagram of part of an ATM system. This diagram is inter-esting both for what it shows, and for what it does not show. Note that I have taken pains to mark all the interfaces. I consider it crucial to make sure my readers know what classes I intend to be interfaces and which I intend to be implemented. For example, the diagram immediately tells you thatWithdrawTransactiontalks to aCashDispenserinterface. Clearly some class in the system will have to implement theCashDispenser, but in this diagram we don’t care which class it is.
Note that I have not been particularly thorough in documenting the methods of the various UI interfaces. CertainlyWithdrawlUIwill need more than just the two methods shown there. What aboutpromptForAccountorinformCashDispenserEmpty? Put-ting those methods in the diagram would just clutter it. By providing a representative batch of methods, I’ve given the reader the idea. That’s all that’s really necessary.
interface ButtonListener {
... }
public class ButtonDiallerAdapter implements ButtonListener {
... }
Figure 3-6
Figure 3-7
ButtonListener
«interface»
ButtonDialler Adapter
DiallerButton Adapter
29 Chapter : Class Diagrams
Again note the convention of horizontal association and vertical inheritance. This really helps to differentiate these vastly different kinds of relationships. Without a conven-tion like this it can be hard to tease the meaning out of the tangle.
Notice how I’ve separated the diagram into three distinct zones. The transactions and their actions are on the left, the various UI interfaces are all on the right, and the UI imple-mentation is on the bottom. Note also that the connections between the groupings are min-imal and regular. In one case it is three associations, all pointing the same way. In the other case it is three inheritance relationships all merged into a single line. The grouping, and the way they are connected help the reader to see the diagram in coherent pieces.
You should be able toseethe code as you look at the diagram. Is Listing 3-1 close to what you expected for the implementation of UI?
Figure 3-8
ATM Class Diagram
Withdrawl Transaction
Deposit Transaction
Transfer Transaction
+ execute()
Transaction
«interface»
+ promptForWithdrawlAmount + informInsufficientFunds
WithdrawlUI
+ promptForDepositAmount + promptForEnvelope
DepositUI
+ promptForTransferAmount + promptForFromAccount + promptForToAccount
TransferUI
+ displayMessage
UI
SpanishUI EnglishUI
+ displayMessage
Screen
«interface»
«interface»
«interface»
«interface»
+ logMessage
MessageLog CashDispenser
DepositAccepter
30
The Details
The Details
There are a vast number of details and adornments that can be added to UML class dia-grams. Most of the time these details and adornments should not be added. But there are times when they can be helpful.
Class Stereotypes
Class stereotypes appear between guilmette3
characters, usually above the name of the class. We have seen them before. The«interface»denotation in Figure 3-8 is a class ste-reotype. «interface» is one of two standard stereotypes that can be used by java program-mers. The other is «utility».
«interface».
All the methods of classes marked with this stereotype are abstract. Noneof the methods can be implemented. Morevover, «interface» classes can have no instance variables. The only variables they can have are static variables. This corresponds exactly to java interfaces. See Figure 3-9.
«utility».
All the methods and variables of a «utility» class are static. Booch4used to call theseclass utilities. See Figure 3-10.
Listing 3-1
UI.java
public class UI implements
WithdrawlUI, DepositUI, TransferUI {
private Screen itsScreen;
private MessageLog itsMessageLog;
public void displayMessage(String message) {
itsMessageLog.logMessage(message); itsScreen.displayMessage(message); }
}
3. The quotation marks that look like double angle brackets« ». These arenottwo less-than, and two greater-than signs. If you use doubled inequality operators instead of the appropriate and proper guilmette characters, the UML policewillfind you.
interface Transaction {
public void execute(); }
Figure 3-9
4. [Booch94], p. 186 + execute()
Transaction
31 Chapter : Class Diagrams
You can make your own stereotypes if you like. I often use stereotypes like «persis-tent», «C-API», «struct», or «function». You just have to make sure that the people who are reading your diagrams know what your stereotype means.
Abstract classes
In UML there are two ways to denote that a class, or a method, is abstract. You can write the name in italics, or you can use the {abstract} property. Both options are shown in Fig-ure 3-11.
It’s a little difficult to write italics at a whiteboard, and the {abstract} property is wordy. So at the whiteboard, if I need to denote a class or method as abstract, I use the convention shown in Figure 3-12. This isn’t legal UML, but at the whiteboard it is a lot more convenient5.
Properties
Properties, like {abstract} can be added to any class. They represent extra information that’s not usually part of a class. You can create your own properties at any time.
public class Math {
public static final double PI =
3.14159265358979323;
public static double sin(double theta){...} public static double cos(double theta){...} }
Figure 3-10
public abstract class Shape {
private Point itsAnchorPoint; public abstract void draw(); }
Figure 3-11
5. Some of you may remember the Booch notation. One of the nice things about that notation was it’s convenience. It was truly a whiteboard notation.
+ PI : double + sin() + cos()
Math
«utility»
- itsAnchorPoint
Shape
+ draw() {abstract} - itsAnchorPoint
Shape
+draw()
32
The Details
Properties are written in a comma separated list of name value pairs like this:
{author=Martin, date=20020429, file=shape.java, private}
The properties in the above example are not part of UML. The {abstract} property is the only defined property of UML that java programmres would find useful.
If a property does not have a value, it is assumed to take the boolean value true. Thus {abstract} and {abstract = true} are synonyms.
Properties are written below and to the right of the name of the class as shown in Fig-ure 3-13.
Other than the {abstract} property, I don’t know when you’d this useful. Personally, in the many years that I’ve been writing UML diagrams, I’ve never had occasion to use class properties for anything.
Aggregation
Aggregation is a special form of association that connotes a “whole/part” relationship. Figure 3-14 shows how it is drawn and implemented. Notice that the implementation shown in Figure 3-14 is indistinguishable from association. That’s a hint.
Unfortunately, UML does not provide a strong definition for this relationship. This leads to confusion because various programmers and analysts adopt their own pet
defini-Figure 3-12
Figure 3-13
public class Whole {
private Part itsPart; }
Figure 3-14
+ draw() {A}
Shape
{A}
Shape
{author=Martin, date=20020429, file=shape.java, private}
33 Chapter : Class Diagrams
tions for the relationship. For that reason, I don’t use the relationship at all; and I recom-mend that you avoid it as well.
The one hard rule that UML gives us regarding aggregations is simply this. A whole cannot be its own part. Thereforeinstancescannot form cycles of aggregations. A single object cannot be an aggregate of itself; two objects cannot be aggregates of each other; three objects cannot form a ring of aggregation, etc. See Figure 3-15
I don’t find this to be a particularly useful definition. How often am I concerned about making sure that instances form a directed acyclic graph? Not very often. Therefore I find this relationship useless in the kinds of diagrams I draw.
Composition
Composition is a special form of aggregation shown in Figure 3-16. Again, notice that the implementation is indistinguishable from association. However, this time the reason is not due to a lack of definition; this time it’s because the relationship does not have a lot of use in a Java program. C++ programmers, on the other hand, find alotof use for it.
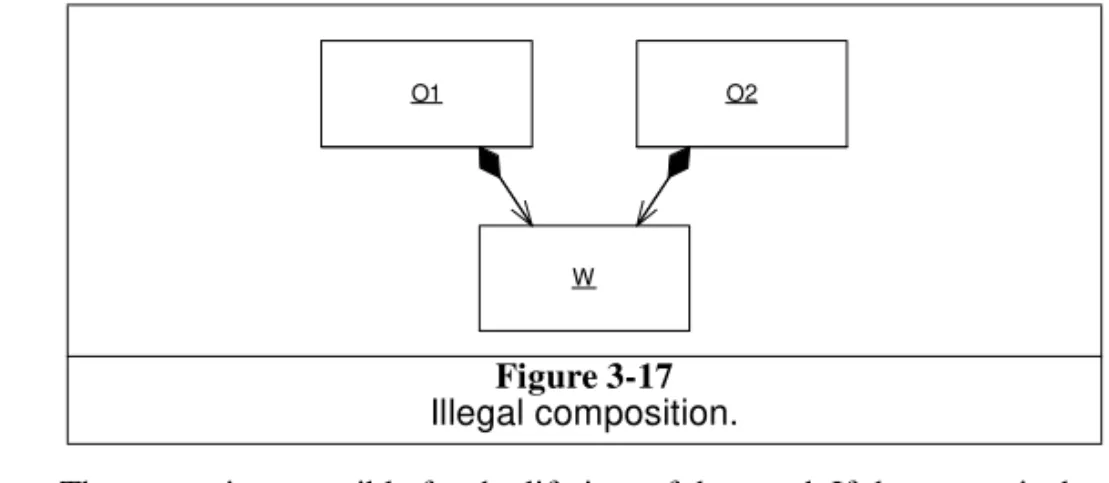
The same rule applies to Composition that applied to aggregation. There can be no cycles of instances. An owner cannot be its own ward. However UML provides quite a bit more definition.
• An instance of a ward cannot be simultaneously owned by two owners. The object diagram in Figure 3-17 is illegal. Note, however, that the corresponding class diagram is not illegal. An owner can transfer ownership of a ward to another owner.
Figure 3-15
Cycles of aggregation between instances.
public class Owner {
private Ward itsWard; }
Figure 3-16
X
Y Z
Q
P R
34
The Details
• The owner is reponsible for the lifetime of the ward. If the owner is destroyed, the ward must be destroyed with it. If the owner is copied, the ward must be cop-ied with it.
In Java destruction happens behind the scenes by the garbage collector, so there is sel-dom a need to manage the lifetime of an object. Deep copies are not unheard of, but the need to show deep copy semantics on a diagram is rare. So, though I have used composi-tion relacomposi-tionships to describe some Java programs, such use is infrequent.
Figure 3-18 shows how composition is used to denote deep copy. We have a class namedAddresswhich holds manyStrings. Each string holds one line of the address. Clearly, when you make a copy of theAddress, you want the copy to change indepen-dently of the original. Thus, we need to make a deep copy. The composition relationship between theAddressand theStrings indicates that copies need to be deep6.
Multiplicity
Objects can hold arrays or vectors of other objects; or they can hold many of the same kind of object in seperate instance variables. In UML this can be shown by placing a mul-tiplicityexpression on the far end of the association. Multiplicity expressions can be sim-ple numbers, ranges, or a combination of both. For examsim-ple Figure 3-19 shows a BinaryTreeNode, using a multiplicity of 2.
Here are the allowable forms:
• Digit. The exact number of elements
• * or 0..* zero to many.
• 0..1 Zero or one. In Java this is often implemented with a reference that can benull.
• 1..* One to many.
• 3..5 Three to five.
• 0, 2..5, 9..* Silly, but legal.
Figure 3-17
Illegal composition.
6. Exercize: Why was it enough to clone the itsLines vector? Why didn’t I have to clone the actual String instance?
O1 O2
35 Chapter : Class Diagrams
Association Stereotypes
Associations can be labeled with stereotypes that change their meaning. Figure 3-20 shows the ones that I use most often. All but the last are standard UML.
The«creates»sterotype indicates that the target of the association is created by the
source. The implication is that the source creates the target and then passes it around to other parts of the system. In the example I’ve shown a typical factory.
The«local»stereotype is used when the source class creates an instance of the target
and holds it in a local variable. The implication is that the created instance does not sur-import java.util.Vector;
public class Address implements Cloneable{ private Vector itsLines = new Vector();
public void setLine(int n, String line) { if (n >= itsLines.size())
itsLines.setSize(n+1);
itsLines.setElementAt(line, n); }
public Object clone() throws CloneNotSupportedException {
Address clone = (Address)super.clone(); clone.itsLines = (Vector)itsLines.clone(); return clone;
} }
Figure 3-18
DeepCopy is implied by Composition
public class BinaryTreeNode {
private BinaryTreeNode leftNode; private BinaryTreeNode rightNode; }
Figure 3-19
Simple multiplicity
+setLine(n,line)
Address
String
*
Cloneable
«interface»
itsLines
BinaryTreeNode
36
The Details
vive the member function that creates it. Thus, it is not held by any instance variable nor passed around the system in any way.
The «parameter» stereotype shows that the source class gains access to the target
instance though the parameter of one of its member functions. Again, the implication is that the source forgets all about this object once the member function returns. The target is not saved in an instance variable.
The«delegates»stereotype is not a standard part of UML, it is one of my own.
How-ever, I find I use it so often that I thought I’d include it here. I use it when the source class forwards a member function invocation to the target. There are a number of design pat-terns where this technique is applied, such as PROXY, DECORATOR, and COMPOSITE7. Since I use these patterns a lot, I find the notation helpful.
Inner Classes
Inner (nested) classes are represented in UML with an association adorned with a crossed circle.
Anonymous Inner Classes
One of Java’s most interesting features is anonymous inner classes. While UML does not have an official stance on these, I find the notation in Figure 3-22 works well for me. It is
public class A { public B makeB() {
return new B(); }
}
public class A { public void f() {
B b = new B(); // use b }
}
public class A { public void f(B b) {
// use b; }
}
public class A { private B itsB; public void f() {
itsB.f(); }
}
Figure 3-20
7. [GOF94] p207, 175, 163
A B
«creates»
A B
«local»
A B
«parameter»
A B
37 Chapter : Class Diagrams
concise and descriptive. The anonymous inner class is shown as a nested class that is given the «anonymous» stereotype, and is also given the name of the interface it imple-ments.
Association classes
Associations with multiplicity tell us that the source is connected to many instances of the target; but the diagram doesn’t tell us what kind of container class is used. This can be depicted by using an association class as shown in Figure 3-23.
Association classes show how a particular association is implemented. On the dia-gram they appear as a normal class connected to the association with a dashed line. As Java programmers we interpret this to mean that the source class really contains a refer-ence to the association class, which in turn contains referrefer-ences to the target.
Association classes can also be used to indicate special forms of references, such as weak, soft, or phantom references. See Figure 3-24.
On the other hand, this notation