“Study on Urban Environmental Management of Indonesian Cities Considering
Applicability of ‘Kitakyushu Model’ as Japanese Advanced Eco
-
model City”
Kitakyushu, Japan, 5thJune 2015
Proceedings of International Seminar on Collaboration Research
Water Quality Modeling of Urban Rivers: Case Study of
Cikapundung River, Bandung, Indonesia
Yonik Meilawati Yustiani
a, Leony Lidya
baDepartment of Environmental Engineering, Pasundan University, Jl. Dr. Setiabudhi 193 Bandung 40153 b perform the river quality assessment. One method to assess the river water quality is by means of simulation results of a model verified with the measurement data obtained from in the field. Modeling is a method that is easy, inexpensive, and saves time. The use of river quality model is very useful to predict the future condition using kinds of scenarios, so that the river environmental management can be formulated prior to the occurrence of pollution, environmental damage, or other disasters. Modeling of river water quality was introduced by Steeter Phelps equation using oxygen depletion curve equation (oxygen sag curve) which is using coefficients, i.e. deoxygenation rate and reaeration rate. These rates are environmental condition depended values; therefore the specific research to find the suitable rates is needed.
Furthermore, to make simulation simpler, the development of software of river water quality model is necessary. The ‘KUALA.V01’,
software to simulate BOD and DO of river water is now being designed enriched with local water characteristic. Laboratory analysis was conducted to obtain the deoxygenation rate. The software was then being tested. The model gave that the value of deoxygenation rate using laboratory analytical methods ranged from 0.01 to 0.37 per day and ultimate BOD ranged between 1.17 to 6.44 mg/L. The software gave reasonable result in its application to simulate the Cikapundung River water quality.
Keywords: BOD decay rate; deoxygenation; urban river water quality
1.Introduction
Population size is growing rapidly causing the increment of domestic wastewater derived from the municipal activities. It causes the deterioration of water quality directly and indirectly in long term, Purandara [1]. Concering this condition, especially for the surface water quality which is oftenly used as drinking water source, thus its pollution potency need to be modeled.
Recently, the function of rivers located in Bandung City turns into the discharge place of domestic and industrial wastewater. The water quality in Bandung Basin becomes deteriorated, especially in Citarum River. The dominant pollution source is domestic activities. The West Java Environmental Protection Agency estimates that the domestic wastewater was discharged from 3.5 million people directly and indirectly into the urban rivers around Bandung City. The domestic wastewater reaches up to 60% of total wastewater pours into the rivers.
The changing of the discharge pattern due to the climate uncertainty makes the difficulty to perform the river quality assessment. One method of evaluating the quality of river water is using verified model. Modeling is a method that is easy, cheap, and saves time. The use of river quality model is very useful to give prediction of conditions in the future, so that the environmental management measures can be formulated by the river immediately prior to the contamination or other disaster. Mathematical formula used in the modeling of marine environmental quality is Streeter Phelps, the formula with coefficients are reaeration and deoxygenation rate or the BOD decay rate. Empirical analysis to determine the coefficient of the deoxygenation rate needs to be conducted in order to obtain the appropriate water quality modeling for urban rivers. The deoxygenation rate coefficient will also describe the characteristics of urban river water contamination. Usually, the use of water quality models takes coefficients based on literature from other countries or Hydroscience formula with a low
Corresponding author. Tel.: +62-22-2001985; fax: +62-22-2009574.
Yustiani and Lidya / Proceedings of International Seminar on Collaboration Research (2015)
level of accuracy. Therefore, a study of the deoxygenation rate for rivers in urban areas in Indonesia will be very useful. From the literature edited by Bowie, et.al [2] it shows that determination of the deoxygenation rate in the laboratory have also suggested by the USEPA (United States Environmental Protection Agency), even though their values can be obtained by total BOD removal rate that takes into account the rate of deposition of BOD. Study of Adewumi [3] said that several ways can be done to analyze the results of laboratory experiments, such as Thomas method, least squares, Fujimoto, Rapid Ratio, Moment, and the Daily Difference.
To support the calculation, the software called ‘KUALA.V01’ was developed. This software will also be used for the information system tool in order to give uncomplicated access for the users to the river environmental quality information. The deoxygenation rates obtained from the research is used to simulate the water quality of Cikapundung River.
2.Methodology
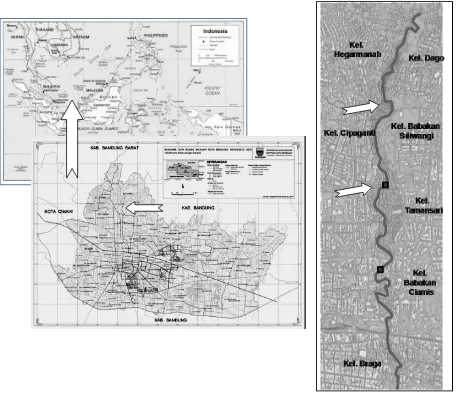
Rivers selected as the research site is the Cikapundung River. This river passes through the center of the Bandung City. Activity in the city is estimated to represent urban conditions in Indonesia. From the Cikapundung River, water samples were taken at two stations, i.e. the intersection with the Siliwangi Street, representing the upstream area and the the point on Asia Afrika Street, representing the downstream area. Figure 1 shows the sketch of the sampling site on the Cikapundung River. Water samples taken from the water column where were not impaired by sediment. In order to obtain these conditions, the sampling points chosen at the point with sufficient water depth, i.e at least 50cm.
Tests were carried out to determine the deoxygenation rate in the laboratory. Incubation process using BOD bottles, carried out for 10 days in 20oC incubator. Based on APHA [4], DO concentrations were measured every day using the modified Winkler method. Stamer, et.al [5] study showed that based on the methods of the USGS (United State Geological Survey), when the DO reaches a value below 2 mg/L, aeration should be conducted to see a decrease in oxygen concentration on the next day.
Dissolved oxygen was analyzed or defined in 2 ways: 1. Winkler titration method
This method is using iodometric titration as its principle. Water samples to be analyzed first being added with MnCl2 solution and then NaOH - KI, MnO2 precipitate will happen. By adding the H2SO4 or HCl will dissolve deposits that occur again and will also free molecular iodine (I2) which is equivalent to dissolved oxygen. The free iodine is then titrated with standard solution of sodium thiosulfate (Na2S2O3) and using the starch solution indicator.
2. Electrochemical method
The method of determining dissolved oxygen in an electrochemical method is a direct way to determine the dissolved oxygen with a DOmeter. Its principle is to use oxygen probe consisting of a cathode and an anode immersed in an electrolyte solution. In the DO meter instrument, probes typically use a cathode of silver (Ag) and anode lead (Pb). Overall, the electrode is coated with a plastic membrane that is semipermeable to oxygen.
Figure 1. Sketch of Indonesia, Bandung City, and the Cikapundung River (sampling stations are marked with square symbol).
Thomas method for BOD determination is based on the similarity of two functions, a graphical analysis using the following function [7].
ty
1 1/3
2
.
3
kL
1/3
k
2/3
3
.
43
L
1/3
1t
(1)
Where k = BOD decay rate (day-1) L = ultimate BOD (mg/L)
y = BOD uptake in time interval (mg/L)
[ty-1]1/3 =can be plot as a function of time (t) t, with slope k2/3(3,43L1/3)-1 2,3kL-1/3 = intercept point
Slope method introduced by Thomas (1937) gives a constant BOD through least-squares treatment (least squares) to form the basis of the first order reaction equation [8].
L
y
K
L
K
y
K
dt
dy
a
a 1 1
1
(2)
Yustiani and Lidya / Proceedings of International Seminar on Collaboration Research (2015)
3. ’KUALA.V01’ Software Process and Modeling
In this research, a software of river water quality was developed, named KUALA.V01. Development of the software was started with prototyping process. The prototyping was adopted as software process model and Unified Modeling Language (UML) as modeling language. Prototyping is an evolutionary process model which produces an increasingly more complete software which each iteration. This model used when: 1) objectives defined by customer are general, does not have details like input, processing, and output requirement; 2) developer unsure about the efficiency of algorithms or the form of human computer interaction should take. Prototyping model assists software engineer and customer to better understand what is to be built when requirement are fuzzy.
Prototyping start with communication, between a customer and software engineer to define overall objective, identify requirements and make a boundary. Going ahead, planned quickly and modeling (software layout visible to the customers/end-user) occurs. Quick design leads to prototype construction. Prototype is deployed and evaluated by the customer/user. Feedback from customer/end user will refine requirement and that is how iteration occurs during prototype to satisfy the needs of the customer.
Identifying the user requirements is an important phase to define: 1) Functional requirement - what software must provide to fill the need of the system intended user; 2) Non Functional requirement - a property or quality the system must have like cost, performance, security. Establishing user requirements need intensive communication with customer (the stakeholders), to understand the purposes, problems, needs and prospects/alternative solutions. It begins with data collecting which combine some methods like interview, questionnaire, document study, observation and survey.
There are three types of requirement: 1) Normal requirements - reflect objectives and goals stated for product. If requirement are present in final products, customer is satisfied; 2) Expected Requirements – customer does not explicitly state them. Customer assumes it is implicitly available with the system; 3) Exciting Requirements - Features that go beyond the customer’s expectation. In this research, we found that modelling of river water quality is the normal requirement, create various report as expected requirement and online monitoring as exciting requirements.
During meeting with customer, we need to deploy: 1) Functional deployment determines the “value” of each function required of the system; 2) Information deployment identifies data objects and events and also tied with functions; 3) Task deployment examines the behavior of the system; and 4) Value analysis determines the priority of requirements during these 3 deployments. After identified problem and requirements, it continue by modelling using UML. The result of this modelling will be discuss in the next section.
3.Result and Discussion
3.1.BOD Decay Rate
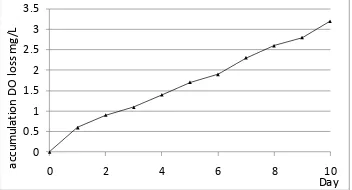
Laboratory treatment results on samples of water of upstream Cikapundung River and downstream Cikapundung River can be seen in Figure 2 and Figure 3.
Figure 2. Accumulation of oxygen consumption (upstream of Cikapundung River).
deoxygenation rate and the ultimate BOD for the river.
Sampling and laboratory results on samples of water Cikapundung River can be seen in Table 1. To obtain BOD decay rate and ultimate BOD in each water sample, methods of Thomas (1950) was used with a non-linear least squares. Regression results obtained from the distribution of the data shows the value of the coefficient of determination (R2), which approaches the value 1, indicating a high level of determination.Table 1. shows the results for the BOD decay rate and ultimate BOD for each river.
Table 1. BOD decay rate and BOD ultimate
Sampling point BOD decay rate values ranged from 14.57 to 16.31 mg /L.
3.2.Computation Scenario and Result
In this research, quick design style was implemented. Element of software i.e. data, process and interaction was designed without any detailed of it and implement directly to code of source program using visual programming tools Borland Delphi. Part of the complicated work is understanding river water quality formulation and translated the formulation into the river water quality model computation algorithm.
Since the early prototype main scenario of river water quality model and computation algorithm was not changed except the numbers of segment and interaction mode for input and output computation. Its scenario as follow:
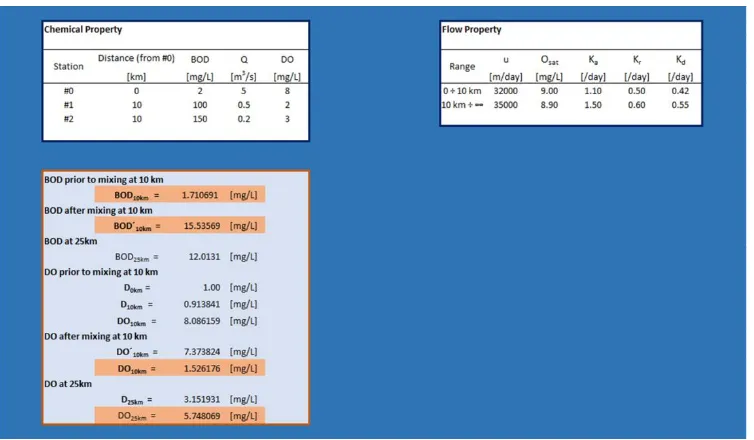
1.Input the numbers of segment (maximum 10), in the first prototype just two segments. 2.Input the distance of mix points (X).
3.Input BOD and DO of start point in the first segment (segment 1), L0 and D0. 4.Input parameter’s values before and after mix point:
Q = discharge (m3/second)
Ka = reaeration rate coefficient (day-1) Kd = deoxygenation rate coefficient (day-1) Kr = total removal rate coefficient (day-1) U = average velocity of water flow (m/s) Osat = constant of saturation oxygen
5.Input BOD and DO at mix point (it maybe there is current flows in or flows out, at this point).
Q, U, Osat are taken from measurement while Ka, Kd and Kr are taken from previous research; the value of U, Osat, Ka, Kd and Kr could be the same with the previous value if there is no current flows in or flows out. Figure 2 displayed the input screen of KUALA version 0.1 which enable just for two segments.
Using the ‘KUALA.V01’, the model gave that the value of deoxygenation rate ranged from 0.01 to 0.37
per day and ultimate BOD ranged between 1.17 to 6.44 mg/L. The software gave reasonable result in its application to simulate the Cikapundung River water quality.
Yustiani [9] give in the previous study that deoxygenation rate value using model calibration process range between 0.03 and 0.95 day-1. This study was conducted for the location of Citarum Hulu River which is situated in the sub-urban area of Bandung City. In the previous study of the River Citepus, Yustiani10 analized that the BOD ultimate concentration was 7.56 mg/L. In this study, the BOD decay rate was calculated based on Hydroscience equation. Using this equation, the value of decomposition rate was about 1.00 day-1.
Some studies determining the rate of BOD decay have been done in other countries using variety of methods including field studies, the calibration model, and experiments in the laboratory. Bowie et.al [2] wrote that one study that used laboratory tests were Bhargava (1983) with the River Ganga and Yamura (India) as the study area. BOD rate coefficient values resulted in this study were 3.5 to 5.6 day-1 for the River Ganga, and 1.4 day-1 for Yamura River.
Yustiani and Lidya / Proceedings of International Seminar on Collaboration Research (2015)
Gray's Creek River (Louisiana, USA) with the result of 1.44 day-1. In this method, a series of field data should be a reference to the calibration process. The data can be used also in accordance with the terms of such a field study.
Figure 4. The input screen of Kuala version 0.1
The range of values for the rate of BOD decay of Cikapundung River in this study showed that the activity of microorganisms in the river is relatively low. For comparison, the deoxygenation rate explained for several rivers in other countries are as follows:
- Ravi River (Pakistan) 0,14 – 0,27 day-1 [11] - Swan River (Western Australia) 0,23 day-1 [12]
- Gomti River (India) 0,45 day-1 [13]
Low figure of deoxygenation rate indicate that microogranism can not decompose the organic substances optimally. This can be caused due to an inhibition of growth and performance of microorganisms such as industrial waste containing heavy metals, high acidity, and others. In addition, medical waste from hospitals or clinics can also be inhibiting the activity of the decomposition of organic matter by microorganisms in the river, especially if the waste contains toxic chemicals or drugs that can kill microogranism.
4.Result and Discussion
The deoxygenation rate range is from 0.0233 to 0.1622 day-1, whereas the ultimate BOD values ranged from 14.57 to 16.31 mg /L. The model gave that the value of deoxygenation rate using laboratory analytical methods ranged from 0.01 to 0.37 per day and ultimate BOD ranged between 1.17 to 6.44 mg/L. The software gave reasonable result in its application to simulate the Cikapundung River water quality. This value of deoxygenation rate shows that microogranism can not optimally decompose the organic substances contained in the rivers, which can be caused to an inhibition of growth and performance of microorganisms such as industrial waste containing heavy metals, high acidity, etc.
References
[1] Purandara, B.K., Varadarajan, N., Venkatesh, B., Choubey, V.K. 2011. Surface water quality evaluation and modeling of Ghataprabha River, Karnataka, India. Environmental Monitoring Assessment. DOI 10.1007/s10661-011-2047-1. Springer. (Journal)
[2] Bowie, G. L., 1985. Rates, Contants, and Kinetics Formulation in Surface Water Quality Modeling. Second Edition. USEPA. (Book)
[5] Stamer, J.P., Bennetts, J.P., McKenzie, S.W. 1983. Determination of Ultimate Carbonaceous BOD and the Specific Rate Constants. USGS Open-file Report 82-645. (Report)
[6] Oke, I.A., Akindahunsi, A.A., 2005. A Statistical Evaluation of Methods of Determining BOD Rate. Journal of Applied Scences Research 1(2): 223-227. (Journal)
[7] Adewumi, I., Oke, I.A., Bamgboye, P.A., 2005. Determination of the Deoxygenation Rates of a Residential Institution’s
Wastewater. Journal of Applied Science 5 (1): 108-112. (Journal)
[8] Lin, S.D., 2007. Water and Wastewater Calculation Manual. 2nd Edition. McGraw-Hill. (Book)
[9] Yustiani, Y.M., Mulyani, S., Pradiko, H., 2008. Kalibarasi Model BOD, COD, dan DO Sungai Citarum Hulu untuk Menentukan Koefisien Parameter Kinetik Model. Laporan Penelitian. Jurusan Teknik Lingkungan Universitas Pasundan. (Reseach Report) [10] Yustiani, Y.M., Pradiko, H., Santika, 2007. Studi Beban Pencemaran Limbah Cair Domestik dengan Parameter BOD dan DO di
Sungai Citepus. Laporan Penelitian. Jurusan Teknik Lingkungan Universitas Pasundan. (Research Report)
[11] Haider, H, Ali, W. 2010. Development of Dissolved Oxygen Model for Highly Variable Flow River: A Case Study of Ravi River in Pakistan. Environmental Model Assessment Vol 15, pp. 583-599. (Journal)
[12] Kurup, R.G., Hamilton, D. P., 2002. Flushing of Dense, Hypoxic Water from a Cavity of the Swan Estuary, Western Australia, Estuaries Vol 25, No. 5, p. 908-915. (Journal)