GYTS
GLOBAL YOUTH TOBACCO SURVEY
Findings from the Global Youth Tobacco Survey, 2003-2014
2015
Monitoring tobacco control
among youth in selected
Member States of the
The findings of the Global Youth Tobacco Survey (GYTS) show– that exposure to secondhand smoke in homes and public places is decreasing in many countries of the Region. However, one-third of youth are still exposed to tobacco smoke in homes and public places. The health sector, in collaboration with other stakeholders, must increase awareness on the harm caused by secondhand smoke and implement youth targeted interventions to prevent exposure to secondhand smoke among youth.
While exposure to direct advertisement in print and outdoor media shows a downward trend, it is still very high. Exposure to indirect advertisement does not show any change over years. One in ten students have been receiving free samples of tobacco products
and have some objects like bags, T-shirts etc with brand logo of tobacco products. Governments must make coordinated efforts to decrease exposure to tobacco advertisement among youth through strict enforcement of existing policies that ban tobacco advertising.
Over 70% of smokers want to quit now, and many have attempted to quit but have not been successful owing to the absence of tobacco cessation support. Member States need to establish tobacco cessation facilities at all levels. Thailand has established national quit lines, an initiative worth replicating in other countries.
This brochure provides an opportunity to review in graphic form the effects
of public health policies and tobacco control interventions among the youth in Member States of the Region.
In compliance with Article 21 of the WHO Framework Convention on Tobacco Control (WHO FCTC), Member States in the Region have been monitoring tobacco control among youth using the standard protocol of the GYTS. Member States are committed to protecting their youth from the ill effects of tobacco. WHO commends and continues to support Member States in their efforts to protect youth from the scourge of tobacco.
Message
Dr Poonam Khetrapal Singh
The Global Youth Tobacco Survey (GYTS), a component of the Global Tobacco Surveillance System (GTSS), is a global standard for systematically monitoring youth tobacco use (smoking and smokeless) and tracking key tobacco control indicators.
GYTS is a nationally representative school based survey of students in grades associated with 13–15 years of age and is designed to produce cross-sectional estimates for each country. GYTS uses a standard core questionnaire, sample design, and data collection protocol. It assists countries in fulfilling their obligations under the World Health Organization (WHO) Framework Convention on Tobacco Control (FCTC) to generate comparable data within and across countries. WHO has developed MPOWER, a package of selected demand reduction
measures contained in the WHO FCTC. GYTS uses a global standardized methodology that includes a two-stage sample design with schools selected with a probability proportional to enrolment size. The classes within selected schools are chosen randomly and all students in selected classes are eligible to participate in the survey.
The survey uses a standard core questionnaire with a set of optional questions that permits adaptation to meet the needs of the country on tobacco use and key tobacco control indicators. The questionnaire consists of the following topics: tobacco use (smoking and smokeless), cessation, secondhand smoke (SHS), pro-and anti-tobacco media and advertising, access and availability to obtain tobacco products, and knowledge and attitudes regarding tobacco.
The questionnaire is selfadministered; using scannable paper-based bubble sheets, and it is anonymous to ensure confidentiality. The purpose of GYTS is to enhance the capacity of countries to monitor tobacco use among youth; guide national tobacco prevention and control programmes; and facilitate comparison of tobacco related data at the national, regional and global levels.
This brochure contains selected indicators of youth tobacco control during 2003–2014 and shows trends in selected Member States of WHO’s South-East Asia Region at the national level. The target audience is multistake holders of youth tobacco control such as NGOs, Government departments, academia and researchers.
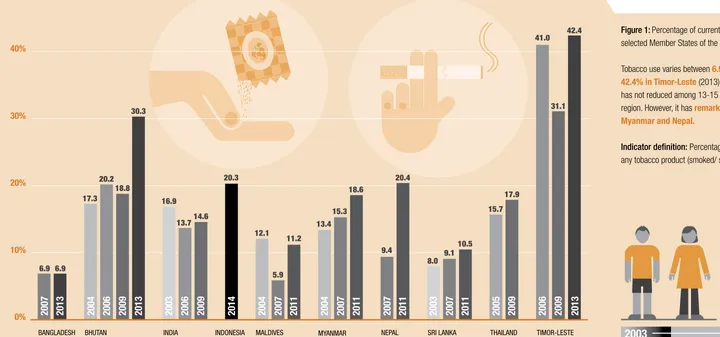
Figure 1: Percentage of current tobacco users among youth in selected Member States of the South-East Asia Region.
Tobacco use varies between 6.9% in Bangladesh (2013)
42.4% in Timor-Leste (2013). Prevalence of tobacco use has not reduced among 13-15 year olds in any county of the region. However, it has remarkably increased in Bhutan, Myanmar and Nepal.
Indicator definition: Percentage of youth who currently use any tobacco product (smoked/ smokeless) in the past 30 days.
Tobacco Use - Smoked and/or Smokeless
0% 10% 20% 30% 40% 50%
2007
2013
2004
2006
2009
2013
2003
2006
2009
2014
2004
2007
2011
2004
2007
2011
2007
2011
2003
2007
2011
2005
2009
2006
2009
2013
6.9 6.9 17.3
20.2 18.8
30.3
16.9
13.7 14.6
20.3
12.1
5.9 11.2
13.4 15.3
18.6
9.4
8.0 9.1
10.5 15.7
17.9 20.4
41.0
BANGLADESH
5%
0% 10% 15% 20% 25%
BHUTAN INDIA INDONESIA MALDIVES MYANMAR NEPAL SRI LANKA THAILAND TIMOR-LESTE
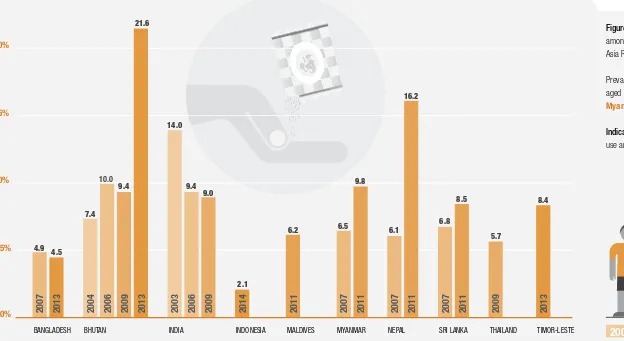
Figure 2: Percentage of current smokeless tobacco users among youth in selected Member Statess of the South-East Asia Region.
Prevalence of smokeless tobacco use among student aged 13-15 years old is on the increase in Bhutan, Myanmar and Nepal.
Indicator definition: Percentage of youth who currently use any smokeless tobacco product in the past 30 days.
Tobacco Use - Smokeless Tobacco
2003
2014
2007
2013
2004
2006
2009
2013
2003
2006
2009
2014
2011
2007
2011
2007
2011
2007
2011
2009
2013
4.94.5
7.4
10.0
9.4 21.6
14.0
9.4 9.0
2.1
6.2 6.5 9.8
6.1 16.2
6.8 8.5
5.7
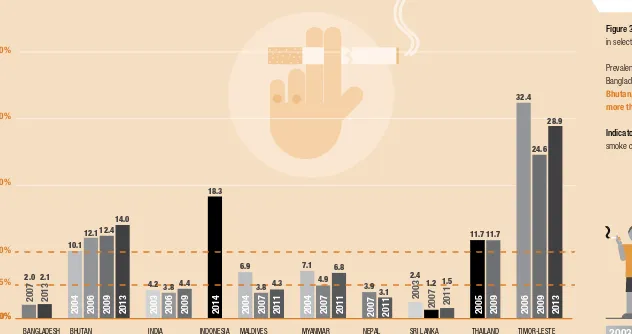
Figure 3: Percentage of current cigarette smokers among youth in selected Member States of the South-East Asia Region.
Prevalence of cigarette smoking is less than 5% in Bangladesh, India, Maldives, Nepal and Sri Lanka. However
Bhutan, Indonesia, Thailand and Timor-Leste have more than 10% prevalence of cigarette smoking.
Indicator definition: Percentage of youth who currently smoke cigarettes in the past 30 days.
Tobacco Use - Cigarette Smoking
0% 0% 5% 10% 20% 30% 50%
40%
NO SMOKING
2007
2013
2006
2009
2013
2003
2003
2006
2009
2014
2007
2011
2007
2011
2007
2011
2007
2011
2009
2006
2009
2013
2004
2004
2004
2005
2.0 2.1 10.1
12.1 14.0 12.4
4.2 3.8 4.4 18.3
6.9
3.8 4.3 7.1
4.9 6.8
3.9
2.4 1.2 1.5
11.7 11.7
3.1
32.4
BANGLADESH BHUTAN INDIA INDONESIA MALDIVES MYANMAR NEPAL THAILAND TIMOR-LESTE
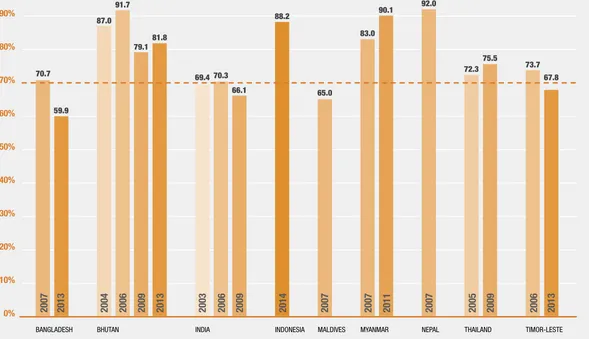
Figure 4: Percentage of current smokers who want to stop smoking among youth in selected Member States of the South-East Asia Region.
Nearly seven in ten smokers want to quit smoking but they are not able to do so due to lack of cessation support in countries of the Region.
Indicator definition: Percentage of current smokers who want to stop smoking among current smokers.
Cessation - Want to Stop Smoking
2003
2014
0% 20% 40% 60% 80% 100%
10% 30% 50% 70% 90%
2007
2013
2004
2006
2009
2013
2003
2006
2009
2014
2007
2007
2011
2007
2005
2009
2006
2013
70.759.9
87.0 91.7
88.2
81.8 79.1
69.4 70.3 66.1
83.0 90.1
65.0
92.0
72.3 75.5
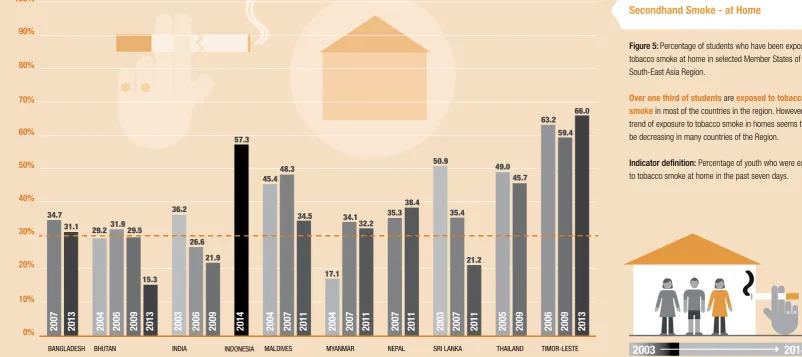
Figure 5: Percentage of students who have been exposed to tobacco smoke at home in selected Member States of the South-East Asia Region.
Over one third of students are exposed to tobacco smoke in most of the countries in the region. However, trend of exposure to tobacco smoke in homes seems to be decreasing in many countries of the Region.
Indicator definition: Percentage of youth who were exposed to tobacco smoke at home in the past seven days.
Secondhand Smoke - at Home
0% 10% 20% 30% 40% 50% 60% 70% 80% 90% 100%
34.7 31.1
29.2 31.9
15.3 29.5
36.2
26.6
21.9 57.3
45.4 48.3
34.5
17.1 34.1
32.2 35.3
50.9
35.4
21.2 49.0
45.7
38.4
63.2 59.4
66.0
BANGLADESH BHUTAN INDIA INDONESIA MALDIVES MYANMAR NEPAL SRI LANKA THAILAND TIMOR-LESTE
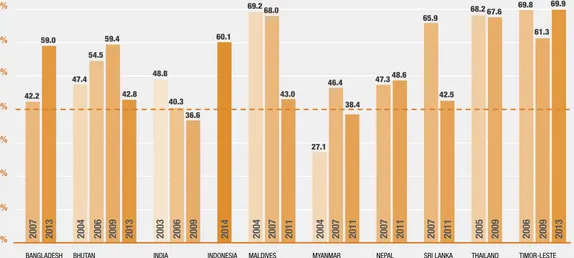
Figure 6: Percentage of students who are exposed to tobacco smoke at public place in selected Member States of the South-East Asia Region.
Nearly two in five students are exposed to tobacco smoke in public place, in most of the countries of the Region. However, exposure to tobacco smoke in public places shows decreasing trend in many countries of the Region.
Indicator definition: Percentage of youth who were exposed to tobacco smoke in enclosed public places in the past seven days.
Note: Figures are taken for enclosed and outdoor public places; as of 2011, enclosed public places and outdoor public places are separate entities.
Secondhand Smoke - at Public Place
2003
2014
0% 10% 20% 30% 40% 50% 60% 70% 80% 90% 100%
2007
2013
2004
2006
2009
2013
2003
2006
2009
2014
2004
2007
2011
2004
2007
2011
2007
2011
2007
2011
2005
2009
2006
2009
2013
42.259.0
47.4 54.5
69.2
48.8
42.8 59.4
40.3 36.6
60.1
43.0
27.1 68.0
46.4
38.4
48.6 47.3
61.3 69.8 67.6 68.2
42.5 65.9
69.9
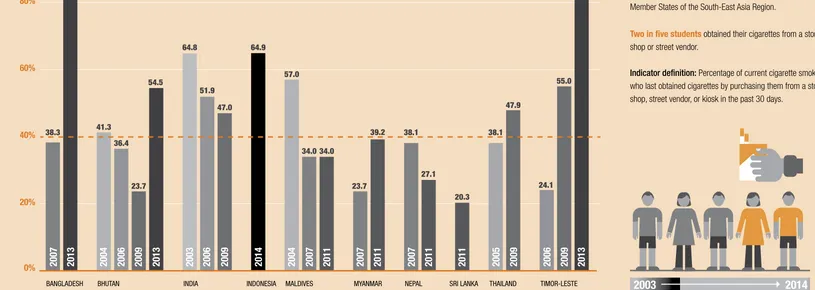
Figure 7: Percentage of students who obtained cigarettes by buying them from a store, shop or street vendor in selected Member States of the South-East Asia Region.
Two in five students obtained their cigarettes from a store, shop or street vendor.
Indicator definition: Percentage of current cigarette smokers who last obtained cigarettes by purchasing them from a store, shop, street vendor, or kiosk in the past 30 days.
Access and Availability - Obtain Cigarettes
0% 20% 40% 60% 80% 100%
2007
2013
2004
2006
2009
2013
2003
2006
2009
2014
2004
2007
2011
2007
2011
2007
2011
2011
2005
2009
2006
2009
2013
38.3 84.8
41.3
36.4
23.7 54.5
57.0
51.9
47.0 64.9 64.8
34.0 34.0
23.7
39.2 38.1
27.1
20.3
38.1 47.9
24.1 55.0
BANGLADESH BHUTAN INDIA INDONESIA THAILAND TIMOR-LESTE
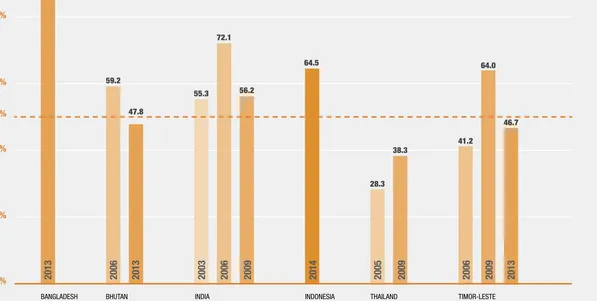
Figure 8: Percentage of current cigarettes buyers were not stopped because of their age in selected Member States of the South-East Asia Region.
Nearly half of current cigarette buyers were not stopped because of their age in most of countries of the Region.
Indicator definition: Percentage of current cigarette smokers who were not stopped from buying cigarettes in the past 30 days because of their age.
Access and Availability - Sale to Minors
2003
2014
0% 20% 40% 60% 50% 80% 100%
2013
2006
2013
2003
2006
2009
2014
2005
2009
2006
2009
2013
86.147.8 59.2
55.3 72.1
56.2
64.5
28.3 38.3
41.2 64.0
46.7
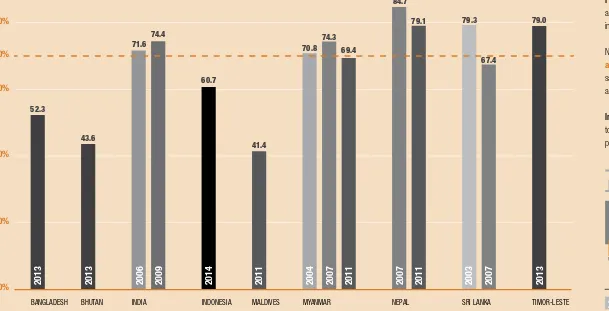
Figure 9: Percentage of students who noticed tobacco advertisements or promotion, on billboards or at points of sale in selected Member States of the South-East Asia Region.
Nearly seven in ten students noticed tobacco advertisement or promotion on billboards or at points of sale in most of the countries of the Region. However this is a decreasing trend in many countries of the Region.
Indicator definition: Percentage of youth who saw any tobacco marketing on billboard or at points of sale in the past 30 days.
Media - Noticed Tobacco Advertisements
or Promotion at POS
0% 20% 40% 60% 80% 70% 100%
2013
2013
2006
2009
2014
2011
2004
2007
2011
2007
2011
2003
2007
2013
52.3
43.6
71.6 74.4
60.7
41.4
70.8 74.3
69.4
84.7
79.1 79.3
67.4
BANGLADESH BHUTAN INDIA INDONESIA MALDIVES MYANMAR NEPAL SRI LANKA THAILAND TIMOR-LESTE
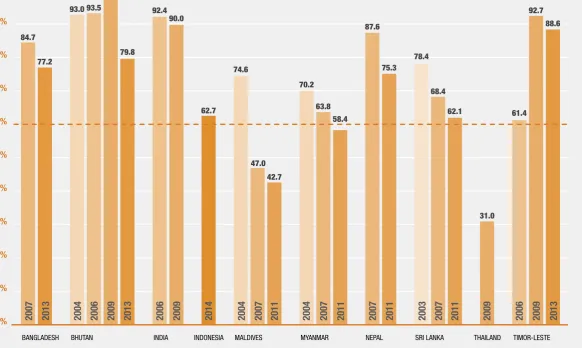
Figure 10: Percentage of students who noticed pro-cigarette advertisements in print media or TV, videos or movies in selected Member States of the South-East Asia Region.
Nearly three in five students noticed cigarette advertisement in print media or TV, videos or movies in most of the countries of the Region. However, this is a decreasing trend in many countries of the Region.
Indicator definition: Percentage of youth who saw someone using tobacco on television, videos, or movies in the past 30 days.
Media - Noticed Pro-cigarette
Advertisements in Media
2003
2014
0% 20% 40% 60% 80% 100%
10% 30% 50% 70% 90%
2007
2013
2004
2006
2009
2013
2006
2009
2014
2004
2007
2011
2004
2007
2011
2007
2011
2003
2007
2011
2009
2006
2009
2013
84.777.2
93.0 93.5
74.6 79.8
98.4
92.4 90.0
62.7
42.7 70.2
63.8 58.4
87.6
75.3
47.0
78.4
68.4
62.1
31.0
92.7
61.4
Figure 11: Percentage of students offered free tobacco samples by tobacco company/professionals in selected Member States
of the South-East Asia Region.
Nearly one in 10 students responded that they have been offered free tobacco samples by tobacco company/ professionals in most countries of the Region.
Indicator definition: Percentage of youth who were ever offered a free tobacco product from a tobacco company representative.
Media - Free Tobacco Samples
6.4 6.3 13.7
11.1
8.1 11.2
9.7
7.9
10.6
7.1 7.4
10.5
8.7 12.5
7.9 13.1
3.0 2.9
5.5 10.2
5.9
21.9 23.0
12.4
0% 5% 10% 15% 20% 25%
2007
2013
2004
2006
2013
2006
2009
2014
2004
2007
2011
2004
2007
2011
2007
2011
2003
2007
2011
2005
2009
2006
2009
2013
1 in 10
BANGLADESH BHUTAN INDONESIA MALDIVES MYANMAR NEPAL SRI LANKA THAILAND TIMOR-LESTE
Figure 12: Percentage of students own something that carries a tobacco brand logo in selected Member States of the South-East Asia Region.
Nearly one in ten students agreed that they have something that caries tobacco brand logo in most of the countries of the Region.
Indicator definition: Percentage of youth who have something that caries a tobacco product brand logo.
Media - Tobacco Brand Logo
2003
2014
0% 10% 20% 30% 40% 50%
2007
2013
2004
2006
2009
2013
2014
2004
2007
2011
2004
2007
2011
2007
2011
2003
2007
2011
2005
2009
2006
2009
2013
14.012.8
9.0 9.1 10.5 14.9
9.0
13.0
8.1 10.0
12.7
8.8 8.6
11.0 13.7
10.7
23.1 34.3
9.3 42.0
4.6 5.7
The findings from the Global Youth Tobacco Survey
(GYTS), 2003–2014 have been presented in graphic
form and by year on important indicators of tobacco
control among youth in selected Member States of the
Region. These findings also provide an opportunity to
compare the findings of GYTS within countries by year
as well as across countries.
The data presented in graphic form will be particularly
useful for programme managers, tobacco control
advocates and any other relevant stakeholders for
generating credible evidence to further promote
tobacco control.
9 7 8 9 2 9 0 2 2 4 8 4 6
For further information, please contact:
Dr Dhirendra N Sinha
Regional Adviser,
Surveillance (Tobacco Control), E-mail: [email protected]
Mr Naveen Agarwal
Data Analyst, (Tobacco Control), E-mail: [email protected]
.infonauts.in