LAMPIRAN 1
Kuesioner
KUESIONER PENELITIAN
Hal : Permohonan Menjadi Responden
Kepada :
Yth. Bapak/Ibu/Saudara/(i) Di- tempat
Dengan Hormat, Yang bertanda tangan dibawah ini, saya:
Nama : Tri Septiana Muhlisa
NIM : 1410421102
No. Hp : 082332223052
Email : [email protected]
Judul Skripsi : Pengaruh Partisipasi Anggaran, Informasi Asimetri, Budaya Organisasi dan Group Cohesiveness terhadap Budetary Slack Kuesioner ini ditujukan untuk responden guna memperoleh data yang akan digunakan untuk tugas akhir (skripsi) sebagai salah satu syarat untuk memperoleh gelar sarjana dalam bidang akuntansi. Untuk itu, saya memohon kesediaan Bapak/Ibu/Saudara/(i) untuk mengisi kueisioner ini. Saya menyadari bahwa dalam pengisian kuesioner ini akan menyita waktu Bapak/Ibu/Saudara/(i). Akan tetapi, Kontribusi Bapak/Ibu/Saudara (i) sangat penting bagi penelitian ini secara keseluruhan.
Saya akan menjaga kerahasiaan dari semua jawaban/ pendapat yang telah Bapak/Ibu/Saudara/(i) berikan dalam kuesioner terlampir. Informasi yang diberikan hanya digunakan untuk kepentingan terbatas. Data yang diperoleh semata-mata hanya untuk kepentingan penelitian ilmiah, dan hanya ringkasan dari hasil analisis yang akan dilaporkan atau dipublikasikan.
Demikian permohonan ini saya ajukan, atas kesediaan, partisipasi dan kerjasama yang baik, saya sampaikan terima kasih.
Hormat saya,
Tri Septiana Muhlisa
NIM. 1410421102
BAGIAN I
IDENTITAS RESPONDEN
Petunjuk : Dimohon Bapak/Ibu/Saudara/(i) berkenan untuk mengisi identitas secara lengkap dan dengan memberikan tanda thickmark () pada kolom pilihan sesuai dengan keterangan yan ada pada setiap pertanyaan.
1. Nama :
2. Jenis Kelamin : Laki Perempuan
3. Umur :
4. Frekuensi mengikuti pelatihan :
5. Pengalaman terlibat dalam penyusunan anggaran : 6. Lama Bekerja :
7. Unit Kerja : 8. No. Tlp/Hp :
BAGIAN II
DAFTAR PERTANYAAN
Petunjuk : Dimohon Bapak/Ibu/Saudara/(i) berkenan untuk memberikan tanda thickmark () pada salah satu kolom di samping pertanyaan untuk menentukan seberapa setuju Bapak/Ibu/Saudara/(i) mengenai hal-hal berikut:
STS = Sangat Tidak Setuju TS = Tidak Setuju
N = Netreal S = Setuju
SS = Sangat Setuju
Budgetary Slack
NO. PERTANYAAN STS TS N S SS
1. Standar yang digunakan di dalam anggaran mendorong produktivitas yang tinggi di wilayah tanggung jawab saya.
2. Anggaran pada departemen yang menjadi tanggung jawab saya, dapat dipastikan terlaksana dengan baik.
3. Anggaran yang menjadi tanggung jawab saya perlu pengawasan.
4. Anggaran yang menjadi tanggung jawab saya tidak menuntut terlalu tinggi.
5. Adanya target anggaran yang harus saya capai, t idak terlalu membuat saya ingin memperbaiki tingkat efisiensi.
6. Saya menganggap sasaran yang dijabarkan dalam anggaran sulit untuk dicapai atau di realisasikan.
7. Anggaran yang menjadi tanggung jawab menuntut terlalu tinggi.
8. Saya menganggap sasaran yang dijabarkan
dalam anggaran mudah untuk dicapai atau di
realisasikan.
Partisipasi Anggaran
NO. PERTANYAAN STS TS N S SS
1. Saya terlibat dalam proses pengusulan dan penyusunan anggaran bidang yang menjadi tanggung jawab saya.
2. Atasan saya selalu memberikan penilaian terhadap anggaran yang telah ditentukan.
3. Atasan saya selalu meminta pendapat saya pada saat menentukan sasaran angaran instansi.
4. Saya memiliki pengaruh yang besar dalam penentuan jumlah anggaran final bidang yang menjadi tanggung jawab saya.
5. Saya memiliki kontribusi penting terhadap anggaran yang menjadi tanggung jawab saya.
6. Atasan saya sering meminta pendapat saya selama penyusunan anggaran yang menjadi tanggung jawab saya.
7. Saya tidak terlibat dalam proses pengusulan dan penyusunan anggaran bidang yang menjadi tanggung jawab saya.
8. Atasan saya tidak pernah meminta pendapat
saya selama penyusunan anggaran yang
menjadi tanggung jawab saya.
Informasi Asimetri
NO. PERTANYAAN STS TS N S SS
1. Saya memiliki informasi yang lebih baik dari pada atasan saya mengenai kegiatan yang dilakukan dalam pusat pertanggungjawaban saya.
2. Saya lebih mengetahui hubungan input dan output kegiatan operasi internal pada unit yang menjadi tangung jawab saya, dibanding atasan.
3. Saya memiliki informasi mengenai potensi kinerja dipusat pertanggungjawaban saya, dibanding atasan.
4. Saya lebih mengetahui mengenai teknik kerja pusat pertanggungjawaban saya, dibanding atasan .
5. Saya lebih mampu menilai dampak potensi faktor eksternal terhadap kegiatan yang ada dalam pusat pertangungjawaban saya, dibanding atasan.
6. Saya lebih memahami apa yang dapat dicapai pusat pertangungjawaban saya, dibandingkan atasan.
7. Atasan saya memiliki informasi yang lebih mengenai potensi kinerja dipusat pertanggungjawaban saya, dibanding saya sendiri.
8. Atasan saya memiliki informasi yang lebih baik
dari pada saya mengenai kegiatan yang
dilakukan dalam pusat pertanggungjawaban
saya.
Budaya Organisasi
NO. PERTANYAAN STS TS N S SS
1. Saya selalu menciptakan ide-ide yang inovatif dalam pekerjaan
2. Bila terjadi kesalahan maka saya berani menanggung resikonya.
3. Saya lebih senang menyelesaikan pekerjaan dengan kerja sama tim.
4. Loyalitas saya terhadap tim sangat tinggi . 5. Saya tidak puas dengan satu tugas, sehingga
saya tertantang dengan tugas berikutnya.
6. Saya selalu datang tepat waktu.
7. Saya lebih senang menyelesaikan pekerjaan sendiri dibandingkan dengan tim.
8. Saya kurang menciptakan ide-ide yang inovatif dalam pekerjaan.
Group Cohesiveness
NO. PERTANYAAN STS TS N S SS
1. Dalam susah dan senang, saya selalu tetap bergabung dalam kelompok kerja.
2. Bagi saya kelompok kerja saya sudah saya anggap sebagai keluarga.
3. Saya suka dengan kekompakan kelompok kerja saya.
4. Saya percaya dengan kelompok kerja saya bisa diandalkan meskipun dalam keadaan susah.
5. Saya merasa kelompok kerja saya kurang memiliki rasa kebersamaan.
6. Saya merasa ingin selalu bergabung dalam
kelompok kerja lain dibanding kelompok saya
sendiri.
LAMPIRAN 2
Rekapitulasi Kuesioner
Tabulasi Data Kuesioner Responden
PARTISIPASI ANGGARAN (X1) INFORMASI ASIMETRI (X2) BUDAYA ORGANISASI (X3)
X1.1 X1.2 X1.3 X1.4 X1.5 X1.6 X1 X2.1 X2.2 X2.3 X2.4 X2.5 X2.6 X2 X3.1 X3.2 X3.3 X3.4 X3.5 X3.6 X3
4 3 4 4 3 4 22 4 4 4 4 4 4
24
3 4 4 4 4 423
4 4 5 4 4 4 25 4 4 4 4 5 5
26
4 4 4 4 5 425
4 3 4 4 4 4 23 3 4 4 4 5 4
24
5 4 4 4 4 425
5 5 4 4 5 4 27 3 3 3 3 5 5
22
5 5 5 5 5 530
5 3 4 4 5 3 24 4 3 4 4 4 3
22
5 4 4 5 4 426
3 2 3 3 2 3 16 3 3 3 3 3 2
17
3 3 3 3 3 318
4 3 4 3 4 4 22 3 4 3 4 4 4
22
4 3 4 3 4 422
4 4 4 3 4 4 23 3 3 4 4 4 4
22
4 5 4 4 4 526
4 3 4 3 4 4 22 3 3 3 4 4 4
21
4 3 4 4 4 423
3 4 4 4 4 3 22 3 4 4 3 4 4
22
4 4 4 4 4 525
4 3 4 4 3 4 22 4 3 4 3 4 4
22
4 5 4 4 4 526
3 2 3 3 2 3 16 3 3 3 3 3 3
18
3 3 3 3 3 318
4 4 3 4 3 4 22 4 3 3 3 4 4
21
4 3 4 4 4 322
2 3 3 2 3 3 16 4 4 4 4 3 3
22
3 4 3 3 3 319
4 3 4 4 3 4 22 3 4 4 4 4 4
23
5 4 4 5 4 426
2 3 2 3 3 3 16 3 3 3 3 3 3
18
3 3 3 3 3 318
3 3 3 2 2 2 15 2 3 3 4 3 3
18
3 3 4 4 3 421
3 3 3 2 3 2 16 4 5 5 5 3 2
24
3 3 3 3 3 318
3 3 2 3 3 3 17 4 5 5 5 3 2
24
3 4 3 4 4 422
5 5 5 5 5 5 30 3 4 4 5 5 5
26
5 4 5 5 5 529
3 2 3 3 2 3 16 4 4 5 5 4 3
25
3 4 3 3 3 319
4 3 4 3 4 3 21 3 4 4 5 4 4
24
4 4 3 4 4 322
3 4 4 4 4 4 23 4 5 5 5 4 3
26
4 3 4 3 4 321
4 4 3 4 4 4 23 3 4 4 5 4 3
23
4 3 4 4 4 322
4 4 4 4 3 4 23 4 4 5 5 4 4
26
4 4 4 4 4 323
4 4 4 4 3 4 23 3 3 4 4 4 4
22
4 3 4 4 4 423
4 3 4 3 4 3 21 4 4 4 5 4 4
25
4 4 3 3 4 523
5 5 5 5 5 5 30 3 4 5 5 5 4
26
5 4 4 4 5 527
4 4 4 5 4 4 25 5 5 5 5 3 5
28
4 3 3 4 3 320
5 5 5 5 5 5 30 4 4 5 5 5 5
28
5 4 5 5 5 529
GROUP COHESIVENESS (X4) BUDGETARY SLACK (Y)
X4.1 X4.2 X4.3 X4.4 X4 Y1 Y2 Y3 Y4 Y5 Y6 Y
4 5 4 5 18 4 4 5 4 5 4 26
5 5 4 4 18 5 4 4 5 5 5 28
4 4 5 4 17 4 4 5 4 4 5 26
5 5 5 5 20 5 5 5 5 5 5 30
4 4 4 4 16 4 4 5 5 4 4 26
3 3 3 3 12 3 3 3 3 3 3 18
3 4 5 3 15 4 4 4 3 4 4 23
4 4 4 4 16 4 4 4 4 4 4 24
4 4 4 4 16 4 4 4 4 4 4 24
4 4 4 4 16 4 4 4 4 4 4 24
4 4 4 4 16 4 4 4 4 4 4 24
3 3 3 3 12 3 3 3 3 3 3 18
3 4 4 4 15 3 4 4 4 4 4 23
3 3 3 3 12 3 3 3 4 3 4 20
4 4 4 5 17 5 4 5 4 4 4 26
3 3 3 3 12 3 3 3 3 3 3 18
3 3 2 3 11 3 3 3 3 3 3 18
3 3 3 3 12 3 3 3 3 3 3 18
3 3 3 3 12 3 3 3 3 3 3 18
5 5 5 5 20 5 5 5 5 5 5 30
3 3 3 3 12 3 3 3 3 3 3 18
4 4 4 4 16 4 4 4 4 4 4 24
4 4 3 3 14 4 4 4 4 4 4 24
3 4 3 4 14 4 4 4 4 4 4 24
4 4 4 4 16 4 4 4 4 4 4 24
4 4 4 4 16 4 4 4 4 4 4 24
4 3 4 3 14 4 4 4 4 4 4 24
5 3 3 3 14 5 5 5 5 5 5 30
3 5 4 4 16 3 5 4 4 5 5 26
5 5 5 5 20 5 5 5 5 5 5 30
Lampiran 3
Frekuensi Pernyataan Responden
Frekuensi Pernyataan Responden PARTISIPASI ANGGARAN (X1)
Statistics Partisipasi
Anggaran (X1.1)
Partisipasi Anggaran (X1.2)
Partisipasi Anggaran (X1.3)
Partisipasi Anggaran (X1.4)
Partisipasi Anggaran (X1.5)
Partisipasi Anggaran (X1.6)
Partisipasi Anggaran (X1)
N
Valid 30 30 30 30 30 30 30
Missing 0 0 0 0 0 0 0
Frequency Table
Partisipasi Anggaran (X1.1) Frequency Percent Valid Percent
Cumulative Percent
Valid
2 2 6,7 6,7 6,7
3 8 26,7 26,7 33,3
4 15 50,0 50,0 83,3
5 5 16,7 16,7 100,0
Total 30 100,0 100,0
Partisipasi Anggaran (X1.3)
Frequency Percent Valid Percent Cumulative Percent
Valid
2 2 6,7 6,7 6,7
3 8 26,7 26,7 33,3
4 16 53,3 53,3 86,7
5 4 13,3 13,3 100,0
Total 30 100,0 100,0
Partisipasi Anggaran (X1.5) Frequency Percent Valid
Percent
Cumulative Percent
Valid
2 4 13,3 13,3 13,3
3 10 33,3 33,3 46,7
4 11 36,7 36,7 83,3
5 5 16,7 16,7 100,0
Total 30 100,0 100,0
Partisipasi Anggaran (X1.2) Frequency Percent Valid
Percent
Cumulative Percent
Valid
2 3 10,0 10,0 10,0
3 14 46,7 46,7 56,7
4 9 30,0 30,0 86,7
5 4 13,3 13,3 100,0
Total 30 100,0 100,0
Partisipasi Anggaran (X1.4) Frequency Percent Valid
Percent
Cumulative Percent
Valid
2 3 10,0 10,0 10,0
3 10 33,3 33,3 43,3
4 13 43,3 43,3 86,7
5 4 13,3 13,3 100,0
Total 30 100,0 100,0
Partisipasi Anggaran (X1.6) Frequency Percent Valid
Percent
Cumulative Percent
Valid
2 2 6,7 6,7 6,7
3 10 33,3 33,3 40,0
4 15 50,0 50,0 90,0
5 3 10,0 10,0 100,0
Total 30 100,0 100,0
Partisipasi Anggaran (X1) Frequency Percent Valid
Percent
Cumulative Percent
Valid
15 1 3,3 3,3 3,3
16 6 20,0 20,0 23,3
17 1 3,3 3,3 26,7
21 2 6,7 6,7 33,3
22 7 23,3 23,3 56,7
23 6 20,0 20,0 76,7
24 1 3,3 3,3 80,0
25 2 6,7 6,7 86,7
27 1 3,3 3,3 90,0
30 3 10,0 10,0 100,0
Total 30 100,0 100,0
Frekuensi Pernyataan Responden
INFORMASI ASIMETRI (X2)
Statistics Informasi
Asimetri (X2.1)
Informasi Asimetri (X2.2)
Informasi Asimetri (X2.3)
Informasi Asimetri (X2.4)
Informasi Asimetri (X2.5)
Informasi Asimetri (X2.6)
Informasi Asimetri (X2)
N
Valid 30 30 30 30 30 30 30
Missing 0 0 0 0 0 0 0
Frequency Table
Informasi Asimetri (X2.1) Frequency Percent Valid
Percent
Cumulative Percent
Valid
2 1 3,3 3,3 3,3
3 15 50,0 50,0 53,3
4 13 43,3 43,3 96,7
5 1 3,3 3,3 100,0
Total 30 100,0 100,0
Informasi Asimetri (X2.3) Frequency Percent Valid
Percent
Cumulative Percent
Valid
3 9 30,0 30,0 30,0
4 13 43,3 43,3 73,3
5 8 26,7 26,7 100,0
Total 30 100,0 100,0
Informasi Asimetri (X2.5) Frequency Percent Valid
Percent
Cumulative Percent
Valid
3 8 26,7 26,7 26,7
4 16 53,3 53,3 80,0
5 6 20,0 20,0 100,0
Total 30 100,0 100,0
Informasi Asimetri (X2.2) Frequency Percent Valid
Percent
Cumulative Percent
Valid
3 11 36,7 36,7 36,7
4 15 50,0 50,0 86,7
5 4 13,3 13,3 100,0
Total 30 100,0 100,0
Informasi Asimetri (X2.4) Frequency Percent Valid
Percent
Cumulative Percent
Valid
3 7 23,3 23,3 23,3
4 11 36,7 36,7 60,0
5 12 40,0 40,0 100,0
Total 30 100,0 100,0
Informasi Asimetri (X2.6) Frequency Percent Valid
Percent
Cumulative Percent
Valid
2 3 10,0 10,0 10,0
3 8 26,7 26,7 36,7
4 14 46,7 46,7 83,3
5 5 16,7 16,7 100,0
Total 30 100,0 100,0
Informasi Asimetri (X2)
Frequency Percent Valid Percent Cumulative Percent
Valid
17 1 3,3 3,3 3,3
18 3 10,0 10,0 13,3
21 2 6,7 6,7 20,0
22 8 26,7 26,7 46,7
23 3 10,0 10,0 56,7
24 4 13,3 13,3 70,0
25 2 6,7 6,7 76,7
26 5 16,7 16,7 93,3
28 2 6,7 6,7 100,0
Total 30 100,0 100,0
Frekuensi Pernyataan Responden
BUDAYA ORGANISASI (X3)
Statistics Budaya
Organisasi (X3.1)
Budaya Organisasi (X3.2)
Budaya Organisasi (X3.3)
Budaya Organisasi (X3.4)
Budaya Organisasi (X3.5)
Budaya Organisasi (X3.6)
Budaya Organisasi (X3)
N
Valid 30 30 30 30 30 30 30
Missing 0 0 0 0 0 0 0
Frequency Table
Budaya Organisasi (X3.1) Frequency Percent Valid
Percent
Cumulative Percent
Valid
3 9 30,0 30,0 30,0
4 14 46,7 46,7 76,7
5 7 23,3 23,3 100,0
Total 30 100,0 100,0
Budaya Organisasi (X3.3) Frequency Percent Valid
Percent
Cumulative Percent
Valid
3 10 33,3 33,3 33,3
4 17 56,7 56,7 90,0
5 3 10,0 10,0 100,0
Total 30 100,0 100,0
Budaya Organisasi (X3.5) Frequency Percent Valid
Percent
Cumulative Percent
Valid
3 7 23,3 23,3 23,3
4 17 56,7 56,7 80,0
5 6 20,0 20,0 100,0
Total 30 100,0 100,0
Budaya Organisasi (X3.2) Frequency Percent Valid
Percent
Cumulative Percent
Valid
3 12 40,0 40,0 40,0
4 15 50,0 50,0 90,0
5 3 10,0 10,0 100,0
Total 30 100,0 100,0
Budaya Organisasi (X3.4) Frequency Percent Valid
Percent
Cumulative Percent
Valid
3 9 30,0 30,0 30,0
4 16 53,3 53,3 83,3
5 5 16,7 16,7 100,0
Total 30 100,0 100,0
Budaya Organisasi (X3.6) Frequency Percent Valid
Percent
Cumulative Percent
Valid
3 12 40,0 40,0 40,0
4 10 33,3 33,3 73,3
5 8 26,7 26,7 100,0
Total 30 100,0 100,0
Budaya Organisasi (X3)
Frequency Percent Valid Percent Cumulative Percent
Valid
18 3 10,0 10,0 10,0
19 2 6,7 6,7 16,7
20 2 6,7 6,7 23,3
21 2 6,7 6,7 30,0
22 5 16,7 16,7 46,7
23 5 16,7 16,7 63,3
25 3 10,0 10,0 73,3
26 4 13,3 13,3 86,7
27 1 3,3 3,3 90,0
29 2 6,7 6,7 96,7
30 1 3,3 3,3 100,0
Total 30 100,0 100,0
Frekuensi Pernyataan Responden
GROUP COHESIVENESS (X4)
Statistics Group
Cohesiveness (X4.1)
Group Cohesiveness
(X4.2)
Group Cohesiveness
(X4.3)
Group Cohesiveness
(X4.4)
Group Cohesiveness
(X4)
N
Valid 30 30 30 30 30
Missing 0 0 0 0 0
Frequency Table
Group Cohesiveness (X4.1) Frequency Percent Valid
Percent
Cumulative Percent
Valid
3 12 40,0 40,0 40,0
4 13 43,3 43,3 83,3
5 5 16,7 16,7 100,0
Total 30 100,0 100,0
Group Cohesiveness (X4.3) Frequency Percent Valid
Percent
Cumulative Percent
Valid
2 1 3,3 3,3 3,3
3 10 33,3 33,3 36,7
4 14 46,7 46,7 83,3
5 5 16,7 16,7 100,0
Total 30 100,0 100,0
Group Cohesiveness (X4.2) Frequency Percent Valid
Percent
Cumulative Percent
Valid
3 10 33,3 33,3 33,3
4 14 46,7 46,7 80,0
5 6 20,0 20,0 100,0
Total 30 100,0 100,0
Group Cohesiveness (X4.4) Frequency Percent Valid
Percent
Cumulative Percent
Valid
3 12 40,0 40,0 40,0
4 13 43,3 43,3 83,3
5 5 16,7 16,7 100,0
Total 30 100,0 100,0
Group Cohesiveness (X4)
Frequency Percent Valid Percent Cumulative Percent
Valid
11 1 3,3 3,3 3,3
12 7 23,3 23,3 26,7
14 4 13,3 13,3 40,0
15 2 6,7 6,7 46,7
16 9 30,0 30,0 76,7
17 2 6,7 6,7 83,3
18 2 6,7 6,7 90,0
20 3 10,0 10,0 100,0
Total 30 100,0 100,0
Frekuensi Pernyataan Responden
BUDGETARY SLACK (Y)
Statistics Budgetary Slack
(Y1)
Budgetary Slack (Y2)
Budgetary Slack (Y3)
Budgetary Slack (Y4)
Budgetary Slack (Y5)
Budgetary Slack (Y6)
Budgetary Slack (Y)
N
Valid 30 30 30 30 30 30 30
Missing 0 0 0 0 0 0 0
Budgetary Slack (Y1) Frequency Percent Valid
Percent
Cumulative Percent
Valid
3 10 33,3 33,3 33,3
4 14 46,7 46,7 80,0
5 6 20,0 20,0 100,0
Total 30 100,0 100,0
Budgetary Slack (Y3) Frequency Percent Valid
Percent
Cumulative Percent
Valid
3 8 26,7 26,7 26,7
4 14 46,7 46,7 73,3
5 8 26,7 26,7 100,0
Total 30 100,0 100,0
Budgetary Slack (Y5) Frequency Percent Valid
Percent
Cumulative Percent
Valid
3 8 26,7 26,7 26,7
4 15 50,0 50,0 76,7
5 7 23,3 23,3 100,0
Total 30 100,0 100,0
Budgetary Slack (Y2) Frequency Percent Valid
Percent
Cumulative Percent
Valid
3 8 26,7 26,7 26,7
4 17 56,7 56,7 83,3
5 5 16,7 16,7 100,0
Total 30 100,0 100,0
Budgetary Slack (Y4) Frequency Percent Valid
Percent
Cumulative Percent
Valid
3 8 26,7 26,7 26,7
4 16 53,3 53,3 80,0
5 6 20,0 20,0 100,0
Total 30 100,0 100,0
Budgetary Slack (Y)
Frequency Percent Valid Percent Cumulative Percent
Valid
18 7 23,3 23,3 23,3
20 1 3,3 3,3 26,7
23 2 6,7 6,7 33,3
24 10 33,3 33,3 66,7
26 5 16,7 16,7 83,3
28 1 3,3 3,3 86,7
30 4 13,3 13,3 100,0
Total 30 100,0 100,0
Budgetary Slack (Y6) Frequency Percent Valid
Percent
Cumulative Percent
Valid
3 7 23,3 23,3 23,3
4 16 53,3 53,3 76,7
5 7 23,3 23,3 100,0
Total 30 100,0 100,0
LAMPIRAN 4
Hasil Uji Validitas
HASIL UJI VALIDITAS
Correlations
Correlations Partisipasi
Anggaran (X1.1)
Partisipasi Anggaran (X1.2)
Partisipasi Anggaran (X1.3)
Partisipasi Anggaran (X1.4)
Partisipasi Anggaran (X1.5)
Partisipasi Anggaran (X1.6)
Partisipasi Anggaran (X1)
Partisipasi Anggaran (X1.1)
Pearson Correlation 1 ,602** ,760** ,701** ,720** ,686** ,868**
Sig. (2-tailed) ,000 ,000 ,000 ,000 ,000 ,000
N 30 30 30 30 30 30 30
Partisipasi Anggaran (X1.2)
Pearson Correlation ,602** 1 ,599** ,684** ,731** ,688** ,842**
Sig. (2-tailed) ,000 ,000 ,000 ,000 ,000 ,000
N 30 30 30 30 30 30 30
Partisipasi Anggaran (X1.3)
Pearson Correlation ,760** ,599** 1 ,658** ,683** ,693** ,850**
Sig. (2-tailed) ,000 ,000 ,000 ,000 ,000 ,000
N 30 30 30 30 30 30 30
Partisipasi Anggaran (X1.4)
Pearson Correlation ,701** ,684** ,658** 1 ,595** ,823** ,865**
Sig. (2-tailed) ,000 ,000 ,000 ,001 ,000 ,000
N 30 30 30 30 30 30 30
Partisipasi Anggaran (X1.5)
Pearson Correlation ,720** ,731** ,683** ,595** 1 ,590** ,849**
Sig. (2-tailed) ,000 ,000 ,000 ,001 ,001 ,000
N 30 30 30 30 30 30 30
Partisipasi Anggaran (X1.6)
Pearson Correlation ,686** ,688** ,693** ,823** ,590** 1 ,865**
Sig. (2-tailed) ,000 ,000 ,000 ,000 ,001 ,000
N 30 30 30 30 30 30 30
Partisipasi Anggaran (X1)
Pearson Correlation ,868** ,842** ,850** ,865** ,849** ,865** 1
Sig. (2-tailed) ,000 ,000 ,000 ,000 ,000 ,000
N 30 30 30 30 30 30 30
**. Correlation is significant at the 0.01 level (2-tailed).
CORRELATIONS
/VARIABLES=X2.1 X2.2 X2.3 X2.4 X2.5 X2.6 X2 /PRINT=TWOTAIL NOSIG
/MISSING=PAIRWISE.
Correlations
Correlations Informasi Asimetri
(X2.1)
Informasi Asimetri (X2.2)
Informasi Asimetri (X2.3)
Informasi Asimetri (X2.4)
Informasi Asimetri (X2.5)
Informasi Asimetri (X2.6)
Informasi Asimetri (X2)
Informasi Asimetri (X2.1)
Pearson Correlation 1 ,506** ,607** ,323 -,085 ,075 ,598**
Sig. (2-tailed) ,004 ,000 ,081 ,657 ,693 ,000
N 30 30 30 30 30 30 30
Informasi Asimetri (X2.2)
Pearson Correlation ,506** 1 ,715** ,717** -,034 -,064 ,715**
Sig. (2-tailed) ,004 ,000 ,000 ,857 ,738 ,000
N 30 30 30 30 30 30 30
Informasi Asimetri (X2.3)
Pearson Correlation ,607** ,715** 1 ,693** ,126 -,015 ,794**
Sig. (2-tailed) ,000 ,000 ,000 ,507 ,936 ,000
N 30 30 30 30 30 30 30
Informasi Asimetri (X2.4)
Pearson Correlation ,323 ,717** ,693** 1 ,147 ,025 ,752**
Sig. (2-tailed) ,081 ,000 ,000 ,438 ,896 ,000
N 30 30 30 30 30 30 30
Informasi Asimetri (X2.5)
Pearson Correlation -,085 -,034 ,126 ,147 1 ,705** ,509**
Sig. (2-tailed) ,657 ,857 ,507 ,438 ,000 ,004
N 30 30 30 30 30 30 30
Informasi Asimetri (X2.6)
Pearson Correlation ,075 -,064 -,015 ,025 ,705** 1 ,485**
Sig. (2-tailed) ,693 ,738 ,936 ,896 ,000 ,007
N 30 30 30 30 30 30 30
Informasi Asimetri (X2)
Pearson Correlation ,598** ,715** ,794** ,752** ,509** ,485** 1
Sig. (2-tailed) ,000 ,000 ,000 ,000 ,004 ,007
N 30 30 30 30 30 30 30
**. Correlation is significant at the 0.01 level (2-tailed).
CORRELATIONS
/VARIABLES=X3.1 X3.2 X3.3 X3.4 X3.5 X3.6 X3 /PRINT=TWOTAIL NOSIG
/MISSING=PAIRWISE.
Correlations
Correlations Budaya
Organisasi (X3.1)
Budaya Organisasi (X3.2)
Budaya Organisasi (X3.3)
Budaya Organisasi (X3.4)
Budaya Organisasi (X3.5)
Budaya Organisasi (X3.6)
Budaya Organisasi (X3)
Budaya Organisasi (X3.1)
Pearson Correlation 1 ,387* ,710** ,734** ,623** ,554** ,841**
Sig. (2-tailed) ,035 ,000 ,000 ,000 ,001 ,000
N 30 30 30 30 30 30 30
Budaya Organisasi (X3.2)
Pearson Correlation ,387* 1 ,330 ,451* ,372* ,633** ,665**
Sig. (2-tailed) ,035 ,075 ,012 ,043 ,000 ,000
N 30 30 30 30 30 30 30
Budaya Organisasi (X3.3)
Pearson Correlation ,710** ,330 1 ,733** ,640** ,610** ,837**
Sig. (2-tailed) ,000 ,075 ,000 ,000 ,000 ,000
N 30 30 30 30 30 30 30
Budaya Organisasi (X3.4)
Pearson Correlation ,734** ,451* ,733** 1 ,520** ,523** ,825**
Sig. (2-tailed) ,000 ,012 ,000 ,003 ,003 ,000
N 30 30 30 30 30 30 30
Budaya Organisasi (X3.5)
Pearson Correlation ,623** ,372* ,640** ,520** 1 ,558** ,775**
Sig. (2-tailed) ,000 ,043 ,000 ,003 ,001 ,000
N 30 30 30 30 30 30 30
Budaya Organisasi (X3.6)
Pearson Correlation ,554** ,633** ,610** ,523** ,558** 1 ,825**
Sig. (2-tailed) ,001 ,000 ,000 ,003 ,001 ,000
N 30 30 30 30 30 30 30
Budaya Organisasi (X3)
Pearson Correlation ,841** ,665** ,837** ,825** ,775** ,825** 1
Sig. (2-tailed) ,000 ,000 ,000 ,000 ,000 ,000
N 30 30 30 30 30 30 30
*. Correlation is significant at the 0.05 level (2-tailed).
**. Correlation is significant at the 0.01 level (2-tailed).
CORRELATIONS
/VARIABLES=X4.1 X4.2 X4.3 X4.4 X4 /PRINT=TWOTAIL NOSIG
/MISSING=PAIRWISE.
Correlations
Correlations Group
Cohesiveness (X4.1)
Group Cohesiveness
(X4.2)
Group Cohesiveness
(X4.3)
Group Cohesiveness
(X4.4)
Group Cohesiveness
(X4)
Group Cohesiveness (X4.1)
Pearson Correlation 1 ,588** ,573** ,610** ,794**
Sig. (2-tailed) ,001 ,001 ,000 ,000
N 30 30 30 30 30
Group Cohesiveness (X4.2)
Pearson Correlation ,588** 1 ,736** ,848** ,911**
Sig. (2-tailed) ,001 ,000 ,000 ,000
N 30 30 30 30 30
Group Cohesiveness (X4.3)
Pearson Correlation ,573** ,736** 1 ,696** ,868**
Sig. (2-tailed) ,001 ,000 ,000 ,000
N 30 30 30 30 30
Group Cohesiveness (X4.4)
Pearson Correlation ,610** ,848** ,696** 1 ,905**
Sig. (2-tailed) ,000 ,000 ,000 ,000
N 30 30 30 30 30
Group Cohesiveness (X4)
Pearson Correlation ,794** ,911** ,868** ,905** 1
Sig. (2-tailed) ,000 ,000 ,000 ,000
N 30 30 30 30 30
**. Correlation is significant at the 0.01 level (2-tailed).
CORRELATIONS
/VARIABLES=Y1 Y2 Y3 Y4 Y5 Y6 Y /PRINT=TWOTAIL NOSIG
/MISSING=PAIRWISE.
Correlations
Correlations Budgetary Slack
(Y1)
Budgetary Slack (Y2)
Budgetary Slack (Y3)
Budgetary Slack (Y4)
Budgetary Slack (Y5)
Budgetary Slack (Y6)
Budgetary Slack (Y)
Budgetary Slack (Y1)
Pearson Correlation 1 ,756** ,826** ,801** ,780** ,748** ,886**
Sig. (2-tailed) ,000 ,000 ,000 ,000 ,000 ,000
N 30 30 30 30 30 30 30
Budgetary Slack (Y2)
Pearson Correlation ,756** 1 ,842** ,814** ,936** ,900** ,943**
Sig. (2-tailed) ,000 ,000 ,000 ,000 ,000 ,000
N 30 30 30 30 30 30 30
Budgetary Slack (Y3)
Pearson Correlation ,826** ,842** 1 ,806** ,840** ,802** ,923**
Sig. (2-tailed) ,000 ,000 ,000 ,000 ,000 ,000
N 30 30 30 30 30 30 30
Budgetary Slack (Y4)
Pearson Correlation ,801** ,814** ,806** 1 ,828** ,861** ,919**
Sig. (2-tailed) ,000 ,000 ,000 ,000 ,000 ,000
N 30 30 30 30 30 30 30
Budgetary Slack (Y5)
Pearson Correlation ,780** ,936** ,840** ,828** 1 ,898** ,950**
Sig. (2-tailed) ,000 ,000 ,000 ,000 ,000 ,000
N 30 30 30 30 30 30 30
Budgetary Slack (Y6)
Pearson Correlation ,748** ,900** ,802** ,861** ,898** 1 ,936**
Sig. (2-tailed) ,000 ,000 ,000 ,000 ,000 ,000
N 30 30 30 30 30 30 30
Budgetary Slack (Y)
Pearson Correlation ,886** ,943** ,923** ,919** ,950** ,936** 1
Sig. (2-tailed) ,000 ,000 ,000 ,000 ,000 ,000
N 30 30 30 30 30 30 30
**. Correlation is significant at the 0.01 level (2-tailed).
LAMPIRAN 5
Hasil Uji Reliabilitas
Hasil Uji Reliabilitas
Reliability
Scale: ALL VARIABLES
Case Processing Summary
N %
Cases
Valid 30 100,0
Excludeda 0 ,0
Total 30 100,0
a. Listwise deletion based on all variables in the procedure.
Reliability Statistics Cronbach's Alpha N of Items
,808 7
Item-Total Statistics Scale Mean if
Item Deleted
Scale Variance if Item Deleted
Corrected Item- Total Correlation
Cronbach's Alpha if Item
Deleted
Partisipasi Anggaran (X1.1) 39,77 62,323 ,841 ,776
Partisipasi Anggaran (X1.2) 40,07 62,133 ,809 ,776
Partisipasi Anggaran (X1.3) 39,80 62,993 ,821 ,780
Partisipasi Anggaran (X1.4) 39,93 61,857 ,837 ,774
Partisipasi Anggaran (X1.5) 39,97 61,068 ,814 ,772
Partisipasi Anggaran (X1.6) 39,90 63,059 ,840 ,780
Partisipasi Anggaran (X1) 21,77 18,461 1,000 ,926
RELIABILITY
/VARIABLES=X2.1 X2.2 X2.3 X2.4 X2.5 X2.6 X2 /SCALE('ALL VARIABLES') ALL
/MODEL=ALPHA /SUMMARY=TOTAL.
Reliability
Scale: ALL VARIABLES
Case Processing Summary
N %
Cases
Valid 30 100,0
Excludeda 0 ,0
Total 30 100,0
a. Listwise deletion based on all variables in the procedure.
Reliability Statistics Cronbach's Alpha N of Items
,755 7
Item-Total Statistics Scale Mean if
Item Deleted
Scale Variance if Item Deleted
Corrected Item- Total Correlation
Cronbach's Alpha if Item
Deleted
Informasi Asimetri (X2.1) 42,53 28,395 ,520 ,736
Informasi Asimetri (X2.2) 42,23 27,220 ,649 ,718
Informasi Asimetri (X2.3) 42,03 25,964 ,735 ,701
Informasi Asimetri (X2.4) 41,83 26,144 ,680 ,706
Informasi Asimetri (X2.5) 42,07 28,754 ,410 ,745
Informasi Asimetri (X2.6) 42,30 28,217 ,353 ,749
Informasi Asimetri (X2) 23,00 8,069 1,000 ,707
RELIABILITY
/VARIABLES=X3.1 X3.2 X3.3 X3.4 X3.5 X3.6 X3 /SCALE('ALL VARIABLES') ALL
/MODEL=ALPHA /SUMMARY=TOTAL.
Reliability
Scale: ALL VARIABLES
Case Processing Summary
N %
Cases
Valid 30 100,0
Excludeda 0 ,0
Total 30 100,0
a. Listwise deletion based on all variables in the procedure.
Reliability Statistics Cronbach's Alpha N of Items
,798 7
Item-Total Statistics Scale Mean if
Item Deleted
Scale Variance if Item Deleted
Corrected Item- Total Correlation
Cronbach's Alpha if Item
Deleted
Budaya Organisasi (X3.1) 42,27 36,754 ,804 ,758
Budaya Organisasi (X3.2) 42,50 39,155 ,605 ,782
Budaya Organisasi (X3.3) 42,43 37,909 ,805 ,767
Budaya Organisasi (X3.4) 42,33 37,471 ,788 ,764
Budaya Organisasi (X3.5) 42,23 38,047 ,729 ,770
Budaya Organisasi (X3.6) 42,33 36,161 ,779 ,755
Budaya Organisasi (X3) 23,10 11,128 1,000 ,882
RELIABILITY
/VARIABLES=X4.1 X4.2 X4.3 X4.4 X4 /SCALE('ALL VARIABLES') ALL
/MODEL=ALPHA /SUMMARY=TOTAL.
Reliability
Scale: ALL VARIABLES
Case Processing Summary
N %
Cases
Valid 30 100,0
Excludeda 0 ,0
Total 30 100,0
a. Listwise deletion based on all variables in the procedure.
Reliability Statistics Cronbach's Alpha N of Items
,834 5
Item-Total Statistics Scale Mean if
Item Deleted
Scale Variance if Item Deleted
Corrected Item- Total Correlation
Cronbach's Alpha if Item
Deleted
Group Cohesiveness (X4.1) 26,57 21,082 ,732 ,809
Group Cohesiveness (X4.2) 26,47 20,189 ,881 ,786
Group Cohesiveness (X4.3) 26,57 20,185 ,823 ,790
Group Cohesiveness (X4.4) 26,57 20,254 ,873 ,788
Group Cohesiveness (X4) 15,17 6,626 1,000 ,892
RELIABILITY
/VARIABLES=Y1 Y2 Y3 Y4 Y5 Y6 Y /SCALE('ALL VARIABLES') ALL /MODEL=ALPHA
/SUMMARY=TOTAL.
Reliability
Scale: ALL VARIABLES
Case Processing Summary
N %
Cases
Valid 30 100,0
Excludeda 0 ,0
Total 30 100,0
a. Listwise deletion based on all variables in the procedure.
Reliability Statistics Cronbach's Alpha N of Items
,818 7
Item-Total Statistics Scale Mean if
Item Deleted
Scale Variance if Item Deleted
Corrected Item- Total Correlation
Cronbach's Alpha if Item
Deleted
Budgetary Slack (Y1) 43,47 51,982 ,864 ,787
Budgetary Slack (Y2) 43,43 52,254 ,932 ,787
Budgetary Slack (Y3) 43,33 51,402 ,907 ,783
Budgetary Slack (Y4) 43,40 52,110 ,904 ,787
Budgetary Slack (Y5) 43,37 51,413 ,940 ,783
Budgetary Slack (Y6) 43,33 51,885 ,923 ,786
Budgetary Slack (Y) 23,67 15,402 1,000 ,966
LAMPIRAN 6
Hasil Uji Regresi
HASIL UJI REGRESI
Warning # 849 in column 23. Text: in_ID
The LOCALE subcommand of the SET command has an invalid parameter. It could not be mapped to a valid backend locale.
FREQUENCIES VARIABLES=X3.3
/STATISTICS=RANGE MINIMUM MAXIMUM MODE /FORMAT=LIMIT(50)
/ORDER=ANALYSIS.
Frequencies
Notes
Output Created 23-JAN-2019 21:36:45
Comments
Input
Active Dataset DataSet0
Filter <none>
Weight <none>
Split File <none>
N of Rows in Working Data File
30
Missing Value Handling
Definition of Missing User-defined missing values are treated as missing.
Cases Used Statistics are based on all cases with valid data.
Syntax
FREQUENCIES VARIABLES=X3.3 /STATISTICS=RANGE MINIMUM MAXIMUM MODE
/FORMAT=LIMIT(50) /ORDER=ANALYSIS.
Resources
Processor Time 00:00:00,02
Elapsed Time 00:00:00,01
[DataSet0]
Statistics
Budaya Organisasi
N
Valid 0
Missing 30
Budaya Organisasi
Frequency Percent
Missing System 30 100,0
REGRESSION
/MISSING LISTWISE
/STATISTICS COEFF OUTS R ANOVA COLLIN TOL /CRITERIA=PIN(.05) POUT(.10)
/NOORIGIN /DEPENDENT Y1
/METHOD=ENTER X1 X2 X3 X4.1 /RESIDUALS DURBIN.
Regression
Notes
Output Created 23-JAN-2019 21:48:38
Comments
Input
Active Dataset DataSet0
Filter <none>
Weight <none>
Split File <none>
N of Rows in Working Data File
30
Missing Value Handling
Definition of Missing User-defined missing values are treated as missing.
Cases Used Statistics are based on cases with no missing values for any variable used.
Syntax
REGRESSION /MISSING LISTWISE
/STATISTICS COEFF OUTS R ANOVA COLLIN TOL
/CRITERIA=PIN(.05) POUT(.10) /NOORIGIN
/DEPENDENT Y1
/METHOD=ENTER X1 X2 X3 X4.1 /RESIDUALS DURBIN.
Resources
Processor Time 00:00:00,05
Elapsed Time 00:00:00,13
Memory Required 2868 bytes Additional Memory Required
for Residual Plots
0 bytes
[DataSet0]
Variables Entered/Removeda Model Variables
Entered
Variables Removed
Method
1
Group
Cohesiveness, Total Informasi Asimetri, Total Partisipasi Angaran, Total Budaya Organisasib
. Enter
a. Dependent Variable: Budgetary Slack b. All requested variables entered.
Model Summaryb
Model R R Square Adjusted R
Square
Std. Error of the Estimate
Durbin-Watson
1 ,932a ,869 ,848 ,285 2,022
a. Predictors: (Constant), Group Cohesiveness, Total Informasi Asimetri, Total Partisipasi Angaran, Total Budaya Organisasi
b. Dependent Variable: Budgetary Slack
ANOVAa
Model Sum of Squares df Mean Square F Sig.
1
Regression 13,435 4 3,359 41,331 ,000b
Residual 2,032 25 ,081
Total 15,467 29
a. Dependent Variable: Budgetary Slack
b. Predictors: (Constant), Group Cohesiveness, Total Informasi Asimetri, Total Partisipasi Angaran, Total Budaya Organisasi
Coefficientsa
Model Unstandardized Coefficients Standardized
Coefficients
t Sig. Collinearity Statistics
B Std. Error Beta Tolerance VIF
1
(Constant) -,017 ,572 -,030 ,976
Total Partisipasi Angaran ,032 ,028 ,186 1,115 0,02 ,188 5,317
Total Informasi Asimetri -,004 ,025 -,017 -,172 0,865 ,545 1,836
Total Budaya Organisasi ,050 ,036 ,236 1,398 0,174 ,184 5,441
Group Cohesiveness ,566 ,155 ,564 3,645 0,001 ,219 4,558
a. Dependent Variable: Budgetary Slack
Collinearity Diagnosticsa
Model Dimension Eigenvalue Condition Index Variance Proportions
(Constant) Total Partisipasi Angaran
Total Informasi Asimetri
Total Budaya Organisasi
Group Cohesiveness
1
1 4,958 1,000 ,00 ,00 ,00 ,00 ,00
2 ,025 13,984 ,14 ,05 ,05 ,01 ,06
3 ,010 22,707 ,14 ,15 ,32 ,07 ,06
4 ,005 30,712 ,05 ,36 ,19 ,08 ,67
5 ,002 47,296 ,67 ,45 ,44 ,85 ,21
a. Dependent Variable: Budgetary Slack
Residuals Statisticsa
Minimum Maximum Mean Std. Deviation N
Predicted Value 2,99 5,11 3,87 ,681 30
Residual -,397 ,844 ,000 ,265 30
Std. Predicted Value -1,285 1,832 ,000 1,000 30
Std. Residual -1,392 2,961 ,000 ,928 30
a. Dependent Variable: Budgetary Slack
LAMPIRAN 7
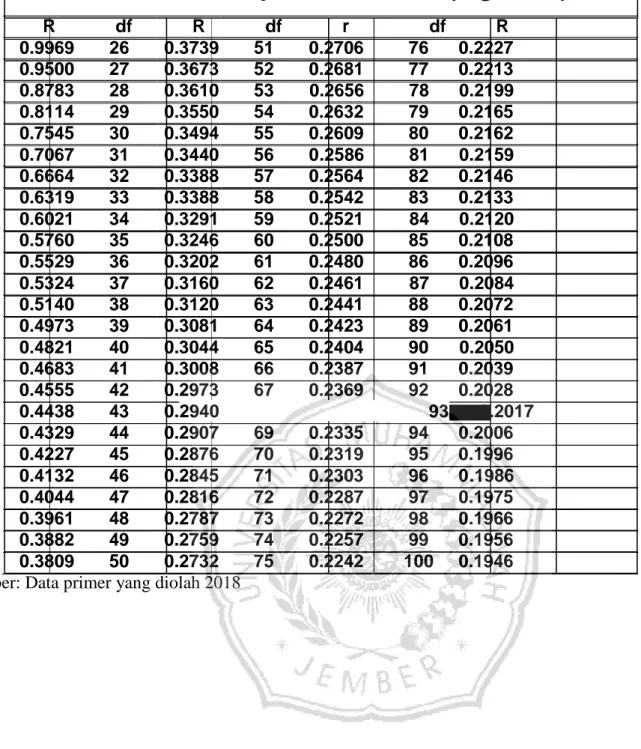
TABEL R PRODUCT MOMENT,
DAN TABEL DISTRIBUSI t
Tabel r productMoment (Sig =0,05)
df R df R df r df R
1 0.9969 26 0.3739 51 0.2706 76 0.2227
2 0.9500 27 0.3673 52 0.2681 77 0.2213
3 0.8783 28 0.3610 53 0.2656 78 0.2199
4 0.8114 29 0.3550 54 0.2632 79 0.2165
5 0.7545 30 0.3494 55 0.2609 80 0.2162
6 0.7067 31 0.3440 56 0.2586 81 0.2159
7 0.6664 32 0.3388 57 0.2564 82 0.2146
8 0.6319 33 0.3388 58 0.2542 83 0.2133
9 0.6021 34 0.3291 59 0.2521 84 0.2120
10 0.5760 35 0.3246 60 0.2500 85 0.2108
11 0.5529 36 0.3202 61 0.2480 86 0.2096
12 0.5324 37 0.3160 62 0.2461 87 0.2084
13 0.5140 38 0.3120 63 0.2441 88 0.2072
14 0.4973 39 0.3081 64 0.2423 89 0.2061
15 0.4821 40 0.3044 65 0.2404 90 0.2050
16 0.4683 41 0.3008 66 0.2387 91 0.2039
17 0.4555 42 0.2973 67 0.2369 92 0.2028
18 0.4438 43 0.2940 93 0.2017
19 0.4329 44 0.2907 69 0.2335 94 0.2006
20 0.4227 45 0.2876 70 0.2319 95 0.1996
21 0.4132 46 0.2845 71 0.2303 96 0.1986
22 0.4044 47 0.2816 72 0.2287 97 0.1975
23 0.3961 48 0.2787 73 0.2272 98 0.1966
24 0.3882 49 0.2759 74 0.2257 99 0.1956
25 0.3809 50 0.2732 75 0.2242 100 0.1946
Sumber: Data primer yang diolah 2018
TabelDistribusi t
Df 0,1 0,05 0,025
1 3.0777 6.3138 12.7062
2 1.8856 2.9200 4.3027
3 1.6377 2.3534 3.1824
4 1.5332 2.1318 2.7764
5 1.4759 2.0150 2.5706
6 1.4398 1.9432 2.4469
7 1.4149 1.8946 2.3646
8 1.3968 1.8595 2.3060
9 1.3830 1.8331 2.2622
10 1.3722 1.8125 2.2281
11 1.3634 1.7959 2.2010
12 1.3562 1.7823 2.1788
13 1.3502 1.7709 2.1604
14 1.3450 1.7613 2.1448
15 1.3406 1.7531 2.1314
16 1.3368 1.7459 2.1199
17 1.3334 1.7396 2.1098
18 1.3304 1.7341 2.1009
19 1.3277 1.7291 2.0930
20 1.3253 1.7247 2.0860
21 1.3232 1.7207 2.0796
22 1.3212 1.7171 2.0739
23 1.3195 1.7139 2.0687
24 1.3178 1.7109 2.0639
25 1.3163 1.7081 2.0595
26 1.3150 1.7056 2.0555
27 1.3137 1.7033 2.0518
28 1.3125 1.7011 2.0484
29 1.3114 1.6991 2.0452
30 1.3104 1.6973 2.0423
31 1.3095 1.6955 2.0395
32 1.3086 1.6939 2.0369
33 1.3077 1.6924 2.0345
34 1.3070 1.6909 2.0322
35 1.3062 1.6896 2.0301
36 1.3055 1.6883 2.0281
37 1.3049 1.6871 2.0262
38 1.3042 1.6860 2.0244
39 1.3036 1.6849 2.0227
40 1.3031 1.6839 2.0211
41 1.3025 1.6829 2.0195
42 1.3020 1.6820 2.0181
43 1.3016 1.6811 2.0167
44 1.3011 1.6802 2.0154
45 1.3006 1.6794 2.0141
46 1.3002 1.6787 2.0129
47 1.2998 1.6779 2.0117
48 1.2994 1.6772 2.0106
49 1.2991 1.6766 2.0096
50 1.2987 1.6759 2.0086