Fossil fuel flexibility in west European
power generation and the impact of system
load factors
Patrik Soderholm
U¨
Di¨ision of Economics, Lulea Uni˚ ¨ersity of Technology, 971 87 Lulea, Sweden˚
Abstract
This paper analyzes short-run interfuel substitution in west European power generation, and the impact of system load factors on fossil fuel choice. The problems are studied within a restricted translog cost share model. The paper concludes that interfuel substitution in existing power plants is substantial, especially that between oil and gas. This is consistent with the notion that short-run fuel substitution takes place in dual- or multi-fired plants, by switching load between different single-fired plants, and by some conversions of power plants to be able to burn alternate fuels. The empirical investigation also indicates that the system load factor is a notable determinant of fossil fuel choices in west Europe, and the paper ends with an assessment of the fuel consequences of some load management schemes in the region.Q2001 Elsevier Science B.V. All rights reserved.
JEL classifications:D24; Q41
Keywords:Fossil fuels; Power generation; Interfuel substitution; Fuel choice; System load factor
1. Introduction
This paper has two purposes. The first is to estimate the degree of short-run interfuel substitution between fossil fuels in west European power generation, and the second is to analyze the impact of system load factors on fossil fuel choices.
Ž .
Since electric utilities are large consumers of fossil fuels coal in particular their
U
Corresponding author. Tel.:q46-920-72078; fax:q46-920-72035.
Ž .
E-mail address:[email protected] P. Soderholm .¨
0140-9883r01r$ - see front matterQ2001 Elsevier Science B.V. All rights reserved.
Ž .
responsiveness to changes in relative fuel prices as well as other non-price factors Ž
is important for the suppliers of fossil fuels e.g. for production and investment .
plans . For example, substantial short-term fuel switching enables power genera-tors to exploit price differentials in fuel prices, something that can give them increased negotiating power. Consequently, fuel suppliers then face a ceiling on their fuel prices charged, and the prospects for exploiting any market power
Ž
become limited. However, even if the capacity to switch between fuels e.g. dual- or .
multi-fuel capacity exists, the opportunities for fuel switching may be limited for
Ž .
various reasons see Section 2 ; the degree of actual short-run interfuel substitu-tion therefore remains an empirical quessubstitu-tion.
Moreover, an understanding of the determinants of the demand for fossil fuels by electric utilities is also important for proposed public policies towards the energy sector to be effective. For example, fuel price increases are often presented as one measure to promote energy conservation and fuel substitution. In this respect the present paper can indicate what is the response in power generation fossil fuel use to any new European Union CO tax or tradable permit system. In2 addition, many west European countries have shown an increased interest in ambitious load management policies that aim at decreasing peak load. An analysis of the impact of system load factors is thus vital as it allows one to assess the fuel consequences of different load management schemes.
The choice of focus in this paper can also be motivated by reviewing earlier academic studies. The standard approach in previous research on interfuel substi-tution has been to study the problem within a flexible cost function, in most cases the translog, and this is also the approach employed in this paper. However, our investigation differs from many of the earlier studies on fuel choice in power generation in three important respects.1
Ž . Ž .
First, the distinction between short-run ex post and long-run ex ante substitu-tion is often neglected in previous research, and many of the alleged long-run cost studies rely heavily on ad hoc interpretations rather than on explicit long-run
Ž .2
formulations e.g. Griffin, 1977; Uri, 1977; Ball and Loncar, 1991 . The degree of
Ž .
short-run interfuel substitution is often implicitly or explicitly assumed to be zero.
Ž . Ž . Ž .
Atkinson and Halvorsen 1976 , Uri 1978 , Mountain 1982 , Bopp and Costello Ž1990 , Dahl and Ko 1998 are exceptions to this latter rule. Still, they either focus. Ž . their attention on the substitution that occurs in dual- and multi-fired fired power plants, or they tend to rely solely on the argument that time-series data alone will reflect short-run behavior.3 In this paper we argue that there are at least two
Ž .
additional ways in which short-run fuel switching can occur see Section 2 , and we go on to specify a restricted translog cost share model, which is estimated using pooled time series and country data for six west European countries over the
1
For a review and a critical evaluation of previous econometric studies on interfuel substitution in
Ž .
fossil-fueled power generation, see Soderholm 1998b .¨
2
Some studies do not even consider whether their results should be interpreted as short- or long-run
Ž . Ž .
period 1984]1994. In contrast to previous research efforts we confront our empiri-cal results with these identified potentials for short-term fuel switching.
Second, some of the specific characteristics of the electricity industry, and their impacts on fuel choice, have not been implemented in the above fuel demand studies. Still, since some fuels provide cheap peak power and others cheap base load power, the ultimate fuel mix will depend on the level of utilization of the electric power system, i.e. on the system load factor. Thus, we incorporate a measure of the system load factor as an independent variable in the cost share model, something which allows us to assess what are the fuel consequences of changes in the system load factor and thus in peak load. Normally planning decisions on production and fuel mix in the power sector tend to be undertaken with detailed, bottom-up, large-scale production optimization models, which allow load factors to be analyzed closely. However, these models tend not to analyze actual behavior, but rather optimal behavior, which may be more or less closely related to observed responses. In addition, they seldom take into account the choice of fuel in multi-fired power plants or the possibility of converting existing plants to alternate fuels. Energy demand models, although aggregate and less detailed, attempt to measure observed responses to changes in the market. Previ-ous fuel demand studies have, however, neglected the impacts of load factors on fuel choice, although these can be fairly easily implemented in the demand models. In other words, a load factor analysis as that proposed in this paper can comple-ment the results of more detailed bottom-up models.
Finally, most previous studies analyze fuel choice in the US power sector, while we in this paper focus entirely on the west European electricity industry.4
Some important limitations of the paper need to be indicated before proceeding. Since the prospects for short-run fuel switching form an essential part of this paper, we only analyze the degree of interfuel substitution among fossil fuels; coal, oil and gas. There are very few substitution possibilities in the case of existing plants designed to utilize either uranium or hydropower. It is therefore implicitly assumed that a country’s choice between hydropower and nuclear energy is independent of the choice made between different fossil fuels to be burnt in electric plants. Furthermore, in the early 1990s we have witnessed a surge in gas use for power generation, primarily in newly built combined cycle gas turbines
3
It is worth noting that it is probably more appropriate to analyze short-run fuel choice behavior within a cost function approach compared to long-run behavior. For example, neoclassical cost function approaches are based on the assumption that firms minimize costs in their choice of factor inputs. However, long-run fuel choices have been heavily influenced by government policies and strong political overtones whose aims have not always been cost minimization. However, decisions to switch fuels in existing multi- or single-fired capacity or to convert existing plants to other fuels are in general much less affected by government regulations andror public opinion. In addition, a short-run model will not
Ž .
suffer from the so-called Averch]Johnson effect Halvorsen, 1978 .
4 Ž . Ž .
Griffin 1977 and Ball and Loncar 1991 also look at the west European market. However, the
Ž .
ŽCCGT . This paper does not deal explicitly with this development, primarily since. Ž
an analysis of CCGT growth implies a long-run focus i.e. a capacity choice
. 5
analysis , and this paper concentrates on short-run fuel behavior only.
The paper proceeds as follows. In the next section we discuss the possibilities for Ž .
and the limits to short-run ex post interfuel substitution in west European electricity generation. The impacts of system load factor changes on fuel choice, and how these effects can be estimated, are also considered. Section 3 presents the theoretical structure of the restricted translog model employed in this paper, and in Section 4 we review model estimation and data issues. The empirical results are reported and discussed in Section 5, while Section 6 provides some concluding remarks.
2. Short-run interfuel substitution and system load factors
In at least one respect, the power generation sector offers more or less perfect conditions for econometric analyses of its production technology, given its homo-geneous output measures. However, two issues relating to the nature of electric power generation have to be addressed if an aggregate fuel demand approach is to be applied. First, given the high capital intensity of the generation sector, the distinction between long- and short-run fuel substitution possibilities is important. Second, the difference between peak load and base-load power will also have important implications for production costs and thus for fuel choices. This section deals with these two issues in turn.
Electricity production is often assumed to be a so-called putty]clay technology. In principle, this means that ex ante, i.e. prior to the construction of the plant, there is clearly the possibility for substitution between all factors of production Žincluding all fuel inputs . However, once the plant’s design is fixed in terms of a. specific capital equipment, the scope for substitution is substantially reduced. In
Ž .
other words, ex post the elasticity of substitution might be very low or even zero . Since it is common to assume that no interfuel substitution can occur in existing power plants we must consider under which circumstances such substitution actually can take place.6
First, some electric utilities are able to use a variety of fuels and switch between them, which gives some short-run flexibility. In dual- or multi-fuel fired plants switching can occur within a day if the alternative fuel is available and no major
5
A CCGT-related short-run issue is, however, that most planned CCGTs tend to be single-fired
ŽUNIPEDE, 1997 , and this has raised some concerns about security of gas supply in west Europe IEA,. Ž .
1995 .
6 Ž .
Fuss 1978 concludes that the hypothesis of the existence of a putty-clay technology cannot be rejected for the electric power industry in the USA. However, he only employs input demand functions
Ž .
modifications of the unit are needed; otherwise it may take weeks or months.7The amount of multi-fuel capacity differs considerably between west European coun-tries but has remained very high in some, and increased in others. Out of a 52 GW net increase in west Europe’s thermal capacity between 1974 and 1990, 43 GW Ž83% was dual- or multi-fuel fired IEA, annual . Second, there is also the. Ž . flexibility permitted by variations in the use of single-fired capacity. A firm generally owns several generating plants and units, which may burn different fuels. Since different units are brought on-line according to their short-run variable costs of production, changes in fossil fuel prices can change the merit order of plants using different fuels, thereby affecting the fuel mix in the short run. Similarly, integrated power pools make possible further interfuel substitution through reallo-cations of generation requirements between firms using different fuels. Third, some conversions of electric plants are relatively straightforward and inexpensive. An oil-fired plant that is converted to burn gas, or a coal to oilrgas conversion are examples of this. Accordingly, in response to the oil crises in the 1970s, many west European utilities converted their oil-fired plants to be able to burn gas or oilrgas ŽSoderholm, 1998a .
¨
.8 The reversal, conversion from oil or gas to coal-firing, however, requires expensive investments and is therefore to be regarded as anŽ .
intermediate-term response IEA, 1987 . For example, the conversion of an oil-fired plant to coal normally removes the plant from service for 1.5]2 years and costs
Ž .
approximately US$200 million for a 500 MW plant Daniel, 1991; IEA, 1992 . The installation of coal handling facilities and new pollution control equipment explain these high costs. Similarly, because of the need for a larger boiler box and the necessity to provide storage and fuel handling system, gas to oil retrofits are also
Ž .
relatively costly and time-consuming IEA, 1997 . The above thus suggests that particularly the potential for short-run oilrgas and coalrgas substitution can be significant due to conversions of existing capacity.
Hence, even if the ex ante fuel substitution possibilities are greater, there are still reasons why ex post interfuel substitution might be important in the electricity industry. However, the opportunities to switch fuels in the three ways just de-scribed can be limited. The physical availability of fuels might be restricted for various reasons or switching fuels might lead to a violation of the legal emission limits. Moreover, fuel switching can also be constrained when long-term contracts are in force. However, the existence of long-term contracts is not a necessary condition for short-term fuel switching not to occur. For example, in the mid-1980s Austria invested in two coalrgas-fired units with a combined capacity of 725 MW. These units operate with a long-term contract for Polish hard coal, and the strategy
7
In some coal-fired plants, it is also possible to add oil to the pulverised coal input. This was the
Ž .
method used during the British coal strike in 1984r1985 when coal supply was limited IEA, 1992 .
8
has been to burn gas when found cheaper and therefore occasionally stock coal ŽBaum, 1988 . In addition, utilities with dual-fired plants and long-term contracts. for one fuel, can switch fuels and take advantage of the difference between the contract price and the spot price. For example, if the spot price for gas increases relative to the contract price, a dual-fired oilrgas plant that burns gas under a long-term contract can switch to oil and instead sell gas on the spot market for gas.9
In sum the above fuel switching options reflect merely the technical capability for fuel switching rather than the likelihood that the industry will actually switch to an alternate fuel for economic reasons. The degree of price-induced ex post interfuel substitution therefore remains an empirical question.
We now turn to the important distinction between peak load and base load
Ž .
power, and its impacts on fuel choice. Since electricity cannot be economically stored, grid operators must match supply and demand at any given moment. As a
Ž .
result, any electricity system must provide both power GW , an instantaneous rate Ž .
of output, as well as energy GWh , which can be thought of as the cumulative output over time. This means that the distinction between peak load and base load becomes of substantial interest for fuel choice analyses. Since some types of plants provide cheap peak load power and others cheap base load power, the cost of generation and in turn the fuel mix will depend on the level of utilization of the electric power system.
Traditionally empirical studies have concentrated on the energy dimension, i.e. Ž .
they solely rely on GWh as the measure of output. Stewart 1979 is one of a few exceptions. He examines the effects of plant size and plant utilization factor on the average cost of electric power generation. For the reason mentioned he finds it appropriate to abstain from the neoclassical framework and instead employ an engineering production function approach which allows for the two dimensions of output.10 However, in this study we instead simply include a measure of the system load factor as an independent variable in the cost function. This approach permits us to cling to the neoclassical approach with all its advantages and still be able to capture the effect of multidimensional output on fossil fuel choice. A similar line is
Ž . Ž . Ž .
taken in Lomax 1952 , Huettner and Landon 1978 , Rushdi 1991 , Filippini Ž1997 . It should, however, be noted that these studies solely investigate the impact. of load factor improvements on generation costs; none of them focuses on the effects on the fuel mix.
Ž .
The annual system load factor LF is the ratio of the total generation during a year to the energy, which would have been produced, had the power remained constant at its peak value for the entire period, i.e. the average power divided by
9
Since the contract price is often indexed to spot market prices with some time lag, these kinds of price differences do not normally last long. Hence, the ability to switch quickly becomes important.
10 Ž .
the peak power.11 It can thus be expressed as:
Q
Ž .
LFs 1
8760PL
Ž . where LF is the annual system load factor, Qis the total generation in GWh of
Ž . electric power during the year, and PL denotes annual peak load in GW . We would expect that an increase in the system load factor from one year to another
Ž .
should have a positive effect on the cost share for primarily base loaded fossil fuels, i.e. preferably coal. That is, when the load factor increases it means there is less need for peaking power and consequently base loaded power would be more fully utilized. Gas, on the other hand, and oil in particular are both heavily used for peak load and their cost shares ought to be negatively affected by an increase in
12 Ž .
the system load factor. Alternatively, an increase in peak load PL , i.e. a fall in LF, causes cost share increases for primarily peak-loaded fuels. The empirical assessment of these hypotheses follows in Section 5, but first Sections 3 and 4 outline the methodological approach of the paper.
3. The restricted translog model
In this paper we basically follow the Marshallian tradition and assume the
Ž .
existence of a short-run restricted cost function, in which the capital input is fixed at a level other than its full-equilibrium value. In other words, we presume that fossil fueled power production technology can be represented by the following general variable cost function;
Ž Ž . . Ž .
VCsVC PE PC,PO,PG ,K,PL,PM,Q,LF,t 2
whereVC is the variable cost of producing fossil fueled electricity. PC, PO, PG, PL and PM are the input prices of the respective factor inputs; coal, oil, gas, labor and material inputs. PE is thus a function that aggregates the different fossil fuel prices, that is an aggregate price index of energy inputs. The input prices are assumed to be exogenously determined, i.e. we assume competitive factor markets. The effects of technical changes are denoted by a time trend,t, and LF represents the system load factor.Qand K denote fossil-fueled electricity output and power generating capacities, respectively. Thus, in this short-run formulation the capital stock, K, is accounted for but changes in it are not explained.
11
The load factor should not be confused with the capacity factor, which relates the energy generated by a system over a period of time to the energy generated had the system operated continually at its maximum capacity during the same period.
12
The recent increase in gas-fired CCGT has partly changed this picture, as these tend to be used for
Ž .
Due to lack of reliable labor and material price data it is assumed that energy and capital inputs are as a group weakly separable from labor and material inputs. Essentially this means that, given fixed capital, the mix of fossil fuel inputs is
Ž .
assumed to be independent of the non-energy inputs labor and material . The weak separability assumption allows us to analyze a separate cost function for the energy and capital inputs alone. We assume that the conditions hold for the
Ž .
existence of an optimum cost function VCE for fossil-fueled electricity production of the following general form;
Ž . Ž .
VCEsVCE PC,PO,PG,K,Q,LF,t 3
For estimation purposes we are also interested in the cost-minimizing factor cost
Ž . Ž .
shares Si . These can be derived by differentiating Eq. 3 logarithmically with respect to the fossil fuel prices, and by applying Shephard’s lemma. This yields the following general cost share equations;
lnVCE VCE Pi P Ei i
Ž . Sis s s for isC,O,G 4
lnPi Pi VCE VCE
where Ei, represents power generation use of the ith fuel. Before these cost share equations can be estimated we have to specify the cost function. The translog cost
Ž .
function was proposed by Christensen et al. 1971, 1973 and differs from earlier representations of producer behavior in that it allows substitution between input factors to be unrestricted. It is obtained by a second-order Taylor expansion of the logarithm of an arbitrary twice-differentiable cost function and can for our pur-poses be written as;
three fuel cost share equations as linear functions of the logarithms of the fuel prices and the other independent variables so that;
3
SisaiqbQ ilnQqbK ilnKq
Ý
ai jlnPjqdL F ilnLFqdt it js1Ž .
fori,jsC,O,G 6
Ž .
The cost share equations in Eq. 6 form the basis of the empirical investigation, and they allow us not only to estimate the degree of price-induced fuel substitu-tion, but also to test two interesting hypotheses with regard to the electricity production technology. First, we can test whether changes in the system load factor ŽLF. tend to have fuel using or fuel saving effects. Following the discussion in Section 2, a priori we would expect that;
Ž .
dL F C)0 dL F O-0 dL F G-0 7
We also estimate a constrained version of the translog fuel demand system, i.e. a model in which dL F is0. This permits us to perform a likelihood ratio test of the null hypothesis that the system load factor has no significant effect on overall fossil fuel demand. Second, since the parameters. dt i, also appear in the cost share equations we are able to analyze in what way technical change affects fossil fuel
Ž . Ž
choice. A positive negative value of dt i, indicates that technical changes over Ž .
time have been ith fuel using saving . Traditionally economists have employed a simple time trend to represent technical developments over the sample period. Although it is difficult to determine what it actually represents, the time trend tends to play an important role in ‘determining’ factor demand patterns in the
Ž . Ž .
power sector e.g. Nelson, 1986 . This study follows Matsukawa et al. 1993 who assume that ‘the effects of technical changes on interfuel substitution may be interpreted as the cumulative effect of fuel-switching promotional policies on fossil
Ž .
fuels,’ p. 44 . These policies include, for example, tax deductions and favorable loans for utilities converting old oil-fired plants to coal burning. Of course, other impacts are also caught by the time trend and ultimately it is difficult to resolve exactly what the coefficients show. Still, it is reasonable to expect that the time trend in our case has been oil saving and coal using in response to the oil crises in the 1970s. The time trend effect on gas use, however, is harder to project. In the mid-1980s gas was still seen as very scarce resource that should not be ‘wasted’ for power generation purposes. However, in the late 1980s technical changes in the design and performance of the CCGT, and a more relaxed attitude towards
Ž
depletion issues led to a substantial increase in gas use. This trend was at least in .
the UK reinforced by the decision to deregulate electricity markets. Thus, the average effect of the time trend on gas use in power generation remains an empirical question, which is pursued in Section 5.
since the fuel cost shares must add to one and the cost function must be homogenous of degree one13 in prices;
3
In addition, partial differentiation of Eq. 5 with respect to prices reveals the symmetry condition ai jsaji. Finally, when using aggregate data it is common to
Ž .
assume constant returns to scale CRS since it reduces the problem of multi-Ž .
collinearity. Brown and Christensen 1981 show that CRS requires that the following restrictions on the share equations be imposed;14
Ž .
bQ iqbK is0 9
To obtain a measure of the degree of interfuel substitution we calculate the Ž .
cross-price elasticities of fuel demand. Following Uzawa 1962 , Berndt and Wood Ž1975 show that, for the translog model, the cross- and own-price elasticities. Žhi j
. Ž .
andhi i are relatively simple to compute once the parameters in Eq. 6 have been estimated. We have;
ai jqS Si j ai iqS2i ySi
Ž .
hi js ,i/j andhi i for i,jsC,O,G 10
Si Si
These own- and cross-price elasticities will differ at every data point, and Ž
normally they are computed at the means of the data sample assuming that this .
value is on the regression line . It is important to note that these elasticities are only partial price elasticities, i.e. they account for the substitution between the fossil fuels under the constraint that the aggregate quantity of fossil fuels con-sumed remains constant. Also, the short-run elasticities are valid only for the levels of capital at which they are evaluated, and they do not provide any information about the substitution between capital equipment and the different fossil fuels. Still, they allow us to estimate the degree of short-run interfuel substitution in fossil-fueled power plants in west Europe, and as was discussed above, within the proposed cost share model we can also analyze the impact of system load factors on fossil fuel choice.
13
That is, variable cost must increase proportionally when all fuel prices increase proportionally, output held fixed. The concavity and monotonicity conditions of the cost model are not imposed, but are instead checked by examining the estimated parameters of the model.
14
The additional conditions for CRS that have to be imposed on the translog cost function are
Ž .
reviewed in Brown and Christensen 1981 . In contrast to nuclear power, a number of empirical studies have confirmed that constant returns to scale is a reasonable assumption in the case of fossil-fueled
Ž .
4. Model estimation and data issues
In this paper the translog cost share model is estimated by pooling time-series data across six west European countries, Belgium, Ireland, Italy, Netherlands, Spain and the United Kingdom. For these countries annual time-series data between 1984 and 1994 have been collected. This gives us a total sample of 66 observations.
The data needed to estimate the model include fossil fueled electricity produc-tion, installed thermal power capacity, fossil fuel use for electricity producproduc-tion, estimates of the system load factors and the relevant prices for the three fossil fuels. How these variables have been calculated, where they have been collected and other related data issues are reviewed in Appendix A. Apart from the variables
Ž .
mentioned above, a dummy variable Di ST and the corresponding coefficients Žgi ST.have been included in the share equations to capture the effects of the UK coal strike in 1984r1985, during which the British electricity sector had to substi-tute oil for coal.
In order to implement the translog fuel demand system empirically we need to specify the stochastic framework. We desire a specification, which recognizes that variables not observed by the econometrician still enter the different countries’
Ž . cost minimizing behavior. Specifically, here an additive disturbance term «i t n is
Ž
appended to each of the three cost share equations where t and n represent an .
index over the country-time observations . Furthermore, we assume that each error term can be decomposed into three elements so that;
Ž .
«i t nsai nqmi tqwi t n 11
where ai n is a country-specific error, mi t, represents intra-equation inter-temporal Ž
effects by following a first-order autoregressive process but it exhibits no error .
autocorrelation across equations , and finally wi t n, which is a term that may be contemporaneously correlated across equations. The country-specific errors may be interpreted as unobserved fundamental differences among the electricity systems in
Ž .
the six countries that still influence the countries’ fuel choices . We assume that these differences are fixed over time for a given country, and consequently we are able to eliminate the country-specific disturbance component by introducing dummy variables for each country. Thus, the following terms are appended to each cost share equation;
This approach is normally referred to as the fixed-effects model, and it over-comes the bias of the estimation results that can occur in the presence of
Ž
unobserved country’s effects that are correlated with the regressors e.g. Friedlan-.
der et al., 1993 . In addition, since cross-country data tend to reflect long-run Ž
within-.
country variance fits well with our purpose of only estimating short-run responses. Since cross-equation contemporaneous correlation of thewi t nterms is expected we assume that the resulting disturbance vector is multivariate normally distributed
Ž .
with mean vector zero and constant non-singular covariance matrix Vt n. Ž .
The system of share equations in Eq. 6 provide two seemingly unrelated regression models that can be used to estimate the parameters of the model. The restrictions suggested by economic theory must also be imposed to obtain efficient estimates of parameters and elasticities. Furthermore, the estimation of a full model, all three fuel share equations, would result in the disturbance covariance matrix to be singular, thereby violating a necessary condition in the theory of econometrics. To avoid this problem one of the fuel share equations can be dropped without loss of generality. Since the system of equations was estimated by
Ž Ž .
the method of maximum likelihood using the Time Series Processor TSP .
computer program the results are invariant to the choice of equation to be
Ž .
dropped Berndt, 1991 .
5. Empirical results and discussion
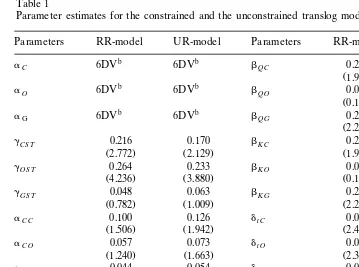
Ž . Parameter estimates and the corresponding t-statistics for the constrained RR,
Ž .
i.e. where dL F is0, and the unconstrained UR model are provided in Table 1. Conventional R2 measures for all the cost share equations in both models are slightly above 0.90. The oil and coal share coefficients representing the UK coal
Ž
strike and the time trend have the expected signs and are also statistically .
significant at the 5% level in both models. In other words, public policies directed towards the power sector appear to have been oil saving and coal using,15 while the UK coal strike in 1984r1985 favored oil instead of coal burning. These results are in line with our expectations. The time trend effect on gas demand is, however, low and insignificant. The size of the capital stock is also a notable determinant of fuel cost shares, a result that should be expected given the high capital intensity of the electric power sector.
Before proceeding with the analysis it is necessary to establish whether the estimated short-run translog system is well behaved or not. Monotonicity was checked by determining if the fitted values of the fuel cost shares were positive.
Ž .
The check of these showed that, except for one case of a possible 198 , the translog form generated positive cost shares. Furthermore, concavity in input prices requires that the Hessian is negative semi-definite, and this was checked by examining the signs of the principal minors at each observation. It turned out that
Ž .
only one-third 22 out of 66 of the observations were well behaved. Thus, with regard to concavity the translog fuel demand system was not particularly consistent with its theoretical restrictions.
15
It should be noted that even after the oil price collapse in 1986, the suspicion towards oil, and in
Ž .
Table 1
a
Parameter estimates for the constrained and the unconstrained translog model
Parameters RR-model UR-model Parameters RR-model UR-model
b b
Absolute values of t-statistics in parentheses.
b
6DV indicates the use of separate dummy intercept variables for each country. Specifically, there is a valueai for a base country and thengi n, for the otherNy1 countries.
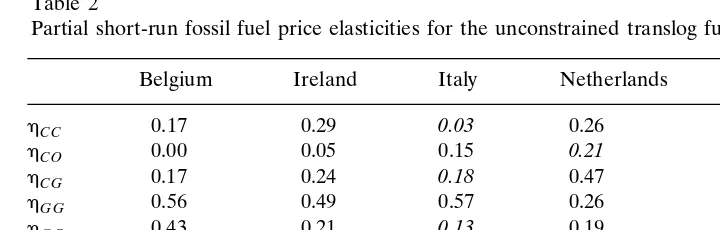
In Table 2 the partial fossil fuel price elasticities for the unrestricted model are presented.16All elasticity estimates have been calculated at the mean value of the fitted cost shares over the period 1984]1994.17 Some observations relating to the economics of fuel choice are worth commenting on.
First, in general we would expect the own-price elasticities of fuel demand to be Ž
non-positive, and the cross-price elasticities to be non-negative the latter since the
. Ž
three fuels ought to be substitutes . This is true for a majority of the estimates 43 .
out of a total of 54 . The most severe deficiency of the model is that three of the
16
The own- and cross-price elasticities differed marginally in the unconstrained model compared to the constrained. The only apparent exception from this was that oil demand tended to be even more sensitive to gas price changes in the constrained model.
17
Elasticity estimates in translog models are non-linear functions of the estimated parameters and cost shares, and this makes it difficult to obtain reliable estimates of the standard errors. Furthermore,
Ž .
Table 2
a
Partial short-run fossil fuel price elasticities for the unconstrained translog fuel demand system
Belgium Ireland Italy Netherlands Spain UK
hC C y0.17 y0.29 0.03 y0.26 y0.09 y0.05
The estimates that are in italics are those which have unexpected signs.
Ž
own-price elasticities are positive reflecting the failure of the cost function to be .
concave in prices .
Ž .
Second, in the short-run it is likely that the base-loaded large cost share fuel will exhibit a relatively low own-price elasticity of demand, while the peaking fuels
Ž .
will be more price sensitive Bopp and Costello, 1990 . This is a pattern that is found in Table 2. Coal is generally the large cost share fuel in most countries
wexcept in Italy oil and the Netherlands gas , and the own-price elasticities forŽ . Ž .x
coal are also comparably low.18
Third, Table 2 also reveals some evidence of price-induced interfuel substitution between fossil fuels used for power generation, especially between the peaking fuels; oil and gas. For example, a 1% rise in the price of gas increases oil demand by 0.8% in the Netherlands, and by more than 0.4% in Ireland. Indeed, overall the substitution between oil and gas tends to be highest relative to the other fuel combinations. The fairly high cross-price effects between coal and gas are also worth noting.19
A high share of capacity capable of switching between oil and gas partly explains this latter result. In 1990, for example, the average share of total thermal capacity
Ž .
that was capable of switching between oil and gas was 22% IEA, annual . The corresponding shares for coalroil- and coalrgas-firing were 15 and 9%,
respec-18 Ž .
Soderholm 1999 shows that, in a translog model, this result is not predetermined by the way the¨
elasticities are calculated. However, the fact that for a specific country, it is a change in the price of the
Ž
base-loaded fuel that causes the largest substitution with one of that country’s peaking fuels e.g.
.
hC O-hO C , is a pure outcome of the theoretical structure, and can easily be seen by examining the
Ž .
cross-price elasticities in Eq. 10 .
19
tively.20 There are, though, two other, equally important, rationalizations for the high oilrgas responses. First, in contrast to coal, both oil and gas are heavily used for peak power production, thus increasing the possibility that changing fuel prices induces substitution between single-fueled oil- and gas-fired power plants. In addition, the relatively high oilrgas elasticities are also explained by the fact that conversions of oil-fired plants to be able to burn gas or oilrgas, often are inexpensive and can be done within a relatively short time period. Following the oil crises in the 1970s, rather than building new coal-fired plants many west European
Ž .
electric utilities took advantage of this opportunity Soderholm, 1998a . Similarly,
¨
some of the observed substitution between coal and gas is probably due to some utilities converting their coal-fired plants to burn gas as well. This, however, has mainly occurred in the latter parts of the period in response to lower gas prices, and also for environmental reasons. Austria provides one example. In sum, the restricted translog model tends to generate both reasonable and notable short-run responses in fossil fuel demand to changes in relative fuel prices. We now proceed to analyze the impact of system load factors on fossil fuel choices.The coefficients in Table 1 representing the effects of changes in the system load Ž .
factor dL F i support our presumption that increases in the system load factor have coal using and oil saving effects. The high t-ratios indicate that these two coeffi-cients are also statistically significantly different from zero. The effect on gas demand is negative but, however, not significant. This latter result might reflect the
Ž .
fact that gas to some extent at least in the 1990s is used both for peak power and base load power, something that is not the case for coal and oil. Furthermore, the result of the likelihood ratio test, reported in Table 3, indicates a rejection of the null hypothesis that the system load factor has had no effect on overall fossil fuel choice.
The conformity between our initial hypotheses and the empirical results is worth emphasizing and even appears somewhat surprising, especially since our use of dummy variables in the share equations eliminates all between-country variance Žand the estimates are based solely on within-country variances . Furthermore,. variations in fuel choice that can be attributed to changes in the load are probably
Table 3
Likelihood ratio test for the system load factor hypothesis
a a
Null Test statistic for Critical value Critical value
2Ž . 2Ž .
hypothesis likelihood ratio test x 0.05 x 0.025
dL F is0 8.5 6.0 7.4
a
The likelihood ratio test statistic is distributed asymptotically as ax2 random variable with degrees
of freedom equal to the number of restrictions being tested. Since the three LF-parameters sum to zero, only two of them are independent. Thus, effectively we test for two restrictions and the degrees of freedom have been computed accordingly.
20
Table 4
System load factor elasticity of fuel cost shares
Belgium Ireland Italy Netherlands Spain UK
«C L F 1.02 1.90 4.54 2.38 0.88 0.83
«O L F y5.72 y2.26 y0.89 y9.66 y2.75 y3.61
«G L F y0.23 y0.15 y0.31 y0.09 y1.33 y1.25
more clearly revealed in monthly time-series analysis. Nevertheless, our reliance on ‘crude’ annual data also appears to be sufficient to capture these load effects.
In summing up, increases in the system load factor tend to have statistically significant coal using and oil saving effects in the west European power sector, while the corresponding effect on gas use is somewhat indeterminate. However, the fact that the former effects are significant from a statistical point of view does not necessarily mean that they are economically important, i.e. that they are large
Ž .
enough to matter for policy purposes McCloskey and Ziliak, 1996 . To investigate whether this is the case, we can simulate the effect of load factor changes on fuel
Ž .
cost shares by differentiating Eq. 6 with respect to LF, and then construct the following elasticity formulas;
S LFi dL F i
Ž .
«i L Fs s fori,jsC,O,G 13
LF Si Si
«i L F is the ‘system load factor elasticity of fuel cost share’, and shows the percentage change in the cost share of the i-th fuel as the system load factor increases by 1%. Table 4 presents these elasticities for our six countries. The average of the fitted cost shares for each country has been used to calculate the elasticity estimates in the table.
The estimated elasticities allow us to assess what are the fuel consequences of
Ž .
reducing peak load and thus increasing the load factor by, for example, imple-menting time of day or time of season pricing policies. For instance, a load management policy in Belgium that increases the system load factor from 0.71 Žactual figure in 1995 to 0.75 an increase by 6% would increase coal’s cost share. Ž .
Ž
from 0.64 to approximately 0.68 which, ceteris paribus, corresponds to approxi-.
mately 0.27 Mtoe in increased coal use . Many west European countries have implemented plans or are considering policies to induce the shifting of loads from peak hours to less critical periods for the power system. Let us now consider the fossil fuel consequences of two ‘real world’ examples. First an evaluation of one part of the Irish load management policy. In Ireland peak demand occurs in December or January each year, and for industrial consumers so-called ‘maximum demand’ tariffs provide incentives to reduce demand during the winter. This policy
Ž . is estimated to having reduced peak load by 0.15 GW, which in 1995
corre-Ž
sponded to an increase in the system load factor of approximately 5% UNIPEDE, .
that had the policy not been implemented, coal’s cost share would have been
Ž .
almost 10% lower 0.2 Mtoe , ceteris paribus. The corresponding effect on oil
Ž .
demand would have been an increase of approximately 11% 0.1 Mtoe . Our second example concerns Italy, where so-called ‘multi-hour tariffs’ were introduced in 1980 in order to shift loads away from peak hours. The results of this policy have
Ž .
according to UNIPEDE 1997, 67 been ‘remarkable’, and indicate an increase in
Ž .
the load factor from 0.65 to 0.68 a near 5% increase . According to our estimates this policy has, ceteris paribus, increased the coal share in the country by over 20% Ž0.8 Mtoe , and lowered the share of oil by approximately 4% 0.9 Mtoe . This. Ž . exercise however, assumes, that the observed increase in the load factor in Italy can be entirely attributed to the above policy.
Another, more general, caveat is also in its place here. An increase in the load factor will indeed raise the utilization of base-loaded power but this increase may very well benefit nuclear andror hydropower instead. Thus, since our model essentially includes only one base-loaded power source, namely coal-fired electric-ity, our load factor elasticity probably overestimates the effect on coal demand. In sum then, the effects on fossil fuel choice from changes in the system load factors appear to be non-negligible but probably not very large. Still, this does not mean that future research efforts in the field of power generation economics should ignore the impacts from system load factors. We identify two facts that support this conclusion. First, in many west European countries planned load management policies tend to be very ambitious compared to earlier efforts, something that in some countries can result in significant increases in the system load factor. Second,
Ž
failing to incorporate estimates of the load factor in the cost function and in the .
fuel demand equations as a testable hypothesis is not a neutral position, but rather represents a specific assumption, which, if incorrect, may bias the estimates.21
6. Concluding remarks
This paper has presented a framework within which interfuel substitution in existing fossil fueled power plants can be estimated, and that allows the impact of system load factors on fuel choices to be analyzed. The following general conclu-sions can be drawn.
Our short-run translog model reveals some sensible results about the economics of ex post fossil fuel choice. The results are, for example, consistent with the notion
Ž . Ž .
that short-run fuel substitution primarily occurs 1 in multi-fuel fired plants; 2 by Ž .
switching load between different single-fuel fired plants and; 3 by the conversion of electric plants to be able to bum alternate fuels as well. Notable evidence of
21
interfuel substitution is found, especially between oil and gas but also between the other fuel combinations. This high flexibility in the west European power sector has most likely emanated during the last 20 years. Over this period the prospects for reactivating large-scale projects have become limited, and as a result refurbish-ing as well as conversions of plants to new fuels, soared in the 1980s. Uncertainty about future fuel prices, few technical improvements in new plants, siting problems and stringent environmental regulations for new plants explain this development. Short-term fuel switching enables power generators to exploit price differentials in fuel prices. As a consequence, fuel suppliers face a ceiling on their fuel prices charged, and the prospects for exploiting any market power become limited. Since the existence of dual- and multi-fired plants limits price increases for everyone in the electric power system, this also benefits generators who have no short-run flexibility whatsoever. In addition, it is likely that the trend away from long-term
Ž
contracts between fuel suppliers and utilities towards annual negotiations and spot .
purchases is partly a result of the increased flexibility in the power sector. Consequently, the production and investment decisions of many fuel suppliers will have to be based more and more on current and future market conditions rather than on ‘fixed’ negotiated prices. For this reason one can hypothesize that many fuel producers try to diversify their ‘consumer portfolio’. Since electric utilities far away from the well head or the mine site usually are marginal users that in turn are the most active fuel switchers, such diversifications will be particularly important for fuel suppliers that are located far away from the power generators. The economic incentives for fuel switching are likely to remain strong in the future as well. The trend towards increased deregulation and privatization will probably increase the value of fuel substitution. As competition between different electricity suppliers becomes fiercer, generators who can minimize costs and take advantage of short-term movements in fuel prices will gain.
Finally, the empirical investigation in this paper also indicates that the system load factor is a notable determinant of short-run fossil fuel choice in the west European power sector. Nevertheless, some simple simulations indicate that these effects, although statistically significant and noteworthy, are probably not very large overall. Still, the analysis in this paper suggests that load factor effects need not only be analyzed in bottom-up models, but can also easily be implemented in aggregate cost function approaches, and yield reasonable results as well. In other words, given the increased interest in load management policies during the last decade, future fuel demand models and forecasts ought to take load factor effects into account.
Ž
Our inability to capture country-specific effects in more detail primarily due to .
data limitations , should also open the field for additional research.
Acknowledgements
Massachusetts, Cambridge, USA. Financial supports from Vattenfall, the Kempe Foundations, and SNS Energy are gratefully acknowledged, as are helpful com-ments from Ernst Berndt, Marian Radetzki and one anonymous referee on earlier versions of this paper. Responsibility for any remaining errors, however, resides solely with the author.
Appendix A
Ž .
Fossil fuel prices PC, PO, PG used in the study represent prices charged to electric utilities in the respective countries. The prices are in US$ per toe and include any taxes or subsidies charged. They have been collected from various
Ž .
issues of Energy Prices and Taxes IEA, quarterly . For some years these data were not reported, and in those cases fuel prices were assumed to follow the same trend
Ž . as the prices charged to the industrial sector as a whole. In those rare cases where these industry-wide data were lacking as well, prices were assumed to follow the average CIF import price to the country.
In Spain, however, for which data on coal prices from 1986 and onwards lack, the latter approximation would probably be inappropriate. Most of the coal burnt in Spanish electricity generation comes from domestic mines. Its price is determined by contractual negotiations between UNESA, the association of electric utilities,
Ž .
and Carbunion, the organization of the coal producing companies IEA, 1996 .
´
Ž .
However, the current contract signed in 1986 applies a reference price for underground coal based on the average price of coal sold to utilities in the four most important member countries of the European Community. Opencast coal, on the other hand, is not subject to long-term contracts but its price is calculated as a
Ž .
percentage of the price of underground coal production Couse, 1989 . Accord-ingly, for our purposes coal prices for electricity generation in Spain between 1986 and 1994 have been assumed to follow the same trend as the average price charged to utilities in Belgium, France, Germany and the UK.
For the capital stock, the net maximum thermal electricity generating capacity ŽK. in gigawatt GW has been used. Data on this variable can be found in theŽ .
Ž
United Nations publications Yearbook of World Energy Statistics United Nations, .
annual a and Annual Bulletin of Energy Statistics for Europe and North America ŽUnited Nations, annual b . For the early 1990s IEA’s. Electricity Information has
Ž . Ž .
been used IEA, annual . Fuel input quantities EC, EO, EG have been measured in Mtoe and can be obtained from IEA’s Energy Balances of OECD Countries for
Ž .
the years 1978]1989 IEA, 1991, 1993 . For the remaining years the data for this
Ž .
variable were collected from Electricity Information IEA, annual . Total
fossil-Ž . Ž .
fueled electricity generated Q, measured in terrawatt hours TWh , was used as the output variable. These data were collected from Energy Balances of OECD
Ž .
Ž . Ž .
Electricity Sector UNIPEDE, annual . Together with total net electricity produc-Ž .
tion data these were used to calculate the system load factor LF .
References
Atkinson, A., Halvorsen, R., 1976. Interfuel substitution in conventional steam-electric power genera-tion. J. Political Econ. 84, 959]978.
Ball K., Loncar T., 1991. Factors influencing the demand for coal. Australian Bureau of Agricultural
Ž .
and Resource Economics ABARE . Technical paper 91.4, Canberra.
Baum, V., 1988. Energy consumption outpasses growth. Pet. Econ. September, pp. 306]308.
Berndt, E., 1991. The Practice of Econometrics. Classic and Contemporary. Addison Wesley, Reading. Berndt, E., Wood, D., 1975. Technology, prices and the derived demand for energy. Rev. Econ. Stat. 57,
376]384.
Bopp, A., Costello D., 1990. The economics of fuel choice at US electric utilities. Energy Econ. April, pp. 82]88.
Brown, R., Christensen, L., 1981. Estimating elasticities of substitution in a model of partial static
Ž .
equilibrium: an application to US agriculture, 1947 to 1974. In: Berndt, E., Field, F. Eds. , Modeling and Measuring Natural Resource Substitution. MIT Press, Cambridge.
Christensen, L., Jorgensen D., Lau L., 1971. Conjugate duality and the transcendental logarithmic production function. Econometrica July, pp. 255]256.
Christensen, L., Jorgensen, D., Lau, L., 1973. Transcendental logarithmic production frontiers. Rev. Econ. Stat. 55, 28]45.
Couse, J., 1989. Issues in the Spanish Energy Sector. Pet. Rev., pp. 279]282.
Dahl, C., Ko, J., 1998. The effect of deregulation on US fossil fuel substitution in the generation of electricity. Energy Policy 26, 981]988.
Daniel, M., 1991. Power station coal use: prospects to 2000. IEACRr41, IEA Coal Research. London. Filippini, M., 1997. Elements of the Swiss market for electricity. Physica-Verlag, Heidelberg.
Friedlander, A., Berndt E., Chiang J., Showalter M., Vellturo C., 1993. Rail costs and capital adjustments in a quasi-regulated environment. J. Transp. Econ. Policy, May, pp. 131]152.
Fuss, M., 1978. Factor substitution in electricity generation: a test of the putty-clay hypothesis. In: Fuss
Ž .
M., McFadden D., Eds. , Production economics: a dual approach to theory and applications. North Holland, Amsterdam.
Griffin, J., 1977. Inter-fuel substitution possibilities: a translog application to inter-country data. Int. Econ. Rev. 18, 755]770.
Halvorsen, R., 1978. Econometric Models of US Energy Demand Lexington Books, Toronto.
Huettner, D., Landon, J., 1978. Electric utilities: scale economies and diseconomies. South. Econ. J. 44, 883]912.
IEA, 1987. Coal prospects and policies in IEA countries. Review. OECD, Paris. IEA, 1991. Energy balances of OECD countries 1960]1979. OECD, Paris. IEA, 1992. Electricity supply in the OECD. OECD, Paris.
IEA, 1993. Energy balances of OECD countries 1980]1989. OECD, Paris. IEA, 1994. Energy balances of OECD Countries 1991]1992. OECD, Paris. IEA, 1995. IEA Natural Gas Security Study. OECD, Paris.
IEA, 1996. Energy policies of Spain. OECD, Paris. IEA, 1997. Oil in power generation. OECD, Paris. IEA quarterly. Energy prices and taxes. OECD, Paris. IEA, annual. Electricity information. OECD, Paris.
Kamerschen, D.R., Thompson, H.G., 1993. Nuclear and fossil fuel steam generation of electricity: differences and similarities. South. Econ. J. 60, 14]27.
Krinsky, I., Robb, L., 1986. On approximating the statistical properties of elasticities. Rev. Econ. Stat. 68, 715]719.
Lomax, K., 1952. Cost curves for electricity generation. Economica 19, 193]197.
Matsukawa, I., Fujii, Y., Madono, S., 1993. Price, environmental regulation, and fuel demand: econo-metric estimates for Japanese manufacturing industries. Energy J. 14, 37]56.
McCloskey, D.N., Ziliak, S., 1996. The standard error of regressions. J. Econ. Lit. 34, 97]114. McDonnell, J.T., 1991. Wholesale power substitution for fossil and nuclear fuels by electric utilities: a
cross-sectional analysis. Master thesis, Mineral Economics Department. Colorado School of Mines. Golden, USA.
Mountain, D., 1982. Imported electricity: a substitute for inputs used by the regional electricity industry. J. Reg. Sci. 22, 83]96.
Nelson, R.A., 1986. Capital vintage, time trend, and technical change in the electric power industry. South. Econ. J. 53, 315]332.
Rushdi, A., 1991. Economies of scale and factor substitution in electricity supply industry. A case study of Southern Australia. Energy Econ., pp. 219]229.
Soderholm, P., 1998a. Fuel choice in West European power generation since the 1960s. OPEC Rev. 22,¨
201]232.
Soderholm, P., 1998b. The modeling of fuel use in the power sector: a survey of econometric analyses. J.¨
Energy Lit. 4, 3]27.
Soderholm, P., 1999. Short-run interfuel substitution in West European power generation: a restricted¨
cost function approach. Working Paper 99-002. Center for Energy and Environmental Policy Research. Massachusetts Institute of Technology. Cambridge, MA.
Stewart, J.F., 1979. Plant size, plant factor, and the shape of the average cost function in electric power generation: a nonhomogeneous capital approach. Bell J. Econ. 10, 549]565.
UNIPEDE, 1997. Europrog. Programmes and prospects for the European electricity sector. UNIPEDE, Paris.
United Nations annual a. Annual bulletin of energy statistics for Europe and North America. UN, New York.
United Nations annual b. Yearbook of World energy statistics. UN, New York.
Uri, N., 1977. Regional interfuel substitution by electric utilities in the United States. J. Reg. Sci. 17, 217]226.
Uri, N., 1978. Interfuel substitution possibilities: short-term prospects. Appl. Energy 4, 251]260. Uzawa, H., 1962. Production functions with constant elasticities of substitution. Rev. Econ. Stat. 44,