www.elsevier.com / locate / econbase
A national accounting system for worker flows
a b c ,
*
Lourens Broersma , Frank A.G. den Butter , Udo Kock
a
University of Groningen, Department of Economics, P.O. Box 800, 9700 AV Groningen, The Netherlands
b
Scientific Council for Government Policy, Tinbergen Institute and Free University, De Boelelaan 1105, 1081 HV Amsterdam, The Netherlands
c
Tinbergen Institute and Free University, Department of Economics, Applied Labor Economics Research Team (ALERT): De Boelelaan1105, 1081 HV Amsterdam, The Netherlands
Received 11 August 1999; accepted 16 December 1999
Abstract
We present a national accounting system for the construction of a consistent macro data set for worker flows. It is an alternative to micro data sets on gross labour flows derived from panels. The method is applied to construct annual flow data for The Netherlands for 1997. 2000 Elsevier Science S.A. All rights reserved.
Keywords: Worker flows; Flow data
JEL classification: J63; H55
1. Introduction
Nowadays labour market dynamics and the consequent gross flows play a dominant role in labour market theories and empirical analyses of labour market developments. Up to now these empirical analyses of labour market dynamics have been conducted mainly on the basis of micro panel data sets (Blanchard and Diamond, 1990; Davis et al., 1996). However, empirical research on labour market flows based on panel data faces a number of problems, such as missing observations, misclassification and selection biases. For that reason, as an alternative and supplement to these micro data, this paper presents a construction method for worker flow data, which exploits the internal consistency of flows and stocks in the labour market at the macro level.
An important difference is that in our system flows of workers are measured in a continuous manner. Therefore our data include multiple transitions within the observation interval which would be disregarded in panel data. Flows of workers are calculated at the macro level instead of the sector
*Corresponding author. Tel.: 131-20-444-6156; fax:131-20-444-6005. E-mail address: [email protected] (U. Kock)
level, so that our approach covers the whole economy. Sector specific panel data studies might give an incomplete impression of labour market dynamics if there are differences in job and worker flows among industries. Additionally, some micro panel studies on labour market flows only take large firms into account, which might generate some biases. A further feature of our approach is that it includes job to job movements in a consistent way. As Davis et al. (1996: p. 149) indicate, omitting job movers is an important missing piece in their story. Furthermore we include the flow of workers who quit and leave the labour force and we include discouraged workers, i.e. unemployed who stop searching. Most panel data studies disregard these labour market flows.
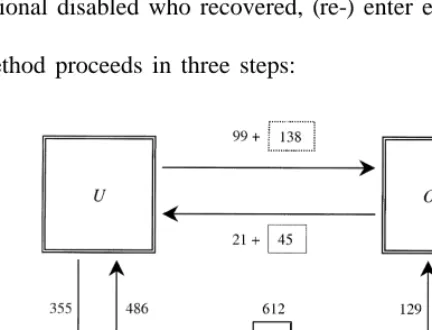
2. The accounting system
Our accounting system of worker flows (see Fig. 1), which we applied for The Netherlands for 1997, includes three stocks: Employed (E ), Unemployed (U ) and Out of the Labour Force (OLF ). The stock of persons out of the labour force includes such diverse groups as students, discouraged workers, occupational disabled workers, retired and early-retired workers and other non-participants. Our construction method implies that every citizen above age 14 is allocated to unemployment, employment or out of the labour force. Children under age 14 are left out. We disregard part time unemployment, as our accounting system requires that each person is allotted to one stock only. For reasons of simplicity we abstain from emigration, immigration and deaths.
Every period many workers change labour market status. We distinguish seven possible transitions. Employed are laid off (FE→U), leave the labour force due to retirement or occupational disability (FE→OLF) or move to a different job (FE→E). Unemployed job searchers find jobs (FU→E) or leave the labour force (FU→OLF), because they stopped searching (discouraged workers), became occupational disabled or reached retirement age. Finally, persons currently out of the labour force, such as students, housewives or occupational disabled who recovered, (re-) enter employment (FOLF→E) or register as unemployed (FOLF→U).
The construction method proceeds in three steps:
Step 1. (Primary sources) We identify and collect data on the stocks and flows that are available from primary sources. It appeared that data on all stocks and on four flows were available from primary sources, albeit that we had sometimes to combine different sources to come to the aggregate flow data of our system. The flow data that were available relate to employment outflow and unemployment outflow.
Step 2. (Assumptions) In case the data of Step 1 do not suffice to construct all series in the closed system, one or more additional assumptions are needed for filling the empty holes in the accounting system. We had to make an assumption regarding the number of persons out of the labour force that register as unemployed. We assume that 20% of the total number of school-leavers do not find a job right after they graduate and register as unemployed. This assumption is based on information from a panel survey (CBS (1998)). From primary sources we have data on the number of occupational disabled who recover and register as unemployed. Hence the total flow from out of the labour force to unemployment is assumed to equal
FOLF→U5FOcc.disabled→U10.20*SCHOOLOUT (1)
Step 3. (Equations) We use the stock and flow information gathered in the previous steps to derive the resulting flows by means of stock-flow equations, sometimes referred to as the equations of motion. These are very simple accounting rules, which say that the change in a stock equals inflow minus outflow, all measured over the unit period of observation. These definition equations can be used either for the calculation of the inflow or the outflow with respect to the relevant stock, depending on what data are available from primary sources.
The first stock-flow equation is used to derive the inflow into employment from out of the labour force. It reads
FOLF→E5 DE1FE→OLF1FE→U2FU→E. (2)
Note that assumption (1) is not yet needed to derive these flow data so that it is constructed using information from primary sources only. Finally we derive the flow from unemployment to out of the labour force,
FU→OLF5FE→U1FOLF→U2 DU2FU→E. (3)
The flow of unemployed to out of the labour force consists of four parts: inflow into occupational disability, inflow into retirement, other inflow (e.g. changed family circumstances) and discouraged workers. From primary sources we have information on the first three flows, so it is in fact only the flow of discouraged workers (see Fig. 1) which has been determined by this stock-flow equation.
We note that in order to come to a consistent set of data we need data for all variables in the system and cannot leave one variable out. That is because the data set uses a closed accounting framework like in the National Accounts. Of course, the fact that we may have to make additional assumptions for the construction of the data set can affect the accuracy of the data. Yet we note that even in the construction of National Accounts’ data sometimes assumptions have to be made in order to make the data set consistent. This is, for instance, the case for a number of production items. Moreover, in National Accounting corrections are made when there is a discrepancy between the aggregate income and the expenditure data.
Apart from using scattered information from a survey a major criterion for the empirical feasibility of our assumption is the restriction that the construction method does not yield negative values for one of the variables based on stock-flow equations.
3. Worker flows
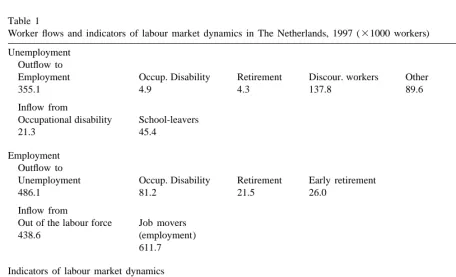
Table 1 summarises worker flows in The Netherlands in 1997 as constructed by our system. The flow from employment to unemployment and vice versa and the flow of job movers appear to be particularly large. However, it is interesting to note that employment inflow is driven more by
Table 1
Worker flows and indicators of labour market dynamics in The Netherlands, 1997 (31000 workers) Unemployment
Outflow to
Employment Occup. Disability Retirement Discour. workers Other
355.1 4.9 4.3 137.8 89.6
Out of the labour force Job movers
438.6 (employment)
611.7 Indicators of labour market dynamics
Hires Quits Lay offs Separations Labour turnover
1405.6 740.5 486.1 1226.6 2632.2
re-entrants, school-leavers and job movers than by unemployed who find a job. It turns out that a worker is more likely to leave the labour force through early retirement than through regular retirement. A striking labour market characteristic of The Netherlands is the large number of workers that becomes occupational disabled and leaves the labour force.
The last part of Table 1 shows some keynote indicators of labour market dynamics in The Netherlands, which can be composed using the stock and flow data of our system. Gross employment flows are substantial as compared to net employment growth. In 1997 the number of hires was almost eighth times higher than net employment growth. Yet, net employment growth, the difference between hires and separations, was also relatively large in this year, namely nearly 3%. About 60% of the separations take place because a worker quits his job, with job movers as a major component. The remainder of the separations is due to layoffs. Note that in The Netherlands temporary layoffs are rare, so almost all of the separations into unemployment are due to permanent layoffs. If we assume that the data represent a steady state, we can calculate average employment and unemployment duration. On average an unemployed worker finds a job after six months. However, in reality there is a lot of heterogeneity in unemployment duration.
4. Conclusions
It is possible to construct a consistent set of all relevant worker flows at the macro level for the Netherlands. Gross employment flows are substantial; in 1997 net employment growth was only a fraction of the total number of hires. Re-entrants, school-leavers and job movers primarily drive employment inflow.
Provided that sufficient data are available form primary sources, the construction method can be applied to any other country or region for any time period and interval. The worker flows could also be disaggregated with respect to the various characteristics of workers and job flows can be included (see Kock (1998) for a first attempt).
Data appendix
Unemployed: Landelijk Instituut Sociale Verzekeringen, LISV. Employed Centraal Planbureau, CPB.
Labour force U1E.
Quits FE→OLF1FE→E.
Separations FE→U1FE→OLF1FE→E. Average employment duration E /(0.5*LT ).
Average unemployment duration U / 0.5*(FE→U1FOLF→U1FU→E1FU→OLF).
See Kock (1998) for a comprehensive discussion of the data.
References
Blanchard, O., Diamond, P., 1990. The cyclical behavior of gross flow of workers in the US. Brookings Papers on Economic Activity 2, 85–155.
Centraal Bureau voor de Statistiek (CBS), 1998. Sociaal Economische Dynamiek, Centraal Bureau voor de Statistiek, Heerlen.
Davis, S.J., Haltiwanger, J.C., Schuh, S., 1996. Job Creation and Destruction, MIT Press, Cambridge / London.