FUSION OF MULTI-SCALE DEMS FROM DESCENT AND NAVCM IMAGES OF
CHANG
’
E-3 USING COMPRESSED SENSING METHOD
M. Peng*, W. Wan, Z. Liu, K. Di
State Key Laboratory of Remote Sensing Science, Institute of Remote Sensing and Digital Earth, Chinese Academy of Sciences, Beijing 100101, China - (pengman, wanwh, liuzq, dikc)@radi.ac.cn
Commission III, ICWG III/II
KEY WORDS: DEM fusion, compressed sensing, landing site mapping
ABSTRACT:
The multi-source DEMs generated using the images acquired in the descent and landing phase and after landing contain supplementary information, and this makes it possible and beneficial to produce a higher-quality DEM through fusing the multi-scale DEMs. The proposed fusion method consists of three steps. First, source DEMs are split into small DEM patches, then the DEM patches are classified into a few groups by local density peaks clustering. Next, the grouped DEM patches are used for sub-dictionary learning by stochastic coordinate coding. The trained sub-dictionaries are combined into a sub-dictionary for sparse representation. Finally, the simultaneous orthogonal matching pursuit (SOMP) algorithm is used to achieve sparse representation. We use the real DEMs generated from Chang’e-3 descent images and navigation camera (Navcam) stereo images to validate the proposed method. Through the experiments, we have reconstructed a seamless DEM with the highest resolution and the largest spatial coverage among the input data. The experimental results demonstrated the feasibility of the proposed method.
* Corresponding author.
1. INTRODUCTION
Chang’e-5 will be China’s first lunar sample return mission.
High precision topographic mapping of Chang’e-5 landing site can provide detailed terrain information to ensure the safety of the lander as well as to support tele-operated sampling of lunar soils and rocks. The lander will acquire descent images in the descent and landing phase, and will also acquire stereo images of the sampling area after landing. A variety of Digital Elevation Model (DEM) products will be generated using image data acquired by different sensors in different phases and they often have differences in spatial coverage, resolution, and accuracy. The multi-source DEMs contain supplementary information, and this makes it possible and beneficial to produce a higher-quality DEM through fusing the multi-scale DEMs.
In the previous Mars and lunar landed missions, descent images have been used for localization of the lander and/or mapping of the landing area. Li et al. (2002) conducted experiments with simulated descent images and Field Integrated Design and Operations Rover data. Ma et al. (2001) developed an integrated bundle adjustment system incorporating both descent and rover-based images to localize the rover along the traverse. Approaches to visual localization using overhead and ground images were reviewed and the particular capabilities under development at JPL were discussed (Matthies et al., 1997). In Mars Exploration Rover (MER) mission, three descent images of low resolution were acquired by Spirit and Opportunity respectively, and they were used in lander localization but was not further used for 3D mapping of the landing area (Li et al., 2005). In the Mars Science Laboratory (MSL) mission, the descent images acquired by the Mars Descent Imager (MARDI) in the Entry-Descent-Landing (EDL) phase were compiled into image mosaics and provide color coverage of the landing site
and science target regions; the mosaics are incorporated into the landing base map (Parker et al., 2013). In Chang’e-3 (CE-3) mission, descent images were used to generate high precision topographic products of the landing site with different resolutions (0.05 m, 0.2 m,0.4 m) and was also used in lander localization (Liu et al., 2015).
For planetary exploration as well as earth observation applications, high spatial resolution DEMs are always of limited spatial coverage due to the high cost of data acquisition, and may have data quality problems such as data voids and noises, while relatively low-resolution DEMs provide less spatial information but usually cover larger areas. In the past years, many studies have been conducted on improving the quality of DEMs, among which fusion ideas haven been introduced into DEM reconstruction. For example, SRTM and ASTER GDEM data were fused in the frequency domain, and the data voids were filled, so that the overall accuracy of the fused data was improved (Karkee et al., 2008). Multi-scale modeling is adopted to fill the voids in high resolution DEM data, and a multi-scale Kalman smoother (MKS) was used to remove blocky artifacts in DEM fusion (Jhee et al., 2013). These methods are not applicable for fusing DEMs with different resolutions, coverage, and vertical accuracies.
To address inhomogenity of available DEM products, several methods of fusing DEMs have been developed to obtain a complete DEM coverage with improved quality. Recently, sparse-representation based methods, as a subset of transform-domain fusion methods, have been applied to DEM fusion. Papasaika et al. (2011) presented a generic algorithmic approach for fusing two arbitrary DEMs, using the framework of sparse representations, and experiments with real DEMs from different earth observation satellites were conducted. Yue et al. (2015) proposed a regularized framework for production of high
resolution DEM data with extended coverage. Boufounos et al. (2011) introduced a new sparsity model for fusion frames, and the model provides a promising new set of mathematical tools and signal models useful in a variety of applications, probabilistic analysis shows that under very mild conditions the probability of recovery failure decays exponentially with increasing dimension of the subspaces. Divekar and Ersoy (2009) created a dictionary that relates high resolution image patches from a panchromatic image to the corresponding filtered low resolution versions, and proposed two algorithms which directly use the dictionary and its low resolution version to construct the fused image. Tao and Qin (2011) proposed a new image fusion algorithm in the compressive domain by using an improved sampling pattern. One key advantage offered by the compressed sensing (CS) approach is that samples can be collected without assuming any prior information about the signal being observed, thereby motivating our research on compressive fusion of DEM.
In this paper we present an improved CS method for fusing multi-scale DEMs to produce high-resolution DEM with extended coverage. Through the experiment using Chang’e DEMs, we have reconstructed a seamless DEM with the highest resolution and the largest spatial coverage among the input data.
The rest of this paper is structured as follows: Section 2 provides a brief description of compressed sensing; Section 3 presents and specifies the proposed method; Experimental results are presented in Section 4. Finally, conclusions and suggestions for future work are given in Section 5.
2. COMPRESSED SENSING
Compressed sensing is a signal processing technique for efficiently acquiring and reconstructing a signal, by finding solutions to underdetermined linear systems. This is based on the principle that, through optimization, the sparsity of a signal can be exploited to recover it from far fewer samples than required by the Shannon-Nyquist sampling theorem (Donoho, 2006).
Supposing the signal f can be recovered from a set of M measurements. This compressive measurement vector can be formulated as
y f (1)
where M( )
yR MN , N is the dimension of the original
signal,RM N is a measurement matrix. Since M<<N, the recovery of the signal vector f from the measurement vector y is a highly underdetermined problem. However, there are two conditions under which recovery is possible. The first one is sparsity which requires the signal to be sparse in some domain. The signal f can be represented sparsely by an orthogonal basis. The second one is incoherence which is applied through the isometric property which is sufficient for sparse signals. The orthogonal basis and compressive measurement matrix are incoherent.
3. METHOD
The proposed fusion method consists of three steps. First, source DEMs are split into small DEM patches, then the DEM patches are classified into a few groups by local density peaks clustering. Next, the grouped DEM patches are used for-dictionary learning by K-SVD algorithm. Finally, the simultaneous orthogonal matching pursuit (SOMP) algorithm is used to achieve sparse representation. After the three steps, the resultant sparse coefficients are then fused following the max L1-norm rule. The fused coefficients can be inversely transformed to a high-resolution DEM with extended coverage by using the learned dictionary.
3.1 Problem formulation
where hrepresents noise vectors; Lk is set as the downsampling
and operator; Mk represents the transformation matrix; as the
coverage for each DEM differs, the cropping operator Ok is
defined as a diagonal matrix with zero elements if the pixel was invalid in the kth input data; furthermore, the voids and the anomalies in the DEM are also included in Ok. The problem is to fuse measurements yk(k=1,2,…n) to recover DEM x.
Assuming the fused result x can be represented as sparse linear combination of elements from a dictionary D, while the elements of the D are called atoms. The result x is sparsely represented over D if x=Da0, a0 denotes a sparse coefficient
vector with most zeros. Therefore, the generative model can be represented as
recovered, and the fused DEM x can determined by computing
0 respect to the observed DEMs yk. The second term is associated with the L1 norm of the candidate solution vector α. The
parameter τ controls the trade-off between data fitting and sparsity. However, since each point at different DEMs has different accuracy, weights parameters should be included in the problem formulation. Therefore the optimization function is modified as follows: borders, the consistency between neighboring patches is imposed. Assuming operator P extracts the overlap region
between patches, yp is a vector containing DEM values in the overlap region, adding the regularization term that minimizing the discrepancy between overlapping patches into (4), the final formulation can be expressed as
As learning an over-complete dictionary capable of representing classified of DEM patches is of great importance. The raw patches are randomly sampled in this paper, which is similar to the approach used in Yang et al.(2008). Then the sampled DEM patches were classified into several new groups based on feature vectors. Since K-SVD is one of the most popular dictionary learning algorithms, the sub-dictionaries are trained by K-SVD. As the structures of DEM patches in each cluster are similar, sub-dictionary learning scheme can get more accurate structure description of input DEM patches. The detail of K-SVD based sub-dictionary learning and combination are shown as follows:
Step 1: A few sub-dictionaries S1, S2, ..., Sn are learned for each
3.3 Adaptive-weight determination for DEM fusion
The fusion is completed with weight maps that reflect the estimated relative accuracy of the source DEMs at each grid point. First, geometric registration should be implemented for the datasets. The transformation matrix Mk can be obtained after registration, and the cropping region can also be derived according to the coordinates.
A data-driven strategy is used to find the weights based on geomorphological characteristics, which is similar to the approach used in Boufounos et al. (2011). Based on the slope and entropy, the resulting accuracy maps of both input DEMs at each overlapping point can be determined, finally the reciprocal values are used as weights for the fusion (Papasaika et al., 2011).
3.4 Fusion of DEMs
Since optimization problems of this form constitute the main computational kernel of compressed sensing applications, there exists a wide options of algorithms for their solution. As its simplicity and computational efficiency, Orthogonal Matching Pursuit (OMP) (Mallat,1998) is adopted. In the experiment, the
overlap parameter β is set between 0.6 and 1.2. The number of non-zero atoms is set between 7 and 15. The minimum patch size is set as 3×3 and it should not be bigger than 9×9.
4. RESULTS AND DISCUSSION
4.1 Landing site mapping using CE-3 descent images
CE-3 began to descent from the lunar orbit at an altitude of around 15 km, and when it was about 2 km above the lunar surface, the descent camera started to take images. During the phases of descending, hovering and obstacle avoidance and landing, the descent camera acquired totally 4,672 images with a resolution higher than 1 m within an area of 1*1 km and as high as 0.1 m within a range of 50 m from the landing point. Main technical parameters of the CE-3 descent camera are listed in table 1. One hundred and eighty were selected with equal time interval and incorporated in a self-calibration free network bundle adjustment, and the initial trajectory (including camera positions and attitudes) of the camera was recovered. Then, 26 ground control points (GCPs) are selected from the rectified Chang’e-2 DEM and digital orthophoto map (DOM) for absolute orientation. The RMSEs (Root Mean Square Errors) of these GCPs are 0.724 m, 0.717 m and 0.602 m in three topographic products of larger coverage were also generated.
Image size Actual imaging
Table 1. Technical parameters of CE-3 descent camera
Figure 1. DEM (right) and DOM (left) generated from of descent images
Stereo base Focal length Image size Field of view 27cm 1189 pixels 1024*1024 pixels 46.4°*46.4°
Table 2. Parameters of Yutu Navcam camera
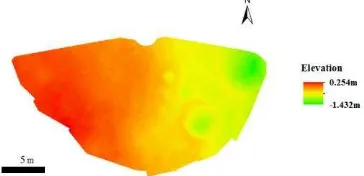
Figure 2. DEM of Navcam images at D site
4.2 Mapping with Navcam images
The geometric parameters of Yutu rover’s Navcam are listed in Table 2. Figure 2 shows DEM at waypoint D, it has a resolution of 0.02 and was automatically generated from the Navcam images. In order to fuse DEMs with descent images, the ground DEM is transformed into the lunar body-fixed coordinate system.
4.3 Integration of mapping products
Discrepancies exist between the topographic products from descent and ground images, co-registration between the two DEMs were performed using Integrative Closet Point algorithm. After the co-registration, the mean differences between the two data sets have been reduced from 0.142 m, 0.096 m, 0.765 m to 0.003 m, 0.004 m, 0.221 m in three directions respectively, as shown in Figure 3.
(a) Point cloud before registration
(b) Point cloud after registration
Figure 3. Co-registration of two datasets
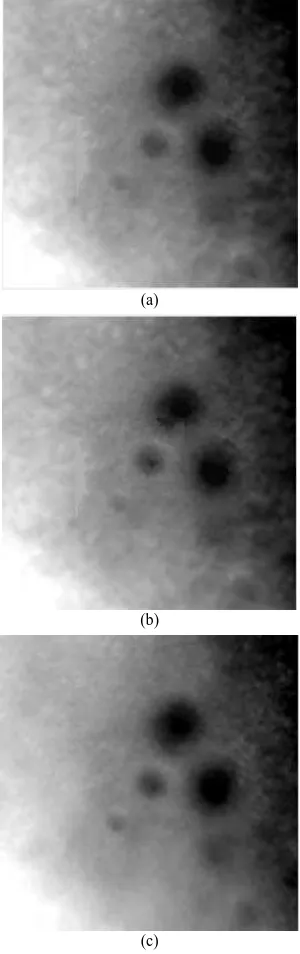
We conducted two sets of experiments to test and evaluate the feasibility of the proposed method. DEM of resolution 0.075 m from lander images with a small selected area shown in Figure 4 were used as the original data, as well as the ground truth for quantitative evaluation. Then the other test DEMs was derived after downsampling and cropping, as shown in Figure 5.
Figure 4. Ground truth
(a) (b) (c)
Figure 5. DEM of resolutions 0.075m,0.2m, 0.4m with different coverage areas
Our purpose was to reconstruct seamless DEM data with a 0.075 m resolution, and the same coverage as the 0.4 m DEM, by fusing the supplementary information between them. The fused result by the proposed method was compared with the interpolated results by the bilinear, and kriging interpolation methods, which are commonly used in DEM densification. In addition, the quantitative indexes of the mean square error (MSE) and PNSR (Peak Noise Signal Ratio) were used to evaluate the vertical accuracy of the results.
1 1
2
0 0 1
[ ( , ) ( , )] m n
i j
RMSE I i j K i j mn
(8)10 20 log MAXI PSNR
MSE
(9)
As in Equation (8), K represents the reconstructed measurement, while I is the reference data,
I
MAX is the maximum possible pixel value of the image. Smaller PMSE and larger PNSR correspond to better performance. Figure 6 shows that our proposed method has better performance and can reconstruct an enhanced elevation result. The quantitative results in Table 3 also confirm the trend.
Bilinear Kriging Proposed
RMSE 15.772 7.886 1.718
PNSR 24.17 30.193 43.43
Table 3. The quantitative results
(a)
(b)
(c)
Figure 6. The reconstruction results of bilinear, kriging interpolation, and the proposed method.
The second experiment was based on lander and Navcam DEMs. The resolutions of the two DEM datasets were 0.05 m and 0.02 m, respectively (Figure 7). Using the two datasets with a size of 161×161, our purpose was to reconstruct seamless DEM data (402 × 402) with a 0.02 m resolution, and the same coverage as the 0.05 m DEM. The fused results by interpolation methods and the proposed method were compared in Figure 8. It can be seen that there are obvious visual differences in this group of results, the proposed method provides more detail-enhanced DEM data with a 0.02 m resolution。
(a) (b)
Figure 7. DEMs of resolutions 0.05m,0.02m with different coverage areas
(a)
(b)
(c)
Figure 8. The reconstruction results of bilinear, kriging interpolation, and the proposed method.
5. CONCLUSIONS
In this paper we present an improved compress sensing method for fusing multi-scale DEMs to produce high-resolution DEM with extended coverage. Compared with traditional fusion methods, the reconstructed data are generated using the supplementary information between DEMs with different resolution and coverage. Furthermore, the grouped DEM patches instead of the whole source image are used for-dictionary learning in the proposed method, which can improve efficiency of the method. We use the real DEMs generated from
Chang’e-3 descent images and Navcam stereo images to validate the proposed method. Through the experiments, we have reconstructed a seamless DEM with the highest resolution and the largest spatial coverage among the input data. The experimental results demonstrated the feasibility of the proposed method. However, there were still some limitations to the proposed method. In the future, more complementary factors like the edginess, the noisiness of DEM will be taken into account to improve the accuracy of the fused data.
ACKNOWLEDGMENT
This study was supported in part by National Natural Science Foundation of China under Grants 41590851 and 41671458. We thank Beijing Aerospace Control Center for providing CE-3 descent and Navcam images and telemetry data.
REFERENCE
Boufounos, P., Kutyniok, G., Rauhut, H., 2011. Sparse recovery from combined fusion frame measurements. IEEE Transactions on Information Theory, 57(6), pp. 3864–3876
Divekar, A., Ersoy, O., 2009. Image fusion by compressed sensing. In: 17th Internationa l Conference on Geoinformatics, pp. 1–6, 12–14.
Donoho, D., 2006. Compressed sensing. IEEE Transactions on Information Theory, 52(4), pp. 1289-1306.
Jhee, H., et al., 2013. Multiscale quadtree model fusion with super-resolution for blocky artefact removal. Remote Sensing Letters, 4(4), pp. 325–334.
Karkee, M., Steward, B. L., and Aziz, S. A., 2008. Improving quality of public domain digital elevation models through data fusion. Biosystems Engineering, 101(3), pp. 293–305.
Li, R. X., Ma, F., Xu, F. L., Matthies, L. H., Olson, C. F. and Raymond, E. A., 2002. Localization of mars rovers using descent and surface-based image data. Journal of Geophysical Research: Planets ( 1991-2012), 107(E11), pp. 1-8.
Li, R., Squyres, S.W., Arvidson, R.E., et al., 2005. Initial Results of Rover Localization and Topographic Mapping for the 2003 Mars Exploration Rover Mission. Photogrammetric Engineering and Remote Sensing, Special issue on Mapping Mars, 71(10), pp. 1129-1142.
Liu, Z. Q., Di, K. C., Peng, M., et al, 2015. High precision landing site mapping and rover localization for Chang’e-3 mission. Science China Physics, Mechanics & Astronomy, 58(1), pp. 1-11.
Ma, F., Di, K. C., Li, R., Matthies, L. and Olson, C., 2001. Incremental Mars rover localization using descent and rover imagery. In: ASPRS 2001 Annual Conference, St Louis, pp. 25-27.
Mallat, S., 1998. A Wavelet Tour of Signal Processing, 2nd edn. Academic Press, London.
Matthies, L., Olson, C. F., Tharp, G. and Laubach, S., 1997. Visual localization methods for Mars rovers using lander, rover and descent imagery. In: Proceedngs of the 4th International Symposium on Artificial Intelligence, Robobics, and Automation in Space, Tokyo, Japan, pp. 413-418.
Parker, T., Malin, M., Calef, F., Deen, R., Gengl, H., Golombek, M., Hall, J., Pariser, O., Powell, M., Seltten, R. and MSL Science Team, 2013. Localization and contextualization of curiosity in gale crater, and other landed mars missions. In: 44th Lunar and Planetary Science Conference, the Woodlands, Texas, Lunar and Planetary Institure, pp. 2534.
Papasaika, H., Kokiopoulou, E., Baltsavias, E., Schindler, K., Kressner, D., 2011. Fusion of Digital Elevation Models Using Sparse Representations. Proceedings of the 2011 ISPRS Conference on Photogrammetric Image Analysis, PIA’11, Munich, Germany, October 5-7, pp. 171-184.
Tao, W., Qin Z., 2011. An application of compressed sensing for image fusion. In: conference on image and video retrieval, 88(18), pp. 3915–3930.
Yang, J., Wright, J., Huang, T., et al., 2008. Image super-resolution as sparse representation of raw image patches. In: Computer Vision and Pattern Recognition, pp. 1-8.
Yue, L., Shen, H., Yuan, Q. and Zhang, L., 2015. Fusion of multi-scale DEMs using a regularized super-resolution method. International Journal of Geographical Information Science. DOI: 10.1080/13658816.2015.1063639