APPROACH TO CONSTRUCTING 3D VIRTUAL SCENE OF IRRIGATION AREA
USING MULTI-SOURCE DATA
Shuai Cheng a,b,c, Mingzhu Dou d,Jinxin Wang c,Shuqing Zhang a,b,*, Xiangcong Chen a,b
aNortheast Institute of Geography and Agroecology, Chinese Academy of Sciences, Changchun 130102, China; bUniversity of Chinese Academy of Sciences, Beijing 100049, China; cSchool of Water Conservancy
& Environment ,Zhengzhou University,Zhengzhou 450001,China; dCollege of Life Science ,Shandong Normal University,Jinan 250014,China
KEY WORDS: irrigation area; 3D GIS; 3D virtual scene; multi-source data; interactive modeling
ABSTRACT:
For an irrigation area that is often complicated by various 3D artificial ground features and natural environment, disadvantages of traditional 2D GIS in spatial data representation, management, query, analysis and visualization is becoming more and more evident. Building a more realistic 3D virtual scene is thus especially urgent for irrigation area managers and decision makers, so that they can carry out various irrigational operations lively and intuitively. Based on previous researchers' achievements, a simple, practical and cost-effective approach was proposed in this study, by adopting3D geographic information system (3D GIS), remote sensing (RS) technology. Based on multi-source data such as Google Earth (GE) high-resolution remote sensing image, ASTER G-DEM, hydrological facility maps and so on, 3D terrain model and ground feature models were created interactively. Both of the models were then rendered with texture data and integrated under ArcGIS platform. A vivid, realistic 3D virtual scene of irrigation area that has a good visual effect and possesses primary GIS functions about data query and analysis was constructed.Yet, there is still a long way to go for establishing a true 3D GIS for the irrigation are:
issues of this study were deeply discussed and future research direction was pointed out in the end of the paper.
1. INTRODUCTION
Irrigation area plays a vital role in ensuring the normal
agricultural production and food security, enhancing irrigation water use efficiency(WUE), increasing crop yield and the economic benefits, allocating water resources optimally and reasonably, as well as regulating and improving the ecological environment, etc[1, 2]. The modern high-techs such as geographic information system (GIS), remote sensing (RS), and virtual reality (VR), etc. have been wildly applied in irrigation area daily operation and management to speed up the irrigation area information establishment and promote the level of irrigation area management[3-5]. However, the difference between the virtual space represented by traditional 2D GIS platforms and the real world is striking due to the lack of the vertical dimension. In line with the reality of objective world and people's cognitive habits, 3D virtual environment is therefore imperative for visualizing and interoperating spatial features, as well as analyzing the relationship among them [6]. This would enable irrigation area managers and decision makers, in a multi-view, multi-scale way, to intuitively and macroscopically observe and analyze study interest and management goals, including implementation of engineering design and planning, selection of hydraulic facilities location, and allocation of irrigation water resources. Furthermore, 3D platforms should have dynamic characteristics, so that the final result and intermediate links can be simulated and evaluated as a whole and in real-time[7].
There exit various approaches to create 3D virtual environment in terms of data sources, software for 3D model generation, as well as platforms for 3D scene display. For instance, spatial data for creating 3D scene include topographic maps, images from aerial photography and remote sensing, airborne/vehicle-based LiDAR point clouds, etc.; while software or tools commonly used for 3D model generation involve 3Dmax, Multigen-creator, Sketchup, etc.; as for platforms of 3D scene display, they can be realized by means of
low level development or secondary development [8, 9]. The intuitive effect provided by the above-mentioned approaches varies distinctively. But the construction of an accurate and high quality 3D scene is usually time and financially consuming, and moreover, special hardware and software systems might be required.
In this study, based on the theories, strategies and approaches presented by previous researches to built 3D virtual environment[10-13], an efficient technical routine was put forward to create a 3D virtual environment for an irrigation area, according to the real situation of irrigation area, by comprehensively making use of remote sensing (RS), geographic information systems (GIS), and virtual reality (VR). Hereinto, multi-source shared data sources were using integratively, and various 3D models were built through interactive and integrative modeling. The proposed methodology was applied to Zhaokou irrigation area, Yellow River basin, central part of China. The study illustrated the feasibility of the application of high-techs (e.g. GIS, RS) on the daily irrigational operation, in which the level of management and scientific decision-making capacity could be promoted.
2. DATA SOURCE AND STUDY AREA
2.1 Study area
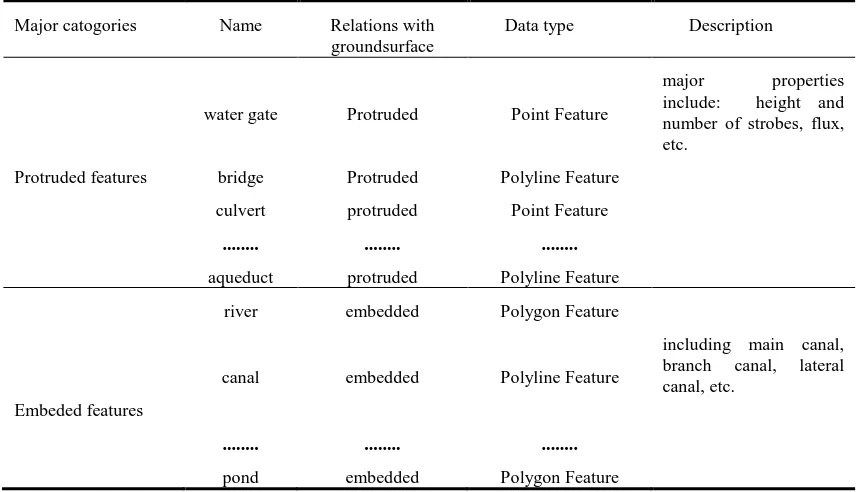
Zhao Kou irrigation area, a hilly and plain region with a complex geographic environment, is located in the southern bank of the Yellow River, Henan province, China. There are widely covered, well-equipped irrigational facilities including water gate, culvert, bridge, inverted siphon, aqueduct, as well as different levels of canal such as main canal, branch canal, lateral canal, etc. These irrigational features, as listed in Tab. 1, can be divided into two categories, namely protruded features (those protruded from the ground surface) and embedded features (those embedded into the ground, no higher than the ground surface). In addition to these irrigational features, there are
general geographic features in the study area such as residential buildings, farmlands, roads, trees, etc.
Table 1 Feature list of irrigational facilities
Major catogories Name Relations with groundsurface
Data type Description
water gate Protruded Point Feature
major properties include: height and number of strobes, flux, etc.
Protruded features bridge Protruded Polyline Feature
culvert
...
aqueduct
protruded
...
protruded
Point Feature
...
Polyline Feature
river embedded Polygon Feature
Embeded features
canal
...
embedded
...
Polyline Feature
...
including main canal, branch canal, lateral canal, etc.
pond embedded Polygon Feature
2.2 Data source
Data acquisition is the prerequisite to the creation of 3D virtual scene. Along with the emergence and development of GIS information sharing technology, source, multi-scale, massive geocoded data are shared on the internet. This offers opportunities for GIS users from diverse fields to carry out applications in a timely and cost-efficient manner, to meet their application requirements.
2.2.1 Acquisition and processing of remote sensing images
Google earth (GE) provides global remote sensing images, which is an integrated dataset of satellite and aerial images, rather than a single data source. The effective spatial resolution of the images is 30 meters as usual, and in some places, resolutions of high precision images can reach as much as lm or 0.6m. The images can be achieved by either ways: charged GE time-serial imagery within the selected sample blocks provided by U.S. government agencies, such as the National Agricultural Imagery Program(NAIP) administered by the USDA Farm Services Agency, as well as commercial company such as GeoEye, Inc [14]; free access with screenshot software by getting access to GE com API and KML. The later approach was adopted in this research, considering its economy and convenience. Remote sensing images at 1m resolution were obtained by using GetScreen opensource software assigned with a specific view point height. Due to the lack of projection information, these screen-shotted images should be geo-registered. In this study, image geometric correction was performed by using surveyed GPS points as spatial references under Xi'an 80 coordinate system. The 1m resolution GE RS image, as well as the 2D
thematic irrigation map derived from it, is roughly equivalent to topographic maps of 1:10000 scale, which is enough to meet the accuracy requirement of irrigational management in the study area[15]. Fig.1a is the high resolution mosaic image, and Fig.1b is the corresponding thematic map obtained through interactive visual interpretation and classification.
Fig.1a High-resolution GE RS image
Fig.1b 2D thematic map
2.2.2 Acquisition and processing of DEM
DEMs are a vital source of topographical data for 3D visualization field. National Aeronautics and Space Administration (NASA) offers Advanced Spaceborne Thermal Emission and Reflection Radiometer (ASTER) and Shuttle Radar Topography Mission(SRTM) global DEMs in
GeoTIFF format on its website
(https://wist.echo.nasa.gov/api/) for free. The ASTER with the mission to obtain high spatial resolution global or regional images of the earth was designed, calibrated, and validated by a joint U.S./Japan science team, and it was launched on the Terra platform as part of the NASA’s Earth Observing System (EOS) on December 19th, 1999[16]. GeoTIFF format remote sensing image is a TIFF file containing geographic information, such as ellipsoid benchmark, coordinate system and projection information, and so on.
ASTER G-DEM has higher position accuracy and fewer missing cells, particularly in steep terrain; in contrast, SRTM DEM includes many local spikes and holes, and tends to overestimate valley-floor elevation and underestimate ridge elevation[17]. That is to say, ASTER G-DEM gives timely, smoother and more realistic topographic representations. The sampling precision on the ground is up to 30 x 30 meters, and the altitude accuracy is about 7 meters to 14 meters, the quality of the image can basically meet the acquirement to built 3D terrain model[18].
Since the research area is mostly covered by flat terrain, 3D terrain-based irrigational analysis like irrigational project design, site selection and construction, slope and aspect analysis and the estimation of earthwork should be performed on a relatively high resolution DEM. Thus DEM of 30m resolution (rather than that of 90m resolution) which basically satisfies the accuracy requirement of above mentioned applications, was chosen here. The G-DEM remote sensing data obtained from ASTER covers most of the earth surface (from 83°N to 83°S) except part of the polar region. Each scene of G-DEM terrain image data covers a surface area of 1°x 1° of the earth with a grid of 3601×3601 pixels. Fig.2a is a whole scene of G-DEM image, while the research area (Fig. 2b) is located at the northeast part. The G-DEM image was then geo-registered in accordance with the GE remote sensing image, and was finally transformed to TIN format, serving as the basis of three-dimensional terrain modeling.
Fig.2a Original ASTER G-DEM
Fig.2b Clipped G-DEM
GE remote sensing image and ASTER G-DEM, as well as various kinds of 2D vector data with attribute information were added on the same spatial coordinate system and managed in a layer-based manner in geodatabase of ArcCatalog.
3. CONSTRUCTION OF 3D VIRTUAL
ENVIRONMENT IN IRRIGATION AREA
The spatial entities in the irrigation area can't get into
computer automatically. Instead, they should be modeled in a specific digital format.
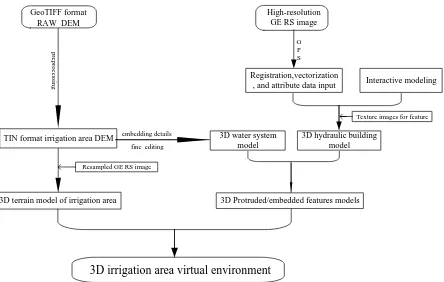
3.1 The flowchart for 3D modeling
Based on the processed remote sensing images and DEM, the whole 3D modeling flowchart in irrigation area can then be formulated. As illustrated by Fig.3, three major procedures are included in the modeling flowchart: the first technical step is to register and vectorize the high-resolution GE remote sensing images, so as to obtain the corresponding texture data for the establishment of a lively 3D terrain scene and for the base map of interactive 3D feature modeling. Secondly, the raw GeoTIFF format DEM image is geo-registered and transformed into triangulated irregular network (TIN) model; the TIN model is then overlaid by the processed GE image (as a texture data) to generate more realistic 3D terrain scene of the irrigation area. The third technical step is to build 3D feature models and render them with real photos or texture maps: for the features above ground (protruded features), interactive modeling method was adopted based on GE images to build 3D models for them, and then the rendered feature models were matched with the 3D terrain model; as to features below ground (embedded features), some detailed elements with property information were endowed into the preliminarily generated TIN format irrigation area DEM and edited fine according to the actual environment.
GeoTIFF format
, and attribute data input Interactive modeling
3D hydraulic building
Fig.3 Flowchart for creating a 3D virtual environment of irrigation area
3.2 Construction of 3D terrain in irrigation area
It can be seen from the above-mentioned modeling flowchart that the establishment of 3D virtual environment in irrigation area relies on 3D terrain model in combination with 3D feature models. Thus building a high-quality 3D terrain model is vital to the success of the work. Currently, DEM is expressed in three forms, namely digital contour model, raster grid (Grid) model and irregular triangular grid (TIN) model. Thanks to its desirable characteristics, such as self-adaptive representation to the topographic complexity, well integration with ground features, and high computational efficiency, etc. TIN model is the most frequently used structure to describing 3D terrain [19].
The final step of topographic modeling was to endow the ground surface with texture information. Researchers have tried to increase the vivid and natural visual effects of the 3D terrain model as much as possible by making use of various texture mapping methods, including volume
rendering-based approaches, fractal geometry-based approaches, as well as 2D texture mapping, etc. Hereinto, the 2D texture mapping method is more common and practical, which depicts texture details onto the constructed 3D terrain model, namely dealing with the relationship between the three-dimensional topographic (or feature) surface points and texture space points[12]. In this study, 2D texture mapping was hence made for the 3D terrain model by using the superimposed high resolution GE remote sensing image, as illustrated by Fig.4:
Fig.4 3D terrain model for irrigation area
3.3 Construction of embedded features
In addition to terrain model, the 3D virtual environment of an irrigational area should consist of spatial features. Different kinds of spatial features usually have their own properties (i.e. attribute data), as illustrated by Tab. 2 which shows the attributes of the Zhaokou main canal. Note, all of attribute data can be jointly derived from hydrological facility map (2D map) and main canal engineering drawing (3D height attributes).
Table 2 Properties of Zhaokou main canal
Canal_Name Type Length Soil_Type Lining_Type Transect_Type Normal_Flux ZhaoKou
Main canal
trunk canal 27.5km Silt concrete ladder
(top:42m; bottom:23m;
height: 4m)
110m3/s
The two kinds of irrigational features (i.e. embedded features and protruded features) are modeled in different ways. For embedded features, their model construction usually relies on the 3D terrain model. Here the corresponding detailed modeling process is elaborated by using the Zhaokou main canal as an example (Fig. 5). The canal, 42 meters in width, can’t be shown on the original TIN model (Fig. 5b) which was built from ASTER G-DEM (Fig. 5a), let alone those of much narrowed lateral canal systems. Therefore, the canal model was firstly created according to the attributed data (Tab. 2), and then embedded into the original TIN model, as illustrated by Fig. 5c. The TIN model with the embedded features (called co-generated TIN model) looks rather coarse, and is often inconsistent with the real situation. Further edition under SketchUp modeling environment (Fig. 5d), i.e. hybrid modeling, is therefore required. After hybrid modeling, the embedded features can better match the co-generated TIN model (see Fig. 5e). Finally, a constant elevation offset was added in order to obtain a better 3D visual effect, as presented by Fig. 5f.
Fig.5 Flowchart for modeling features below ground
3.4 Modeling the protruded features and integrating
them with terrain model
As for the construction of the protruded features (i.e. the spatial features above the ground surface), an interactive modeling approach is employed. Here a water gate (Fig. 6) was exemplified to expound the major modeling steps of: (1) importing the GE high resolution remote sensing image into the SketchUp modeling platform, and letting it serve as the 3D modeling base map (Fig. 6a); (2) drawing the outline (i.e.
the 2D geometry) of the water gate according to the remote sensing image (Fig. 6b); (3) elaborating the detailed structure (i.e. the 3D geometry) of the water gate based on the head sluice engineering drawing, as demonstrated by Fig. 6c; (4) rendering the 3D water gate model with materials produced by the modeling software or with photos captured by cameras (Fig. 6d).
Fig.6 Building ground feature 3D model by using interactive modeling method
The purpose of establishing a 3D virtual environment in an irrigational area is for spatial visualization, spatial data query and analysis. The protruded features created by Sketchup software are, however, separately modeled and stored in individual files. Consequently, these feature models should be imported into ArcGIS geodatabase, so that they can be visualized collectively and their spatial relations, as well as attribute information, can be queried and analyzed.
Mismatching between ground feature models and terrain model often occurs when both kinds of models are overlaid, thus requiring interactive adjustment according to the real situation. Ground features are geometrically represented as point (e.g. trees), polyline (e.g. roads) and polygon entities (e.g. buildings) in the 2D map derived the GE high resolution remote sensing image. For 3D models generated from point features, their height attributes should be endowed; for those from polyline features, in addition to the assignment of their height attributes, their geometries should be edited according to the real terrain, i.e. eliminating mismatch between polyline features and the topography; while those from 2D polygon features may belong to 3D surface models or 3D solid models, both of which should be glued to the terrain surface, and moreover, orientation of each 3D solid model should be adjusted in line with the real situation. Fig. 7a is the 3D panoramic virtual environment of irrigation area, while Fig. 7b is the corresponding scene being zoomed in.
Fig.7a 3D panoramic virtual environment
Fig.7b Partial scene being zoomed in
3.5 Primary application of 3D virtual environment of
irrigation area
The established 3D virtual environment of irrigation area plays an important role in spatial data analysis for irrigational operation and management. In comparison with 2-dimensional GIS, such a 3D virtual environment exhibits great advantages. Fig. 8a shows a 2D GIS map in which a water gate and the Zhaokou main canal is respectively represented as a point and a polygon feature; whereas their 3D models, as illustrated by Fig. 8b (the water gate) and Fig. 8c (the canal), demonstrate that both of the features are actually volume objects. The 3D feature models can not only be viewed omni-directionally at multi-scales, 3D spatial analysis based on them such as 3D profile analysis can be further performed, as shown by Fig. 8c. Moreover, it is possible to carry out complex spatial analysis on irrigational operations. A program of irrigation water allocation aiming to minimize the loss of water volume, for example, water paths through different levels canal system and various hydraulic structures can be designed and simulated, according to the restriction of irrigation facilities; meanwhile, the simulation can be three-dimensionally visualized, so that the detailed water flow process can be better observed.
Fig.8 Comparison of ground features between 2D and 3D environment
4. DISCUSSION AND CONCLUSIONS
The purpose of scientific irrigation area management is for optimal allocation of water resources, sustainable development of modern agriculture, and preservation of ecological systems. Due to the complexity and diversification of irrigation area, where various man-made irrigational facilities and natural geographic environment co-exist, it is therefore hard to create a complex and realistic virtual scene of irrigation area with only one data source and purely depending on a single modeling software and tool. According
to management and operation requirements of irrigation area, a simple, practical and cost-effective approach was proposed to the construction of 3D virtual environment by synthesizing previous modeling methods and utilizing shared multi-source data in this study.
The spatial data adopted in this paper includes high resolution remote sensing image from Google Earth (GE), Aster G-DEM from NASA, hydrological facility structure maps from the management department of irrigation area, etc. Hereinto, the remote sensing image serves as the base map and for texture mapping, G-DEM for topographic modeling, and facility structure maps for auxiliary irrigational facility feature modeling respectively. Each of the ground features was modeled interactively and stored separately under the support of SketchUp software, while the integration of feature models and terrain model was accomplished under ArcGIS platform, with topological relations being interactively edited. By doing so, a 3D virtual environment of Zhaokou irrigation area that has a good visual effect and possesses primary GIS functions about data query and analysis, was successfully built up.
In comparison with the multi-level city data modeling (e.g. CityGML with five multi-level details), this paper resents a primary application of 3D GIS in the irrigation area which has a relatively specified application purpose. Yet, it has a long way to go before establishing a true 3D geographic information systems (3D GIS) of irrigational area with complete and correct 3D geometric, topological and semantical information. The proposed approach to establishment of the 3D virtual environment does not guarantee the perfectness of ground features’ geometry and their topological relationships with the terrain model, due to manual operations. Meanwhile, semantics and attributes of a ground feature are only assigned as a whole, thus lacking the ability in multi-level, multi-class semantic and attribute data management, for example, the inner structure of the sluice shown by Fig. 6d cannot be queried and analyzed. These mentioned issues call for the innovation of 3D GIS from a low level, namely 3D data model and data structure.
ACKNOWLEDGMENTS
This research was under the auspices of the key project of the 12th five-year plan, CAS (KZZD-EW-07-02-003), and the CAS Action Plan for the West Development Program (Grant number: KZCX2-XB3-15).
REFERENCES
Abrams, M., H. Tsu, G. Hulley, et al., The Advanced Spaceborne Thermal Emission and Reflection Radiometer (ASTER) after fifteen years: Review of global products. International Journal of Applied Earth Observation and Geoinformation, 2015. 38: p. 292-301.
Bulatov, D., G. Haufel, J. Meidow, et al., Context-based automatic reconstruction and texturing of 3D urban terrain for quick-response tasks. Isprs Journal of Photogrammetry and Remote Sensing, 2014. 93: p. 157-170.
Castelletti, A., S. Galelli, M. Ratto, et al., A general framework for Dynamic Emulation Modelling in environmental problems. Environmental Modelling & Software, 2012. 34: p. 5-18.
Correal, R., G. Pajares, and J.J. Ruz, Automatic expert system for 3D terrain reconstruction based on stereo vision and histogram matching. Expert Systems with Applications, 2014. 41(4): p. 2043-2051.
Hameed, I.A., Intelligent Coverage Path Planning for Agricultural Robots and Autonomous Machines on Three-Dimensional Terrain. Journal of Intelligent & Robotic Systems, 2014. 74(3-4): p. 965-983.
Hansen, M.C., A. Egorov, P.V. Potapov, et al., Monitoring conterminous United States (CONUS) land cover change with Web-Enabled Landsat Data (WELD). Remote Sensing of Environment, 2014. 140: p. 466-484.
Hayakawa, Y.S., T. Oguchi, and Z. Lin, Comparison of new and existing global digital elevation models: ASTER G-DEM and SRTM-3. Geophysical Research Letters, 2008. 35(17).
Jarihani, A.A., J.N. Callow, T.R. McVicar, et al., Satellite-derived Digital Elevation Model (DEM) selection, preparation and correction for hydrodynamic modelling in large, low-gradient and data-sparse catchments. Journal of Hydrology, 2015. 524: p. 489-506.
Kedzierski, M. and A. Fryskowska, Terrestrial and Aerial Laser Scanning Data Integration Using Wavelet Analysis for the Purpose of 3D Building Modeling. Sensors, 2014. 14(7): p. 12070-12092.
Levidow, L., D. Zaccaria, R. Maia, et al., Improving water-efficient irrigation: Prospects and difficulties of innovative practices. Agricultural Water Management, 2014. 146: p. 84-94.
Li, Q.q. and D.r. Li, Research On The Conceptual Frame Of The IntegrationOf 3d Spatial Data Model. Acta Geodaetica et Cartographica Sinica, 1998. 27(4): p. 46-51.
María Dolores Robles-Ortega, Lidia Ortega , Francisco R. Feito A new approach to create textured urban models through genetic algorithms. 2013.
Olanda, R., M. Perez, J.M. Orduna, et al., Terrain data compression using wavelet-tiled pyramids for online 3D terrain visualization. International Journal of Geographical Information Science, 2014. 28(2): p. 407-425.
Perera, G.S.N. and H.G. Maas, Cycle graph analysis for 3D roof structure modelling: Concepts and performance. Isprs Journal of Photogrammetry and Remote Sensing, 2014. 93: p. 213-226.
Snyder, R.L., C. Pedras, A. Montazar, et al., Advances in ET-based landscape irrigation management. Agricultural Water Management, 2015. 147: p. 187-197.
UNESCO, WWDR3: "Water in a Changing World". 2009. Worqlul, A.W., A.S. Collick, D.G. Rossiter, et al., Assessment of surface water irrigation potential in the Ethiopian highlands: The Lake Tana Basin. Catena, 2015. 129: p. 76-85.
Wu, X.J., J. Zhou, H.J. Wang, et al., Evaluation of irrigation water use efficiency using remote sensing in the middle reach of the Heihe river, in the semi-arid Northwestern China. Hydrological Processes, 2015. 29(9): p. 2243-2257.
Zhang, S.Q. and J.Y. Zhang, Theoretical analytics of stereographic projection on 3D objects' intersection predicate. International Journal of Geographical Information Science, 2010. 24(1): p. 25-46.