HANDLING IMPRECISION IN QUALITATIVE DATA WAREHOUSE: URBAN
BUILDING SITES ANNOYANCE ANALYSIS USE CASE
F. Amanzougarene,a, b, * M. Chachoua a, K. Zeitouni b
a
EIVP, École des ingénieurs de la ville de Paris, 80, rue Rébeval, 75019 Paris, France- (fatiha.amanzougarene, chachoua)@eivp-paris.fr
b
PRISM, Université de Versailles-SQ, 45 Avenue des Etats-Unis 78035 Versailles, France- [email protected]
KEYWORDS: Decision-making, imprecision management, data warehouse, multidimensional model, qualitative data processing, urban sites annoyance.
ABSTRACT:
Data warehouse means a decision support database allowing integration, organization, historisation, and management of data from heterogeneous sources, with the aim of exploiting them for decision-making. Data warehouses are essentially based on multidimensional model. This model organizes data into facts (subjects of analysis) and dimensions (axes of analysis). In classical data warehouses, facts are composed of numerical measures and dimensions which characterize it. Dimensions are organized into hierarchical levels of detail. Based on the navigation and aggregation mechanisms offered by OLAP (On-Line Analytical Processing) tools, facts can be analyzed according to the desired level of detail. In real world applications, facts are not always numerical, and can be of qualitative nature. In addition, sometimes a human expert or learned model such as a decision tree provides a qualitative evaluation of phenomenon based on its different parameters i.e. dimensions. Conventional data warehouses are thus not adapted to qualitative reasoning and have not the ability to deal with qualitative data. In previous work, we have proposed an original approach of qualitative data warehouse modeling, which permits integrating qualitative measures. Based on computing with words methodology, we have extended classical multidimensional data model to allow the aggregation and analysis of qualitative data in OLAP environment. We have implemented this model in a Spatial Decision Support System to help managers of public spaces to reduce annoyances and improve the quality of life of the citizens. In this paper, we will focus our study on the representation and management of imprecision in annoyance analysis process. The main objective of this process consists in determining the least harmful scenario of urban building sites, particularly in dense urban environments.
1 INTODUCTION
Data warehouses and on-line analytical processing (OLAP) constitute the main elements of decision support systems. A data warehouse means a decision support database allowing integration, organization, historization, and management of data from heterogeneous sources, with the aim of exploiting them for decision-making (Kimball, 2002; Inmon, 2005). OLAP refers to the technology that allows users to efficiently retrieve the information stored in a data warehouse. To conceptualize data in a data warehouse, the multidimensional model is used. This model organizes data into facts (subjects of analysis) and dimensions (perspectives of analysis). A fact is composed of numerical measures and dimensions which characterize it. A dimension is organized into hierarchical levels of detail. Based on the navigation and aggregation mechanisms offered by OLAP tools, facts can be analysed according to the desired level of detail. In some real world applications, the subject of analysis may be subjective and consequently its measures are provided in qualitative fashion. In addition, sometimes a human expert or a prediction model such as a decision tree can be used to provide a qualitative evaluation of some phenomenon based on its different parameters. This arises in many applications such as customer satisfaction, process control, consumer products, and annoyance evaluation. Conventional data warehouses are thus not adapted to human reasoning and have not the ability to deal with qualitative data. In previous work, we have presented an original work that aims at making it possible to handle raw qualitative measures and providing a more flexible method for the multidimensional analysis over that type of data. Based on computing with words methodology, we have introduced qualitative measures and aggregates as an extension of multidimensional data model of a data warehouse. Using these
measures and aggregates, OLAP queries allow the decision maker to manipulate data in a qualitative fashion using linguistic terms. In this paper, we will extend this model to deal with both qualitative and quantitative measures, which leads to handle imprecise data in a data warehouse. Compared to the state of the art, there exists several research works addressing aggregation over imprecise and uncertain data, among which those proposed in (Laurent, 2001; Molina, 2006; Burdick, 2007; Delgado, 2007). Our study will focus on the fuzzy fusion of qualitative and quantitative measures in the context of data warehouses. To illustrate the problematic and our proposal, we will consider throughout this paper the case of urban building sites annoyance.
This paper is structured as follows. In the second section we present our work motivation and the use case related to urban building sites annoyance evaluation and analysis. In the section 3, propose the data model allowing the combination of qualitative and quantitative measures in the context of imprecise multidimensional databases. In the section 4 we present the experimentation framework that consists of a Spatial Decision Support System (SDSS) designed to the annoyance analysis. Finally, in the last section we conclude and present some perspectives.
2 MOTIVATION AND USE CASE: URBAN BUILDING SITES ANNOYANCE
becomes more complex in cities with high population density. The main objective of our work is to develop a spatial decision support system (SDSS) dedicated to reducing the annoyance generated by urban building sites. We make the observation that, in human reasoning, the annoyance is evaluated subjectively and qualitatively by using an ordinal scale of linguistic degrees. Therefore, for a perfect match with the human expert reasoning, we propose in this paper a qualitative model of annoyance evaluation. In our previous studies (Amanzougarene, 2012), we have presented a quantitative model that allows evaluating urban people annoyance due to the noise. By comparison, in the present work, we generalize our previous model by privileging a qualitative data handling of annoyance. We also extend our previous model of annoyance evaluation to other types of nuisance than noise, which strengthens the interest of multidimensional analysis. Indeed, an urban building site is generally likely to cause many nuisances.
2.1 Qualitative Representation of Annoyance
2.1.1 Notion of Annoyance: As several studies show it, annoyance is an unpleasant sensation experienced by an individual facing deterioration in the quality of her/his environment (Guski, 1999; Nordin, 2006; Moser, 2006; Robin, 2007). The annoyance may be caused by various nuisances (noise, odour, vibration, traffic congestion, air pollution…). According to various factors (intensity, moment, type…), a nuisance is likely to cause a more or less important annoyance to individual. Note that the level of annoyance caused by one or more nuisances can be different from one individual to another, depending on various factors (sensibility, age, acceptability…). This means that, a phenomenon which is not at all annoying for an individual can be extremely annoying for another individual. That reflects the subjective character of the annoyance notion. Thus, for the rest of our study, we propose the following definition for the annoyance notion.
Definition1. In a spatiotemporal environment, annoyance is subjective relationship between an individual and a harmful phenomenon.
In other words, an individual can be only annoyed, in the presence of one or more harmful phenomena for this individual. Thus, a human expert can evaluate subjectively the degree of annoyance, according the various factors (Amanzougarene et al. 2011). The most relevant factors can be classified in three categories: (1) factors related to individual, (2) factors related to nuisance, (3) factors related to environment. The table below shows these three categories, with the main factors.
Factors related to individual
Factors related to nuisance
Factors related to environment Age
Health condition Gender
Socio-professional category
Acceptability Awareness
Nuisance type Nuisance intensity Exposure duration Frequency
Space Time
Table 1. Main factors of annoyance
These three categories of factors will be used to evaluate the annoyance and to determine the scenario of building site which produce the minimum of annoyance.
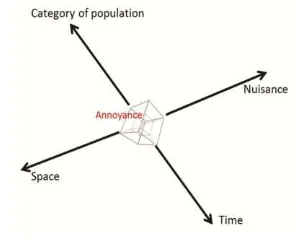
2.1.2 Dimensions of Annoyance:In practice, the choice of factors to be considered for the annoyance evaluation depends on the human experts’ appreciation. In our case study, the experts have retained some factors related to individual, nuisance and environment. The latter is actually a combination of space and time dimensions. This leads to a multidimensional representation described by Figure 1 below and including the dimensions: (1) category of population grouping the factors related to the individual, (2) nuisance grouping the factors related to the nuisance, (3) space, and (4) time. Notice that the choice of the dimensions is application-dependant, and could add or ignore some factors such as the building type or gender. Our model adapts to other schemas as well.
Figure 1. Multidimensional representation of annoyance
Categories of Population:
In our case study, the categories of population exposed to nuisances are represented by a typical individual. These are determined by a combination of factors already presented in Table 1. For instance, a category of population could be “healthy senior manager” which means implicitly an adult individual of male gender, whose category socio-professional is manager, in good health condition. Another category of population could be “housewife mother”, meaning an unemployed adult of female gender. A third one could be “child
breathing problems”, meaning a young individual who is not in
good health condition.
Nuisances:
Nuisances to which are exposed the different categories of population concerned by the carrying out of an urban building site can be classified into three categories: (1) Nuisances related to the living environment: characterizing unwanted changes in habits of the population impacted (2) Nuisances related to the landscape insertion of urban building sites: describing changes in the visual environment, and (3) Sensorial nuisances: such as noise, dust, odour and vibration.
Time:
People are not annoyed in the same way according to the moments of the day and the periods of the year. For example, given residential area, a height noise can be accepted during the day but not at all at night. In our case study, we define a hierarchy of time. This hierarchy consists to divide year on two periods: (1) rainy period and (2) non-rainy period. The weekdays are divided into three moments: morning, evening, and night.
Space:
area into several sub-areas. For example: the immediate vicinity, the influence area, and the boundary of the influence area. For this dimension we will use an a priori geographical zoning.
2.2 Annoyance Evaluation
In human reasoning, the subjective evaluation of annoyance is done qualitatively by using a finite scale of linguistic degrees, such as, “low”, “high”…. Generally, the human subject uses ordered scales with 5 or 7 linguistic degrees (Yager, 2007). In our case study, the evaluation process is as follow (For the sake of space, we will briefly describe the evaluation process):
1. Define four combinations of dimensions: (Category of population-Time), (Time-Nuisance), (Category of population-Nuisance) and (Intensity-Nuisance). 2. For each combination, a scale of 1 to 4 is used. 3. The value of a given evaluation is the product of the
values corresponding to the precedent combinations. 4. Thus, the interval of evaluation is [1-256]. This
interval is divided to five subintervals: [0-10], ]10-30], ]30-60], ]60-100] and ]100-256]. To these subintervals, it is associated respectively the following linguistic terms :
Note: thereafter, in the interests of simplifying notations, we will represent these linguistic degrees respectively by
Example of Annoyance Evaluation:
Let us consider a given location L1 where one has three nuisances, noise, odour, and dust. An extract of the annoyance evaluation carried out by the human experts is shown in Table 2 below. We note that, this evaluation takes into account only the following factors: (1) socio-professional category (SPC), (2) age, (3) type, (4) intensity, (5), time of day, and (6) period of year. In this evaluation, 5 levels of nuisance intensity are considered. Level 1 corresponds to the absence of nuisance, which means that the degree of annoyance is i.e. not at all annoyed. This table is an extract of the decision matrix carried out by the experts based on different dimensions of annoyance. This matrix will serve as knowledge base to populate the data warehouse designed to contain data related to annoyances. This warehouse constitutes the core of our SDSS.
Space = L1
Category of population
SPC Inactive resident
Age Young Adult Old
people
Nu
isa
n
ce
Ty
p
e
In
te
n
si
ty
N
o
ise
1 2
… …
Time Morning Evening Night
Period Non-rainy period
Time
Table 2. Application: example of annoyance evaluation
3 TOWARDS A QUALITATIVE
MULTIDIMENTIONAL MODEL FOR HANDLING IMPRECISE DATA
In this section, first, we will describe the multidimensional model of annoyance that will be used as a running example for the rest of the paper. Then, we will describe our proposed model to represent and mange imprecision in context of data warehouse.
3.1 Multidimensional Data Model of Annoyance
In our case study concerning urban building sites, the subject of analysis corresponds to the annoyance. This subject is analyzed according to the dimensions we have presented in section 2.2. Namely: nuisances, categories of population, time, and space. To model data of urban building sites, we have used a star schema represented by Figure 2. It is actually a schema of a spatiotemporal data warehouse, since space and time dimensions with hierarchies (for sink of simplicity, we omit the detail of dimension attributes in the figure). To represent it, we use the graphical formalisms proposed by (Malinovski, 2008). We have defined a fact table Annoyance. Thus, data from
Annoyance table are analysed according to the dimensions:
Nuisances, Categories of population, Time, and Space.
Measures associated with the Annoyance fact table are: degree of annoyance, and population density.
Figure 2. Multidimensional data model of annoyance
In the current model, we are faced to two problems:
1. The model expert used to evaluate degree of annoyance provides a qualitative crisp values. Thus, this model does not capture the imprecision inherent to this measure.
2. The fusion of measures: Indeed, the managers of public spaces are interesting by the analysis of the impact of annoyance. This measure is derived from degree of annoyance, which is qualitative measure, and population density, which is numerical one. We recall that degree of annoyance is the annoyance level of an individual type representing a given category of population. Thus we define the impact of annoyance as the overall level of annoyance of a given category of population, taking into account the density of this category.
For the second problem, we propose to use the fuzzy fusion approach which is based on the fuzzy inference.
3.2 Fuzzy Data Model
In this section, we present the proposed data model focusing of the imprecise qualitative measures. This model is based on the fuzzy theory introduced by Zadeh (Zadeh, 1975). This choice is justified by:
1. Fuzzy theory offer techniques that allow to model imprecise or vague knowledge that very few other methodologies allow;
2. It is the only way to treat in the same part of the knowledge provided digitally (by instruments) and knowledge expressed symbolically (by a human observer).
The model that we propose to represent imprecise measures is based on the concept of linguistic variable introduced in (Zadeh, 1975).
Definition 2. A linguistic variable is a 3-tuple (N, X, TL), where N= a symbolic variable defined of X
X = universe of discourse
TL = {A0, A1… An} a set of labels (terms linguistics). Each label corresponds to a fuzzy set represented by a trapezoidal membership function.
Let be an imprecise value of type . We write and we use the following general form to represent it:
( )
Where is the membership degree of to the fuzzy set For sink of simplicity, we can write .
3.2.1 Application
Representation of Degree of Annoyance:
To represent degree of annoyance measure, we propose to use the following linguistic variable: where is the name of the variable.
the universe of discourse.
a set
of labels represented by the trapezoidal fuzzy sets shown by figure 3 below. In the interests of simplifying notations, we will represent these terms respectively by
Figure 3. Fuzzy representation of degree of annoyance measure
Let be an imprecise value of type . We use the following form to represent it:
( )
Representation of Population Density:
To represent population density measure, we use the following linguistic variable:
Where
is the name of the variable. the universe of discourse.
a set of labels represented by
the trapezoidal fuzzy sets as it is shown by figure 4 below. In the interests of simplifying notations, we will represent these terms respectively by
Figure 4. Fuzzy representation of population density measure
Let be an imprecise value of type . We use the following general form to represent it:
( )
Representation of Impact of Annoyance:
To represent the impact of annoyance, which is the output of the combination process of impact of annoyance and population density, we use the following linguistic variable:
Where
: is the name of the variable. : The universe of discourse.
For sink of simplify, we will represent these terms respectively by .
Let be an imprecise value of type . We use the following form to represent it:
( )
3.3 Fuzzy fusion
The model of fuzzy fusion that we propose allows the combination of qualitative and quantitative measures. This model is based on the fuzzy inference. Based on the works of (Siler, 2005; Zadah, 1975; Feng, 2010) we will examine its different components.
3.3.1 Fuzzy rule of inference: Fuzzy inference can describe the relationship between the causative and resultant variables in terms of a collection of “IF-THEN” fuzzy rules. Each fuzzy IF-THEN rule can take the following general form:
This rule corresponds to the general statement and can be presented in the form of predicates (using the notation presented in section 3.2) as follow:
Where , and are three linguistic variables, for which it is associated respectively the fuzzy sets , and .
And the objective is to compute the conclusion given the
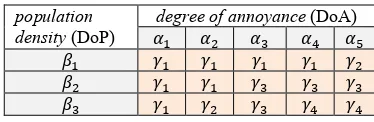
is a fuzzy relation. Note that there are different approaches to calculate the relation (Siler 2005). In our case, this relation has been established by the experts in the form of table (see tables 3 below for example).
: is a max–min or product-sum composition. annoyance is evaluated by combining population density and
degree of annoyance.
Table 3. Table used to represent the fuzzy relation R
A simply representation of the relation R can be a binary relation given by the matrix bellow.
Thus using max-min composition we obtain:
So in fuzzy set form
3.4 Implementation of fuzzy fusion in data warehouse
We have implemented fuzzy fusion as stocked procedure. This function is used to calculate the derived measure impact of annoyance.
Procedure Fuzzy-Fusion (x, y, Op1, Op2) Input:
x, y are two values of imprecise nature // for instance:
population density and typical individual annoyance. Op1: the premises combination.
4 SPATIAL DECISION SUPPORT SYSTEM OF ANNOYANCE ANALYSIS
Our objective is to assess the feasibility, the effectiveness, and the expressivity of our model within an off-the-shelf DBMS. Most modern DBMSs allow the extensibility of their typing system and/or functions. Our choice was Microsoft SQL/Server. We show that using user defined aggregates allows us developing our model. It can be used in any SQL query. The only limitation is that those functions cannot be used in the SSAS OLAP tool for interactive analysis of the multidimensional model.
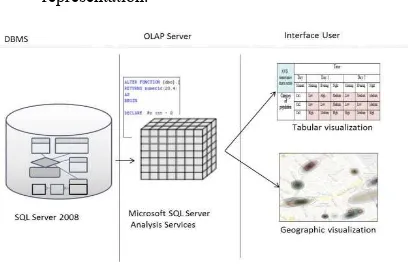
The global architecture of this system consists of three main components:
1. The database management system (DBMS) for managing the fact and dimensions tables of annoyance 2. OLAP server for the multidimensional analysis of
annoyance, that consists of multidimensional data cubes constructing and exploitation;
3. User interface allows visualizing the annoyance aggregation data using tabular or cartographic representation.
Figure 5. System architecture
5 CONCLUSION AND FUTURE WORK
The main objective of this work is the extension of conventional data warehouses to allow the integration and processing of both qualitative and quantitative measures. Based on computing with words methodology, we had, in a previous work (Amanzougarene, 2012), introduced qualitative measures and aggregates as an extension of multidimensional data model of a data warehouse. Using these measures and aggregates, OLAP queries allow the decision maker to manipulate data in a qualitative fashion using linguistic terms. This paper has proposed an extension to deal with fuzzy data model which is in intermediary solution between conventional numeric measures and crisp qualitative. To illustrate our proposal, we have considered the case of urban building sites annoyance. We have proposed an original approach which allows managing the annoyance and its inherent imprecision, as in commons sense reasoning, by using linguistic expressions. In our future work, we will extend our approach of evaluation in order to include spatial and temporal extent of annoyance as measures in the multidimensional data model of data warehouse. We will also, define aggregation operations allowing data processing of these extents (e.g. fusion of annoyance influence areas, and concatenation of exposure time interval). Indeed, that will improve the decisions of managers of public spaces concerning urban building sites planning. So far, we have focused on the measurement and aggregation in a qualitative fashion for the annoyance from previous inputs. We also intend to extend our
approach to the prediction of annoyance, so that it helps predict the best place and time for new building site.
REFERENCES
Amanzougarene, F., Chachoua, M., Zeitouni, K., 2012. Qualitative representation of building sites annoyance. In Proceedings of the 2012 ACM workshop on City data management workshop, pp. 13-20.
Burdick, D., Deshpande, P. M., Jayram, T. S., Ramakrishnan, R., Vaithyanathan, S., 2007. OLAP over uncertain and imprecise data. The VLDB Journal, 16(1), pp. 123-144.
Delgado, M., Molina, C., Ariza, L. R., Sánchez, D., Miranda M. A. V., 2007. F-Cube Factory: a fuzzy OLAP system for supporting imprecision. International Journal of Uncertainty, Fuzziness and Knowledge-Based Systems (IJUFKS), pp. 59-81.
Feng, F., Li, Y., Li, C., Han, B., 2010. Soft Set Based Approximate Reasoning: A Quantitative Logic Approach. Springer Berlin Heidelberg, pp. 245-255.
Guski, R. & Felscher-suhr U. 1999. The concept of noise annoyance: how international experts see it. Journal of Sound and Vibration 223(4): 513-527.
Inmon, W. H., 2005. Building the Data Warehouse, 4th Edition. John Wiley & Sons, Inc., New York, NY, USA.
Kimball, R., Ross, M., 2002. The Data Warehouse Toolkit: The Complete Guide to Dimensional Modeling, 2nd. John Wiley & Sons, Inc., New York, NY, USA.
Laurent, A., 2001. Generating Fuzzy Summaries from Fuzzy Multidimensional Databases. In Proceedings of the 4th International Conference on Advances in Intelligent Data Analysis, pp. 24-33.
Malinowski, E., Zimányi, E., 2008. Advanced Data Warehouse Design: From Conventional to Spatial and Temporal Applications. Springer-Verlag.
Molina, C., Rodríguez-Ariza, L., Sánchez, D., Vila, M. A., 2006. A new fuzzy multidimensional model. IEEE Transactions On Fuzzy Systems, 14(6), pp. 987-912.
Moser, G., Robin, M., 2006. Environmental annoyances: an urban-specific threat to quality of life? European review of applied psychology, 56(1), pp. 35-41.
Nordin, S., Lidén, E., 2006. Environmental odor annoyance from air pollution from steel industry and bio-fuel processing.
Journal of Environmental Psychology, 26(2), pp. 141-145.
Robin, M., Matheau-Police, A., Couty, C., 2007. Development of a scale of perceived environmental annoyances in urban settings. Journal of Environmental Psychology, 27(1), pp. 55-68.
Siler, W., Buckeley, J., 2005. Fuzzy Expert Systems and Fuzzy Reasoning. John Wiley & Sons, Inc., Hoboken, NJ, USA.
Yager, R. R., 2007. Aggregation of ordinal information. Fuzzy Optimization and Decision Making, 6(3), pp. 199-219.
Zadeh, L. A., 1975. The concept of a linguistic variable and its application to approximate reasoning. Information Sciences,