FEATURE EVALUATION FOR BUILDING FACADE IMAGES — AN EMPIRICAL STUDY
Michael Ying Yanga, Wolfgang F¨orstnerb, Dengfeng Chaic
a
Institute for Information Processing (TNT), Leibniz University Hannover b
Department of Photogrammetry, Institute of Geodesy and Geoinformation, University of Bonn c
Institute of Spatial Information Technique, Department of Earth Science, Zhejiang University yang@tnt.uni-hannover.de, wf@ipb.uni-bonn.de, chaidf@cad.zju.edu.cn
Working Groups ICWG III/VII
KEY WORDS:Feature, evaluation, random decision forest, facade image
ABSTRACT:
The classification of building facade images is a challenging problem that receives a great deal of attention in the photogrammetry community. Image classification is critically dependent on the features. In this paper, we perform an empirical feature evaluation task for building facade images. Feature sets we choose are basic features, color features, histogram features, Peucker features, texture features, and SIFT features. We present an approach for region-wise labeling using an efficient randomized decision forest classifier and local features. We conduct our experiments with building facade image classification on the eTRIMS dataset, where our focus is the object classesbuilding,car,door,pavement,road,sky,vegetation, andwindow.
1 INTRODUCTION
Despite the substantial advances made during the past decade, the classification of building facade images remains a challenging problem that receives a great deal of attention in the photogram-metry community (Rottensteiner et al., 2007; Korˇc and F¨orstner, 2008; Fr¨ohlich et al., 2010; Kluckner and Bischof, 2010; Teboul et al., 2010). Image classification is critically dependent on the features. Typical feature evaluation can be divided into two stages. First, image processing is used to extract a set of robust features that implicitly contains the information needed to make class-specific decisions while resisting extraneous effects such as chang-ing object appearance, pose, illumination and background clutter. Second, a machine learning based classifier uses the features to make region-level decisions, often followed by post-processing to merge nearby decisions. Instead of using some unsupervised techniques, which bare generalization problem, it is popular way that the classifier is trained using a set of labeled training ex-amples. The overall performance depends critically on all three elements: the feature set, the classifier & learning method, and the training set. In this paper, we focus on evaluating different feature sets.
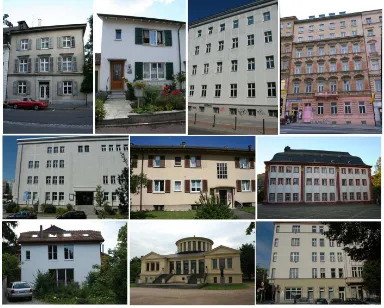
Korˇc and F¨orstner (2009) published an image dataset showing urban buildings in their environment. It allows benchmarking of facade image classification, and therefore the repeatable compar-ison of different approaches. Most of the images of this data set show facades in Switzerland and Germany. Regarding terrestrial facade images, the most dominant objects are the building itself, the window, vegetation, and the sky. Fig. 1 demonstrates the vari-ability of the object data.
In this work, we empirically investigate extended feature sets on eTRIMS dataset (Korˇc and F¨orstner, 2009). We show random forest gives some reasonable classification results on building fa-cade images, and evaluate classification results by counting cor-rected labeled regions. The remainder of the paper is organized as follow. Section 2 reviews some existing methods for feature evaluation and building facade image classification. Then, we in-troduce feature sets for evaluation in the scope of the paper in Section 3. Randomized decision forest classifier for performing image classification is described in Section 4. In Section 5, we
Figure 1: Example images from benchmark data set (Korˇc and F¨orstner, 2009).
show our results and discuss the effect of each feature sets with respect to the classification of facade images. We finally conclude with a brief summary in Section 6.
2 RELATED WORKS
whole system, even with optimizations such as kd-trees, or hier-archical clusters (Nister and Stewenius, 2006).
Support vector machine (SVM) is widely considered as a good classifier. Schnitzspan et al. (2008) propose hierarchical sup-port vector random fields that SVM is used as a classifier for unary potentials in conditional random field framework. While the training and cross-validation steps in SVM are time consum-ing, randomized decision forest (RDF) (Breiman, 2001) is intro-duced to significantly speed up the learning and prediction pro-cess. Existing work has shown the power of a randomized deci-sion forest as a classifier (Bosch et al., 2007; Lepetit et al., 2005; Maree et al., 2005). The use of a randomized decision forest for semantic segmentation was previously investigated in Shot-ton et al. (2008); Dumont et al. (2009); Fr¨ohlich et al. (2010). These approaches utilize simple color histogram features or pixel differences. Fr¨ohlich et al. (2010) present an approach using an randomized decision forest and local opponent-SIFT features (van de Sande et al., 2010) for pixelwise labeling of facade im-ages. Teboul et al. (2010) perform multi-class facade segmen-tation by combining a machine learning approach with procedu-ral modeling as a shape prior. Generic shape grammars are con-strained so as to express buildings only. Randomized forests are used to determine a relationship between the semantic elements of the grammar and the observed image support. Drauschke and Mayer (2010) also use random forest as one of the classifiers to evaluate the potential of seven texture filter banks for the pixel-based classification of terrestrial facade images.
3 FEATURE SETS
Features contains the information needed to make the class-specific decisions while being highly invariant with respect to extrane-ous effects such as changing object appearance, pose, illumi-nation and background clutter. Advances in feature sets have been a constant source of progress over the past decade. Sev-eral well-engineered features have been experimentally found to be well fit for image classification task (Drauschke and Mayer, 2010). In this work, we derive6feature sets from each region obtained from some unsupervised segmentation algorithms, such as mean shift (Comaniciu and Meer, 2002), watershed (Vincent and Soille, 1991), or graph-based method (Felzenszwalb and Hut-tenlocher, 2004).
Basic featuresf1 First feature setf1are basic features
includ-ing (1). number of components of the region (C); (2). number of holes of the region (H); (3). Euler characteristic for planar fig-ures (Lakatos, 1976) (E=C−H); (4). area (A); (5). perimeter (U); (6). form factor (F =U2
/(4πA)); (7). height of bounding box; (8). width of bounding box; (9). area ratio between region and its bounding box; (10). height portion of center; (11). width portion of center.
Color featuresf2 For representing spectral information of the
region, we use 9 color features (Barnard et al., 2003) as second feature setf2: the mean and the standard deviation of R-channel,
G-channel and B-channel respectively in the RGB color space; and the mean of H-channel, S-channel and V-channel respectively in the HSV color space.
Histogram featuresf3 We also include features derived from
the gradient histograms as third feature setf3, which has been
proposed by Korˇc and F¨orstner (2008). We determine gradient and its orientation and its magnitude. The histograms are de-termined for the 3 colors R, G and B respectively in the region. Then, we derive the mean, the variance and the entropy from each histogram as features.
Peucker featuresf4 Peucker features are derived from
gen-eralization of the region’s border as fourth feature setf4, and
represent parallelity or orthogonality of the border segments. We select the four points of the boundary which are farthest away from each other. From this polygon region with four corners, we derive 3 central moments, and eigenvalues in direction of major and minor axis, aspect ratio of eigenvalues, orientation of poly-gon region, coverage of polypoly-gon region, and 4 angles of polypoly-gon region boundary points.
Texture featuresf5 We use texture features derived from the
Walsh transform (Petrou and Bosdogianni, 1999; Lazaridis and Petrou, 2006) as fifth feature setf5, as features from Walsh
fil-ters are among the best texture features from the filter banks (Drauschke and Mayer, 2010). We determine the magnitude of the response of9Walsh filters. For each of the9filters, we deter-mine mean and standard deviation for each region.
SIFT featuresf6 Sixth feature setf6are mean SIFT
(Scale-Invariant Feature Transform) descriptors (Lowe, 2004) of the im-age region. SIFT descriptors are extracted for each pixel of the region at a fixed scale and orientation, which is practically the same as the HOG descriptor (Dalal and Triggs, 2005), using the fast SIFT framework in Vedaldi and Fulkerson (2008). The ex-tracted descriptors are then averaged into onel1-normalized
de-scriptor vector for each region.
These features are roughly listed in Table 1. The resulting178
features are then concatenated into one feature vector.
Table 1: List of derived features from image regions. The number indicates feature numbers in each feature set.
f1basic features (11)
region area and perimeter, compactness and aspect ratio, etc. f2color features (9)
mean and standard deviation of RGB and HSV spaces f3histogram features (9)
mean, variance and entropy of histogram from the gradients f4Peucker features (12)
moments and eigenvalues of a region f5texture features (18)
texture features derived from the Walsh transform f6SIFT features (128)
mean SIFT descriptor features
4 RANDOMIZED DECISION FOREST
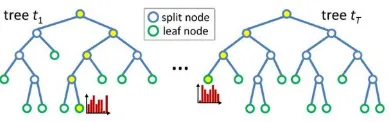
Features are evaluated by a classifier which operates on the re-gions defined by unsupervised segmentation. we take random-ized decision forest (RDF) (Breiman, 2001) as the classifier for performing feature evaluation, where the derived features from the image regions for the RDF classifier are chosen from Table 1. Existing work has shown the power of decision forests as the clas-sifiers (Maree et al., 2005; Lepetit et al., 2005; Bosch et al., 2007). As illustrated in Fig. 2, a RDF is an ensemble classifier that con-sists ofTdecision trees (Shotton et al., 2008). The feature vector of image region is classified by going down each tree. This pro-cess gives a class distribution at the leaf nodes and also a path for each tree. The class distribution is obtained by averaging the class distribution over the leaf nodes for allTtrees. This classification procedure is identical to Shotton et al. (2008).
Figure 2:Decision forest. A forest consists ofT decision trees. A feature vector is classified by descending each tree. This gives, for each tree, a path from root to leaf, and a class distribution at the leaf. As an illustration, we highlight the root to leaf paths (yellow) and class distributions (red) for one input feature vector. (Figure courtesy by Jamie Shotton (Shotton et al., 2008).)
labels. Then a RDF is trained on the labeled data for each of the classes. According to a decision tree learning algorithm, a decision tree recursively splits left or right down the tree to a leaf node. We use the extremely randomized trees (Geurts et al., 2006) as learning algorithm. Each tree is trained separately on a small random subset of the training data. The learning procedure is identical to Shotton et al. (2008). We refer the reader to Shotton et al. (2008) for more details.
5 EXPERIMENTAL RESULTS
We conduct experiments to evaluate the performance of differ-ent image feature sets on the eTRIMS 8-class dataset (Korˇc and F¨orstner, 2009). In the experiments, we take the ground-truth la-bel of a region to be the majority vote of the ground-truth pixel labels. We randomly divide the images into training and test data sets.
5.1 Experimental Setup
We start with the eTRIMS 8-class dataset which is a comprehen-sive and complex dataset consisting of 60 building facade images, mainly taken from Basel, Berlin, Bonn, and Heidelberg, labeled with 8 classes:building,car,door,pavement,road,sky, vegeta-tion,window. These classes are typical objects which can appear in images of building facades. The ground-truth labeling is ap-proximate (with foreground labels often overlapping background objects). In the experiments, we randomly divide the images into a training set with 40 images and a testing set with 20 images.
Features are evaluated by the RDF classifier which operates on the regions defined by unsupervised segmentation. Therefore, the initial unsupervised segmentation algorithms may play an impor-tant role in the final classification results. To test how much the influence of the segmentation algorithms would be, we employ two unsupervised segmentation methods to segment the facade images, namely the mean shift algorithm (Comaniciu and Meer, 2002) and the watershed algorithm (Vincent and Soille, 1991).
First, we segment the facade images using mean shift algorithm (Comaniciu and Meer, 2002), tuned to give approximately 480 regions per image. In all 60 images, we extract around 29 600 regions. We have following statistics. Compared to the ground truth labelling, almost 36% of all the segmented regions get the class labelbuilding. 26% of all regions get the class label win-dow. These statistics are very comprehensive, because facade images show buildings typically contain many windows. Fur-thermore, 21% of the regions get the class labelvegetation, and 2% belong tosky, and the last 15% of the regions are spread over
most of other classes. Table 2 summarizes the statistics for the percentage of each class label, the average size of the region of each class, and the percentage of the image covered by each class for the baseline mean shift segmentation on the eTRIMS 8-class dataset (Korˇc and F¨orstner, 2009).
Table 2: Statistics of the percentage of each class label, the av-erage size of the region of each class, and the percentage of the image covered by each class for the baseline mean shift segmen-tation on the eTRIMS 8-class dataset. (b =building, c =car, d =
door, p =pavement, r =road, s =sky, v =vegetation, w =window, same for all the following tables and figures.)
Mean shift
b c d p r s v w
class percentage 36 5 2 2 2 2 21 26
average size of region 1014 424 569 1671 2563 6741 380 310 class covering percentage 48 3 1 4 6 16 11 11
Then, we segment the images using watershed algorithm (Vin-cent and Soille, 1991), which turns out to give approximately 900 regions per image. In all 60 images, we extract around 56 000 regions. We have following statistics. Almost 34% of all the segmented regions get the class labelbuilding. 28% of all regions get the class labelwindow. Furthermore, 23% of the regions get the class labelvegetation, 2% belong tosky, and the last 13% of the regions are spread over most of other classes. Table 3 sum-marizes the statistics for the percentage of each class label, the average size of the region of each class, and the percentage of the image covered by each class for the baseline watershed segmen-tation on the eTRIMS 8-class dataset (Korˇc and F¨orstner, 2009).
Table 3: Statistics of the percentage of each class label, the av-erage size of the region of each class, and the percentage of the image covered by each class for the baseline watershed segmen-tation on the eTRIMS 8-class dataset.
Watershed
b c d p r s v w
class percentage 34 4 1 2 2 2 23 28
average size of region 614 268 477 684 1490 4096 209 152 class covering percentage 49 3 1 4 6 16 11 10
5.2 Evaluation with mean shift segmentation and RDF clas-sifier
In the following, we first evaluate with RDF classifier on each feature setf1,f2,f3,f4,f5, andf6. Then, we evaluate with
RDF classifier on the combination of feature sets, and show that RDF gives some reasonable results on building facade images.
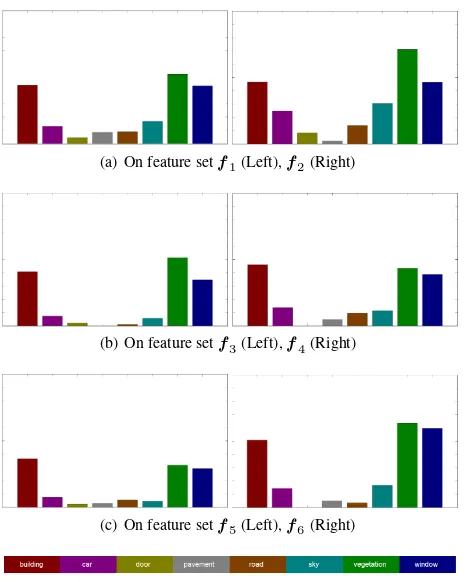
The overall classification accuracy is listed in Table 4, when ap-plying RDF classifier on each feature set. The number of decision trees is chosen asT = 250. In all the following experiments, we always assume maximum depth of each decision treeD = 7. A random classifier for 8 classes, the expected classification ac-curacy is 12.5%. Fig. 3 shows the corresponding classification results over all 8 classes. Each class is normalized to 100%.
Table 4: Average accuracy of RDF classifier on each feature set of eTRIMS 8-class dataset.
feature set f1 f2 f3 f4 f5 f6
(a) On feature setf1(Left),f2(Right)
(b) On feature setf3(Left),f4(Right)
(c) On feature setf5(Left),f6(Right)
Figure 3:Accuracy of each classon each feature set, with each class is normalized to 100.
Table 5: Average accuracy of RDF classifier on the feature sets. Feature sets−fimean the rest of all 6 feature sets exceptfiis used,i= 1,· · ·,6.
feature sets −f1 −f2 −f3 −f4 −f5 −f6
accuracy 58.1% 57.2% 58.8% 58.1% 58.3% 53.0%
From Fig. 3, we observe that each feature set performs reason-able results onbuilding,window, andvegetationclasses. Color featuresf2perform better than other features onvegetationclass
because most vegetation parts are homogeneous regions. For other classes, each feature set performs not good. Relatively, Peucker featuresf4perform better than other feature sets on
mi-nor classes. SIFT featuresf6 perform better than other features
on average.
We also make the experiments using leave-one-out method. The overall classification accuracy is listed in Table 5. Feature sets −fimean the rest of all 6 feature sets exceptfi is used,i =
1,· · ·,6. The number of decision trees is chosen asT = 250.
In the following, we make use of all the feature setsf1,f2,f3,
f4,f5, andf6. We run experiments 5 times, and obtain overall
averaging classification accuracy 58.8%. The number of decision trees is also chosen asT = 250. Fig. 4Leftshows the classifi-cation results over all 8 classes. The classificlassifi-cation accuracy with respect to numbers of decision treesT for training are shown in Fig. 4Right. While increasing the number of decision trees, the classification accuracy also increases. After 250 iteration, the accuracy converges. So we chooseT = 250for performing ex-periments above.
Fig. 5 and Fig. 6 present some result images of RDF method. The black regions in all the result images and ground truth images cor-respond to background. The qualitative inspection of the results
Figure 4: The classification accuracy of each class of the RDF classifier with mean shift and the accuracy with respect to the numbers of the decision trees.Left: the classification accuracy of each class on all feature sets. Right: the classification accuracy with respect to the numbers of the decision trees for training.
Table 6: Accuracy of RDF classifier with the mean shift seg-mentation on the eTRIMS 8-class dataset. The confusion ma-trix shows the classification accuracy for each class (rows) and is row-normalized to sum to 100%. Row labels indicate the true class (Tr), and column labels the predicted class (Pr).
❍ ❍
❍ ❍❍ Pr
Tr
b c d p r s v w
b 60 8 2 2 2 1 9 16
c 22 40 1 3 1 2 29 2
d 46 0 15 0 0 0 8 31
p 40 16 0 12 4 4 16 8
r 40 20 0 14 23 3 0 0
s 29 2 0 5 2 48 7 7
v 11 5 1 1 1 0 76 5
w 24 1 2 0 0 1 4 68
in Fig. 5 shows that RDF classifier yields good results. In Fig. 6, there exists some misclassification for each class. For example, the incorrect results at windows are often due to the reflectance of vegetation and sky in the window panes. Most sky regions are classified correctly. However, sky region is assigned labelcarin one image (last row in Fig. 6). This can be resolved simply by in-troducing some kind of spatial prior (Gould et al., 2008), such as
skyis above thebuilding,roadandpavementare below the build-ing,caris above theroad, andwindowis surrounded bybuilding.
A full confusion matrix summarizing RDF classification results over all 8 classes is given in Table 6, showing the performance of this method.
5.3 Evaluation with watershed segmentation and RDF clas-sifier
To test whether the classification result mainly benefits from the mean shift segmentation method, and not from the feature sets we use, we also employ another unsupervised segmentation method, namely the watershed algorithm by Vincent and Soille (1991), to segment the facade images.
The overall classification accuracy is 55.4%, with the RDF clas-sifier on all the feature sets and the number of the decision trees chosen asT = 250. The confusion matrix is given in Table 7.
Figure 5: Qualitative classification results of a RDF classifier with the mean shift on the testing images from the eTRIMS dataset. (Left: test image,middle: result,right: ground truth.)
Figure 6: Some more classification results of a RDF classifier with the mean shift on the testing images from the eTRIMS dataset. (Left: test image,middle: result,right: ground truth.)
Table 7: Pixelwise accuracy of the image classificationusing the RDF classifier and the watershed segmentation on the eTRIMS 8-class dataset. The confusion matrix shows the classification accuracy for each class (rows) and is row-normalized to sum to 100%. Row labels indicate the true class (Tr), and column labels the predicted class (Pr).
❍ ❍
❍ ❍❍ Pr
Tr
b c d p r s v w
b 59 4 1 3 5 9 11 7
c 67 21 0 5 2 0 3 2
d 19 0 12 0 0 0 62 7
p 57 3 0 9 30 0 0 1
r 14 1 0 58 23 1 3 1
s 17 0 0 6 0 73 2 1
v 13 4 1 2 1 13 61 4
w 29 1 1 1 0 6 3 57
5.4 Discussion
With respect to the three most important classesbuilding, win-dow, andvegetation, we are satisfied with our classification re-sults. But our multi-class approach does not perform very well for most of the other classes. Our classification scheme is faced with a dramatic inequality between the sizes of the classes. Al-most 60% of the data is covered by only 2 classes, and the rest is spread over the rest classes. And for the classes likecaranddoor, Gestalt features (Bileschi and Wolf, 2007) may play major role in a good classification performance. We also believe symmetry and repetition features are vital for classifyingwindowclass.
In this paper, features are extracted at local scale. Classification results are achieved from bottom up on these local features by classifiers. This factor leads to noisy boundaries in the example images. To enforce consistency, a Markov or conditional ran-dom field (Shotton et al., 2006) is often introduced for refinement, which would likely improve the performance.
6 CONCLUSIONS
We evaluate the performance of seven feature sets with respect to region-based classification of facade images. The feature sets include basic features, color features, histogram features, Peucker features, texture features, and SIFT features. We use randomized decision forest (RDF) to perform the classification scheme. In our experiments on the eTRIMS dataset (Korˇc and F¨orstner, 2009), we have shown that RDF produces some reasonable classification results.
The results show that these features and a local classifier are not sufficient. In order to recover more precise boundaries, the work presented in this paper has been fused into conditional random field framework (Yang and F¨orstner, 2011) by including neigh-boring region information in the pairwise potential of the model, which allows us to reduce misclassification that occurs near the edges of objects. As future work, we are interested in evaluat-ing more features, such as Gestalt features (Bileschi and Wolf, 2007) and other descriptor features (van de Sande et al., 2010), for building facade images.
References
Bileschi, S. and Wolf, L., 2007. Image representations beyond histograms of gradients: The role of gestalt descriptors. In: IEEE Conference on Computer Vision and Pattern Recogni-tion, pp. 1–8.
Bosch, A., Zisserman, A. and Mu˜noz, X., 2007. Image classifi-cation using random forests and ferns. In: IEEE International Conference on Computer Vision, pp. 1–8.
Breiman, L., 2001. Random forests. Machine Learning 45(1), pp. 5–32.
Comaniciu, D. and Meer, P., 2002. Mean shift: A robust approach toward feature space analysis. IEEE Transactions on Pattern Analysis and Machine Intelligence 24(5), pp. 603–619.
Dalal, N. and Triggs, B., 2005. Histograms of oriented gradi-ents for human detection. In: IEEE Conference on Computer Vision and Pattern Recognition, pp. 886–893.
Drauschke, M. and F¨orstner, W., 2008. Selecting appropriate features for detecting buildings and building parts. In: Pro-ceeding of the 21st Congress of the International Society for Photogrammetry and Remote Sensing (ISPRS), pp. 447–452.
Drauschke, M. and Mayer, H., 2010. Evaluation of texture en-ergies for classification of facade images. In: ISPRS Techni-cal Commission III Symposium on Photogrammetry Computer Vision and Image Analysis, pp. 257–262.
Dumont, M., Mar´ee, R., Wehenkel, L. and Geurts, P., 2009. Fast multi-class image annotation with random subwindows and multiple output randomized trees. In: International Confer-ence on Computer Vision Theory and Applications (VISAPP), Vol. 2, pp. 196–203.
Felzenszwalb, P. F. and Huttenlocher, D. P., 2004. Efficient graph-based image segmentation. International Journal of Computer Vision 59(2), pp. 167–181.
Fr¨ohlich, B., Rodner, E. and Denzler, J., 2010. A fast approach for pixelwise labeling of facade images. In: International Con-ference on Pattern Recognition, pp. 3029–3032.
Geurts, P., Ernst, D. and Wehenkel, L., 2006. Extremely random-ized trees. Machine Learning 63(1), pp. 3–42.
Gould, S., Rodgers, J., Cohen, D., Elidan, G. and Koller, D., 2008. Multi-class segmentation with relative location prior. International Journal of Computer Vision 80(3), pp. 300–316.
Kluckner, S. and Bischof, H., 2010. Image-based building classi-fication and 3d modeling with super-pixels. In: ISPRS Techni-cal Commission III Symposium on Photogrammetry Computer Vision and Image Analysis, pp. 233–238.
Korˇc, F. and F¨orstner, W., 2008. Interpreting terrestrial images of urban scenes using discriminative random fields. In: Pro-ceeding of the 21st Congress of the International Society for Photogrammetry and Remote Sensing (ISPRS), pp. 291–296.
Korˇc, F. and F¨orstner, W., 2009. eTRIMS image database for in-terpreting images of man-made scenes. Technical Report TR-IGG-P-2009-01.
Kumar, S. and Hebert, M., 2003. Discriminative random fields: a discriminative framework for contextual interaction in clas-sification. In: IEEE International Conference on Computer Vision, pp. 1150–1157.
Lakatos, I., 1976. Proofs and Refutations. Cambridge: Cam-bridge University Press.
Lazaridis, G. and Petrou, M., 2006. Image registration using the Walsh transform. IEEE Transactions on Image Processing 15(8), pp. 2343–2357.
Lepetit, V., Lagger, P. and Fua, P., 2005. Randomized trees for real-time keypoint recognition. In: IEEE Conference on Com-puter Vision and Pattern Recognition, pp. 775–781.
Lowe, D., 2004. Distinctive image features from scale-invariant keypoints. International Journal of Computer Vision 60(2), pp. 91–110.
Maree, R., Geurts, P., Piater, J. and Wehenkel, L., 2005. Random subwindows for robust image classification. In: IEEE Confer-ence on Computer Vision and Pattern Recognition, pp. 34–40.
Nister, D. and Stewenius, H., 2006. Scalable recognition with a vocabulary tree. In: IEEE Conference on Computer Vision and Pattern Recognition, pp. 2161–2168.
Petrou, M. and Bosdogianni, P., 1999. Image Processing: The Fundamentals. Wiley.
Rottensteiner, F., Trinder, J., Clode, S. and Kubik, K., 2007. Building detection by fusion of airborne laser scanner data and multi-spectral images: Performance evaluation and sensitivity analysis. ISPRS Journal of Photogrammetry and Remote Sens-ing 62(2), pp. 135–149.
Schnitzspan, P., Fritz, M. and Schiele, B., 2008. Hierarchical support vector random fields: joint training to combine local and global features. In: European Conference on Computer Vision, Part II, pp. 527–540.
Shotton, J., Johnson, M. and Cipolla, R., 2008. Semantic tex-ton forests for image categorization and segmentation. In: IEEE Conference on Computer Vision and Pattern Recogni-tion, pp. 1–8.
Shotton, J., Winnand, J., Rother, C. and Criminisi, A., 2006. Tex-tonboost: joint appearance, shape and context modeling for multi-class object recognition and segmentation. In: European Conference on Computer Vision, Part I, pp. 1–15.
Sivic, J., Russell, B. C., Efros, A. A., Zisserman, A. and Freeman, W. T., 2005. Discovering objects and their locations in images. In: IEEE International Conference on Computer Vision, pp. 1– 8.
Teboul, O., Simon, L., Koutsourakis, P. and Paragios, N., 2010. Segmentation of building facades using procedural shape pri-ors. In: IEEE Conference on Computer Vision and Pattern Recognition, pp. 3105–3112.
van de Sande, K. E. A., Gevers, T. and Snoek, C. G. M., 2010. Evaluating color descriptors for object and scene recognition. IEEE Transactions on Pattern Analysis and Machine Intelli-gence 32(9), pp. 1582–1596.
Vedaldi, A. and Fulkerson, B., 2008. Vlfeat: An open and portable library of computer vision algorithms. http://www.vlfeat.org/.
Verbeek, J. and Triggs, B., 2007. Region classification with markov field aspect models. In: IEEE Conference on Com-puter Vision and Pattern Recognition, pp. 1–8.
Vincent, L. and Soille, P., 1991. Watersheds in digital spaces: An efficient algorithm based on immersion simulations. IEEE Transactions on Pattern Analysis and Machine Intelligence 13(6), pp. 583–598.