GEOETRIM, SHARPQ AND EPIX: TRIO OF TOOLS FOR GEOSPATIAL IMAGE
ANALYSIS
H. Topan*, M. Özendi, A. Cam, M. Oruç
BEU, Engineering Faculty, Dept. of Geomatics Engineering, 67100, Zonguldak, Turkey ([email protected], [email protected], [email protected], [email protected])
KEY WORDS: GeoEtrim, GeoSpot, GeoFigcon, SharpQ, epix, Geospatial analysis,
ABSTRACT:
This paper presents an overview of three approachesdeveloped in Matlab for geospatial analysis of images. GeoEtrim has two sub-packages, GeoSpot and GeoFigcon. GeoSpot aims to perform bundle adjustment of stereo linear array remotely sensed images considering their interior and exterior orientation parameters. The correlation among orientation parameters, their validation and efficiency on the final accuracy can be estimated. The current version is available for SPOT-5 HRG level 1A stereoimages, reaching ±1 pixel accuracy at ICPs (Independent Check Points). GeoFigcon is the other sub-package of GeoEtrim, developed for estimation of georeferencing accuracy of orthoimages generated by various sensor-independent mathematical models and RFM (Rational Function Model). Using GeoFigcon, one can estimate the combined effect of the accuracy of transformation parameters estimated/updated by GCPs and DEM accuracy on the georeferencing accuracy of orthoimages. The experiments with IKONOS Geo, QuickBird OrthoReady Standard, OrbView-3 Basic and Pléiades-1A Primary prove that using RFM produces higher accuracy than using sensor-independent transformation models. Moreover, accuracy varies reducing from geometric centre of GCPs accommodating the high profile of topography. SharpQ generates pan-sharp images using the methods PCA (Principal Component Analysis), Brovey, and IHS (Intensity Hue Saturation), validates their quality with quantitative analysis by the methods CC (Correlation Coefficient), RMSE (Root Mean Square Error), RASE (Relative Average Spectral Error), SAM (Spectral Angle Mapper) and ERGAS (Erreur Relative Globale Adimensionnelle de Synthése). epix, the last member of the trio, can be used for estimation of effective GSD (Ground Sampling Distance) value of original or generated (such as pan-sharp) images, depending the principle of ESF (Edge Spread Function). So the real geometric resolution can be estimated for any kind of image. This trio is being still developed with the continuous research.
* Corresponding author.
1. INTRODUCTION
Image based technological development has a remarkable place in public life. Developments at technologies of computers, cell phones, tablets etc. focus on mainly visual presentation and many of optical image based applications requiring higher capacities in processor, memory and network connections etc. Although microwave and laser technologies made significant improvement in remote sensing, optical images have still wide range of application not only in the web based public applications (such as Google Earth, Bing Maps etc.) but also in remote sensing and image processing communities. Although the GSD (Ground Sampling Distance) of sensors as a metric of geometric resolution is considered in the case of geospatial applications, the revisit time (temporal resolution), spectral range and radiometric resolution helps in many other applications. For instance, SkySat-2, the last remote sensing satellite launched in 8th June 2014 acquires 90 cm panchromatic and 2 m VNIR (Visible and Near Infrared) images (SkyboxImaging, 2014).
Pre- and post-launch radiometric and geometric calibrations are mandatory since each sensor has its own characteristics. Even though the specifications of images are given in the brochures, the users should be sure for the real values. This means the images must be analysed to estimate the real potentials for the various applications. The basic analyses are 2D/3D georeferencing accuracy assessment, DSM/DEM (Digital Surface/Elevation Model) generation and validation, effective GSD estimation, pan-sharpened image generation and
validation, information content and feature extraction success etc. in the case of geospatial applications.
An agreement is not available on metadata distribution in remote sensing community. This means the image providers individually define their own metadata format. The metadata may include the information of interior and exterior orientation, radiometric and geometric calibration, processing level, acquisition date and time, sun elevation and azimuth etc. Commercial software must be able to import this data-format for the perfect evaluation using the special mathematical models developed for the related sensors. Developing and using such kind of special models is not useful for the commercial users. So a sensor-dependent mathematical model is being used since 1999 called RFM (Rational Functional Model). Usage of RFM was suggested by OGC (1999). Although RFM was preferred a general transformation model for USA origin studies (Dowman and Dolloff, 2000), its widely usage started by the IKONOS images. Today, RFM is the common georeferencing model for many images.
1.1. Geospatial Analysis in Zonguldak Test Field
topography. The readers can reach the publications about Zonguldak test site via FUKAL web (FUKAL, 2014).
Although some commercial and academic software was used at the beginning, some of researchers strive to develop special solutions. GeoEtrim, SharpQ and epix are being developed, and details and last improvements are given within this paper. All these tools are developed in Matlab environment.
2. GEOETRIM
GeoEtrim (Geospatial Evaluation and Training of Images) has two sub-packages, i.e. GeoSpot, GeoFigcon. Detailed information of GeoEtrim was presented at first in Topan (2011). This paper will cite the previous publications for the details, and just presents the developments since 2011.
2.1. GeoSpot
GeoSpot has been developed for the 3D georeferencing accuracy of SPOT-5 HRG level 1A images. The transformation model depends on a special physical model developed by Riazanoff (2004). This model was recoded incrementally in Matlab environment. The adjustment was performed in two stages, i.e. pre- and bundle adjustment. The pre-adjustment step was mandatory to adjust look angles since the final accuracy is sensitive to look angles. Details of the physical model, adjustment processes and results can be found in Topan (2009), Topan and Maktav (2010), Topan (2011), and Topan and Maktav (2014).
Owing to the fact that GeoSpot uses the transformation model developed by Riazanoff (2004), the first model was the version published in 2002. The change is that the vector between scanline and payload coordinate systems defined by in the version of 2002, which
was changed as . So the
functional model changes as below:
0 estimate the raw georeferencing accuracy using the approximate values of interior and exterior orientation parameters, the accuracy dramatically increases from ±140 km to ±1.1 km. After the first iteration, the accuracy reaches desired level.
The second and innovative development is that the correlations between interior and exterior orientation parameters are defined probably the first time via GeoSpot formulated as following:
A
correlation among interior and exterior orientation parameters. The correlation among interior and exterior orientation parameters are estimated no more than 22%, meaning that such amount of correlation can be ignored.
2.2. Overview and Future Plans for GeoSpot
The advantages of GeoSpot are that one can estimate the effects of accuracy of orientation parameters on 3D accuracy, considering the physical transformation model for SPOT-5 level 1A images, and the correlation between observations and unknowns are estimated, so any doubt caused by this correlation can be expected. The new trend is to acquire tri-stereo images in remote sensing. Since GeoSpot estimates 3D coordinates using just two stereo-images, the tool must be enhanced to consider more than two stereo-images. The current version can reach ±1 pixel (5 m) at check points. It is certain that the accuracy may rise in the future with some improvements that are not considered in the current version. For instance, using a collocation model which considers constrains among the parameters or different models other than 2nd order polynomial for modelling the parameters can be preferred. And GeoSpot might be modified for the next generation sisters, i.e. SPOT 6 and 7, which are both operational.
2.3. GeoFigcon
GeoFigcon (Geospatial Figure Condition Analysis) has been developed with the motivation of estimating the georeferencing accuracy of orthoimage. Since the orthoimage generation is a common and sometimes mandatory process for the mono image evaluation, the final georeferencing accuracy of product (i.e. orthoimage) must be estimated. This accuracy is under two main effects. They are accuracies of both updated transformation parameters and DEM (Digital Elevation Model).
Figure condition concept is a well-known issue in geodesy, and applied to the datum transformation by Kutoğlu (2004). The first application for georeferencing of remotely sensed images was carried out by Sertel et al. (2007) using 2D transformation models. Topan and Kutoglu (2009) apply 3D sensor-independent transformation model for IKONOS, QuickBird and OrbView-3 images. This session presents the developments in GeoFigcon since 2011.
As mentioned in the introduction, RFM is the general georeferencing model in remote sensing. GeoFigcon has been extended including the RFM solution because of its widely paper to avoid the repetition. However, brief information can be given as following:
b) Another requirement during working with the RPCs is bias compensation. GeoFigcon also compensate the bias effect using the method suggested by Teo (2011).
c) RPCs may have high correlation among each other, and the ordinary least square estimation may reach undesired accuracy. The ridge estimation is one of the solutions for this ill-posed problem. The result achieved by OrbView-3 was carried out using ridge estimation.
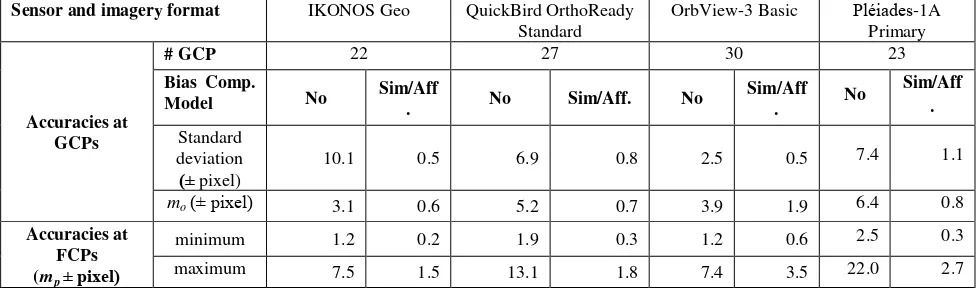
The results can be compared in Table 1. The standard deviation of Pléiades-1A image is higher than IKONOS, is almost equal to QuickBird, and is lower than OrbView-3. When the bias compensation is applied, the accuracy of compensation is in a lower level than others. The accuracies at GCPs and of FCPs are lower than of all when bias compensation is not applied. However, when the bias compensation is applied, the accuracy at GCPs and of figure condition accuracy are lower than IKONOS and QuickBird, and higher than OrbView-3. The geometrical instability of OrbView-3 images reported by (Büyüksalih, 2006) must be considered during interpretation of these results.
2.4. Overview and Future Plans for GeoFigcon
GeoFigcon depends on the variance-covariance propagation law, and can be applied on any transformation model. The current version can be used for mono images estimating the 2D accuracy. Nevertheless, the 3D georeferencing accuracy must be researched.
The accuracies defined by GeoFigcon must be checked producing the orthoimage, and obtaining the georeferenced coordinates comparing their ground truth. They are the future improvements planned.
3. SHARPQ
Optical based remote sensing satellites generally obtain both MS and PAN images covering same portion of the ground. While MS images provide high spectral resolution, their geometric resolution is always lower when compared with PAN images. In order to generate MS images with high geometric resolution using these images, pan-sharpening methods are developed. There are quite a few pan-sharpening methods in the literature and each of them has advantages and disadvantages. Today, research is still going on to develop the pan-sharpening method which reveals the most optimum results. Pan-sharpening is also called as image fusion on which both computer vision and digital image processing communities
conducting research. Pohl and Van Genderen (1998), (Karathanassi et al., 2007) and (Ehlers et al., 2010) have presented comprehensive literature review on pan-sharpening methods used for remote sensing.
While some image fusion methods aim to impress on spatial information, some others impress on the color information. Because of this fact, it has to be analyzed that which image fusion technique performs better on which image. In this context, quality of images generated by image fusion should be performed both visually and quantitatively (Klonus and Ehlers, 2009). Visual quality assessment is performed with help of an operator in terms of existence and completeness of objects (Laporterie-Déjean et al., 2005). Quantitative quality assessment can be performed by using statistical metrics (Alparone et al., 2007) By the help of these metrics, how the pan-sharpened image is consistent with original MS image and the spectral quality can be determined.
Some of the most preferred metrics utilized for quantitative assessment of pan-sharpened images can be listed as following:
3.1. CC (Correlation Coefficient)
This metric is well known from the statistics.The correlation between each band of images can be calculated easily and if required these values can be averaged for correlation of image itself.
(4)
At the above formula and are bands to be compared, and are average of bands and and values represent number of row and column. The value of correlation coefficient is bounded in [-1,+1]. As the correlation gets closer to +1 means image bands are close to each other, on the other hand if the correlation gets closer to -1 means bands are unsimilar to each other statistically (Ehlers et al., 2010).
3.2. RMSE (Root Mean Square Error)
This metric puts forward that how different two images are (Vijayaraj, 2004).
(5)
and means two images with dimensions
Sensor and imagery format IKONOS Geo QuickBird OrthoReady Standard
OrbView-3 Basic Pléiades-1A Primary
Accuracies at GCPs
# GCP 22 27 30 23
Bias Comp.
Model No Sim/Aff. No Sim/Aff. No Sim/Aff. No
Sim/Aff .
Standard deviation
(± pixel)
10.1 0.5 6.9 0.8 2.5 0.5 7.4 1.1
mo(± pixel) 3.1 0.6 5.2 0.7 3.9 1.9 6.4 0.8
Accuracies at FCPs (mp ± pixel)
minimum 1.2 0.2 1.9 0.3 1.2 0.6 2.5 0.3
maximum 7.5 1.5 13.1 1.8 7.4 3.5 22.0 2.7
3.3. RASE (Relative Average Spectral Error):
This metric uses average pixel value and RMSE values to present the success of image fusion method (Choi et al., 2005).
(6)
(7)
At the formula above, presents RMSE of band , is number of bands and is average of band . (Yıldırım and Gungor, 2012).
3.4. SAM (Spectral Angle Mapper)
SAM metric puts forward the absolute value of spectral angle between vectors and (Alparone et al., 2008).
(8)
This metric is generally in radians or degrees and if required SAM value of the entire image can be computed by averaging each SAM value of the image.
3.5. ERGAS (Erreur Relative Globale Adimensionnelle de
Synthése)
This metric gives idea about general quality of the sharpened image. Since it puts forward the defect at pan-sharpened image, this value is desired to be as small as possible (Alparone et al., 2008).
(9)
At the formula of ERGAS, means resolution ratio, number of bands and presents the band number. In case of this study .
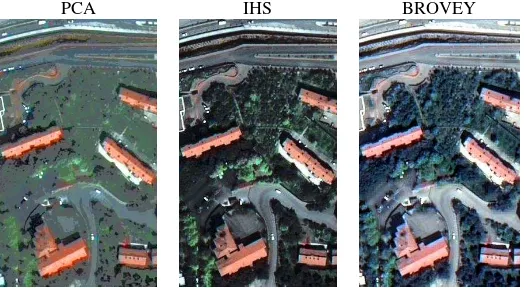
We developed a tool called SharpQ which is capable of generating pan-sharpened images using different methods and calculating the above quality metrics for each pan-sharpened image. SharpQ can generate pan-sharpened images using PCA (Principal Component Analysis), IHS (Intensity Hue Saturation) and Brovey transform, samples from generated pan-sharpened images are shown Figure 1 below.
PCA IHS BROVEY
Figure 1. Pan-sharpened images generated by various methods.
SharpQ is also capable of calculating CC, RASE, SAM, RMSE and ERGAS metrics. These metrics are calculated for each image tabulated in the Table 2. When calculating these metrics the original MS image is taken as reference and calculation are
performed between this image and each pan-sharpened image. The results are provided in the following table. At this table values are shown in three colors. Gray color presents the optimal results, that is, when two images are exactly same. Green color presents the best results which means images are the closest to each other in terms of that metric. The last color is red which presents the worst results that means images are distinct from each other.
CC RASE SAM RMSE ERGAS
1 0 0 0 0
PCA 0.572 3.62x10⁴ 0.751 1.72x10⁵ 1.19x10⁴
IHS 0.604 3.35x10⁴ 0.740 1.59x10⁵ 1.11x10⁴
Brovey 0.687 4.68x10⁴ 0.024 2.23x10⁵ 9.81x10³
Optimal Values Best Results Worst Results
Table 2. Comparison the results of various metrics.
3.6. Overview and Future Plans for SharpQ
Since the algorithms both in generation and validation of pan-sharpening are known, their effects on the results can be tracked. We are planning to implement other popular pan-sharpening methods such as wavelet based pan-pan-sharpening. Moreover, we are planning to develop an interface which can be used for quality assessment of images visually.
4. EPIX
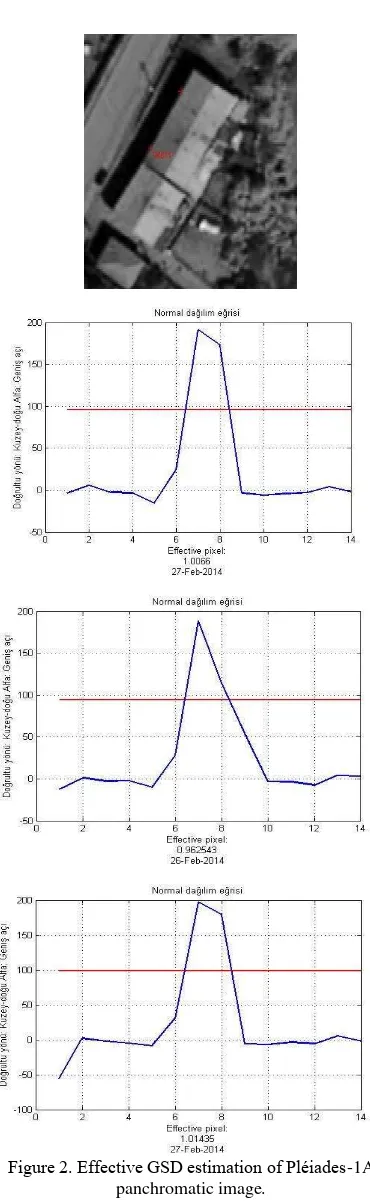
epix has been developed for determining effective GSD of optical satellite images. This tool estimates difference of mean of grey value between roof texture and shadows of building-edge in the images, depending on ESF (Edge Spread Function). So both real GSD and geometric resolution of images can be determined. An example of application of epix on Pléiades-1A image is given in the Figure 2. The value of effective GSD for Pléiades-1A is 1 pixel. This means there is no loss in resolution with resampling the original image with 70 cm GSD into the product with 50 cm GSD. Findings of the analyses for IRS-1C with low radiometric resolution, or KVR-1000 and TK-350 which are scanned analog films have effective GSD greater than 1 pixel. This means these images are used by lower geometric resolution (Topan et al., 2009).
4.1. Future Plans for epix
The concept of effective GSD is not placed in many of image evaluation studies. In fact this analysis is very important for the estimation of real geometric resolution. The next plan is to develop an interface which is capable of marking edge positions automatically.
5. CONCLUSION
been developed for the RFM solution which is common georeferencing model suggested by OGC and is valid for many of remotely sensed images.
GeoEtrim is available since 2009, and two new sisters of trio, SharpQ and epix, are joined. Generation of pan-sharpened images is a common process, and the quality of this product must be analyzed by some metrics. Last tool is epix developed for estimation of the effective GSD. So one can estimate the real
geometric resolution of image with the ESF principle using epix. The first sub-meter optical satellites of Europe, Pléiades-1A has been analysed by epix, and the effective GSD was estimated as 1 pixel. This means the users can handle these images with their 50 cm GSD resampled from 70 cm original resolution.
Innovative algorithms and graphical user interface presented in this paper will be improved gradually.
ACKNOWLEDGMENT
Developing these tools was supported by Bülent Ecevit University (BEU) and Istanbul Technical University (ITU), Turkey, and is being supported by TUBITAK 114Y380 project since 15th June 2014. IKONOS and QuickBird images were provided by TUBITAK (Turkey) and Jülich Research Centre (Germany), OrbView-3 image was available with the support of BEU, and Pléiades-1A image is received within the Airbus Defence & Space MyGIC Project (France).
REFERENCES
Alparone, L., Aiazzi, B., Baronti, S., Garzelli, A., Nencini, F., Selva, M., 2008. Multispectral and Panchromatic Data Fusion Assessment Without Reference. Photogrammetric Engineering & Remote Sensing 74, 193-200.
Alparone, L., Wald, L., Chanussot, J., Thomas, C., Gamba, P., Bruce, L.M., 2007. Comparison of Pansharpening Algorithms: Outcome of the 2006 GRS-S Data-Fusion Contest. Geoscience and Remote Sensing, IEEE Transactions on 45, 3012-3021.
Büyüksalih, G., Akcin, H., Jacobsen, K., 2006. Geometry of OrbView-3 Images, ISPRS Topographic Mapping From Space (with Special Emphasis on Small Satellites), Ankara, Turkey.
Choi, M., Kim, R.Y., Nam, M.-R., Kim, H.O., 2005. Fusion of multispectral and panchromatic Satellite images using the curvelet transform. Geoscience and Remote Sensing Letters, IEEE 2, 136-140.
Dowman, I., Dolloff, J.T., 2000. An evaluation of rational functions for photogrammetric restitution. International Archives of Photogrammetry and Remote Sensing XXXIII, 254-266.
Ehlers, M., Klonus, S., Johan Åstrand, P., Rosso, P., 2010. Multi-sensor image fusion for pansharpening in remote sensing. International Journal of Image and Data Fusion 1, pp. 25-45.
FUKAL, 2014. Photogrammetry-Remote Sensing and Geospatial Analysis Laboratory, Bulent Ecevit University, Engineering Faculty, Department of Geomatics Engineering.
Karathanassi, V., Kolokousis, P., Ioannidou, S., 2007. A comparison study on fusion methods using evaluation indicators. Int J Remote Sens 28, 2309-2341.
Klonus, S., Ehlers, M., 2009. Performance of evaluation methods in image fusion, Information Fusion, 2009. FUSION '09. 12th International Conference on, pp. 1409-1416.
Kutoğlu, H., 2004. Figure Condition in Datum Transformation. Journal of Surveying Engineering 130, pp. 138-141.
Laporterie-Déjean, F., de Boissezon, H., Flouzat, G., Lefèvre-Fonollosa, M.-J., 2005. Thematic and statistical evaluations of five panchromatic/multispectral fusion methods on simulated PLEIADES-HR images. Information Fusion 6, 193-212.
OGC, 1999. The OpenGIS® Abstract Specification Topic 6: The Coverage Type and its Subtypes Version 4.
Pohl, C., Van Genderen, J.L., 1998. Review article Multisensor image fusion in remote sensing: Concepts, methods and applications. Int J Remote Sens 19, 823-854.
Riazanoff, S., 2004. SPOT 123-4-5 Geometry Handbook, in: Image, S. (Ed.).
Sertel, E., Kutoglu, S.H., Kaya, S., 2007. Geometric correction accuracy of different satellite sensor images: application of figure condition. Int J Remote Sens 28, 4685-4692.
SkyboxImaging, 2014. SkySat-1&2.
Teo, T.-A., 2011. Bias Compensation in a Rigorous Sensor Model and Rational Function Model for High-Resolution Satellite Images. Photogrammetric Engineering & Remote Sensing 77, 1211–1220.
Topan, H., 2009. Geometric Analysis of High Resolution Space Images Using Parametric Approaches Considering Satellite Orbital Parameters, Department of Geomatics Engineering. Istanbul Technical University, Turkey.
Topan, H., 2011. GeoEtrim: Geospatial Evaluation and Training of Images, 5th International Conference on Recent Advances in Space Technologies (RAST 2011), İstanbul (Turkey), pp. 142-147.
Topan, H., 2013. First Experience with Figure Condition Analysis Aided Bias Compensated Rational Function Model for Georeferencing of High Resolution Satellite Images. J Indian Soc Remot 41, 807-818.
Topan, H., Kutoglu, H.S., 2009. Georeferencing Accuracy Assessment of High-Resolution Satellite Images Using Figure Condition Method. Ieee T Geosci Remote 47, 1256-1261.
Topan, H., Maktav, D., 2010. GeoSpot: Doğrusal Dizi Uydu Görüntülerinin Uydu Yörünge Parametreleri ile Demet Dengelenmesi, III. Uzaktan Algılama ve Coğrafi Bilgi Sistemleri Sempozyumu, Kocaeli.
Topan, H., Maktav, D., 2014. Efficiency of Orientation Parameters on Georeferencing Accuracy of SPOT-5 HRG Level-1A Stereoimages. Ieee T Geosci Remote 52, 3683-3694.
Topan, H., Maktav, D., Jacobsen, K., Buyuksalih, G., 2009. Information content of optical satellite images for topographic mapping. Int J Remote Sens 30, 1819-1827.
Topan, H., Oruç, M., Taşkanat, T., Cam, A., 2014. Combined Efficiency of RPC and DEM Accuracy on Georeferencing Accuracy of Orthoimage: Case Study With Pléiades Panchromatic Mono Image. Ieee Geosci Remote S 11, 1148-1152.
Topan, H., Taşkanat, T., Cam, A., 2013. Georeferencing Accuracy Assessment of Pléiades 1A Images Using Rational Function Model, International Archives of the Photogrammetry, Remote Sensing and Spatial Information Sciences, pp. 251-256.
Vijayaraj, V., 2004. A QUANTITATIVE ANALYSIS OF PANSHARPENED IMAGES, Department of Electrical & Computer Engineering. Mississippi State University.