AN AUTOMATED AND INTEGRATED FRAMEWORK FOR DUST STORM
DETECTION BASED ON OGC WEB PROCESSING SERVICES
Fei Xiao a, Geoffrey Y.K. Shea a,*, Man Sing Wong a, James Campbell b
a
Dept. of Land Surveying and Geo-Informatics, The Hong Kong Polytechnic University, Kowloon, Hong Kong – [email protected], (lsykshea, lswong)@polyu.edu.hk
b
U.S. Naval Research Laboratory, Monterey, CA, U.S. – [email protected] Technical Commission II
KEY WORDS: Web Processing Services, dust storm, MTSAT image, WRF, HYSPLIT, Google Earth
ABSTRACT:
Dust storms are known to have adverse effects on public health. Atmospheric dust loading is also one of the major uncertainties in global climatic modelling as it is known to have a significant impact on the radiation budget and atmospheric stability. The complexity of building scientific dust storm models is coupled with the scientific computation advancement, ongoing computing platform development, and the development of heterogeneous Earth Observation (EO) networks. It is a challenging task to develop an integrated and automated scheme for dust storm detection that combines Geo-Processing frameworks, scientific models and EO data together to enable the dust storm detection and tracking processes in a dynamic and timely manner. This study develops an automated and integrated framework for dust storm detection and tracking based on the Web Processing Services (WPS) initiated by Open Geospatial Consortium (OGC). The presented WPS framework consists of EO data retrieval components, dust storm detecting and tracking component, and service chain orchestration engine. The EO data processing component is implemented based on OPeNDAP standard. The dust storm detecting and tracking component combines three earth scientific models, which are SBDART model (for computing aerosol optical depth (AOT) of dust particles), WRF model (for simulating meteorological parameters) and HYSPLIT model (for simulating the dust storm transport processes). The service chain orchestration engine is implemented based on Business Process Execution Language for Web Service (BPEL4WS) using open-source software. The output results, including horizontal and vertical AOT distribution of dust particles as well as their transport paths, were represented using KML/XML and displayed in Google Earth. A serious dust storm, which occurred over East Asia from 26 to 28 Apr 2012, is used to test the applicability of the proposed WPS framework. Our aim here is to solve a specific instance of a complex EO data and scientific model integration problem by using a framework and scientific workflow approach together. The experimental result shows that this newly automated and integrated framework can be used to give advance near real-time warning of dust storms, for both environmental authorities and public. The methods presented in this paper might be also generalized to other types of Earth system models, leading to improved ease of use and flexibility.
* Corresponding author.
1. INTRODUCTION
1.1 General Instructions
Spatial Data Infrastructures (SDIs) provide the framework for optimising the creation, maintenance, discovery and access of geographic information (GI) (Stollberg et al., 2007). After two decades’ development, the SDIs has evolved from its early stage of offering geoportal or spatial web protals that integrate on-line map viewers and search services, to a frameworks for easy and flexible development of GI applications by providing standardised data access interfaces as well as mechanisms for composing the offered GI services into service chains (Christensen et al., 2009). For environmental and meteorological modelling, it is often necessary to bring together disparate Earth Observation (EO) datasets and model outputs to try to analyse the complex Earth system processes (Liu et al., 2008). Therefore, SDIs provide an important basis in the field of disaster management where geospatial information must be discovered, processed and visualized quickly to provide critical assistance in emergencies and in support decision makers and recuse workers.
Most geoscientific data are not obtained from the measurements but rather derived from a geospatial processing workflows, which often includes geospatial data collection, verification, validation, transformation, and analysis (Zhao et al., 2012). However, it is not always straight forward to create a modelling workflow due to platform dependencies, computer architecture requirements, and programming language incompatibilities (Anthony et al., 2012). In addition, environmental systems are difficult to model in large part because they include dynamic physical, chemical, and biological processes that are coupled and can vary at different spatial and temporal scales (Anthony et.al., 2012). Scientists in practice may waste considerable time on repetitive, time-consuming operations to integrate such disparate datasets rather than focusing on real scientific analysis and decision-making. Given these challenges, one of the goals of the SDIs and environmental modelling community is achieving interdisciplinary modelling in a way that maintains state-of-the-art knowledge and modelling approaches, while also enabling interoperability of models across disciplinary and organizational boundaries for integrating different geospatial datasets and operations into geospatial processing workflows. The International Archives of the Photogrammetry, Remote Sensing and Spatial Information Sciences, Volume XL-2, 2014
With the development of Service-Oriented Architecture (SOA), a new scalable service-based frameworks for building distributed computing and large networks of collaborating applications, the environmental modelling underwent a substantial change form stand-alone patterns to distributed service architectures manifested in the SDIs (Masser 2005). By applying and chaining, composite geospatial processes and heterogeneous EO datasets on the fly, it is possible to produce valuable geoinformation over the web directly available and applicable to a wide range of geo-activities of significant importance for the research and industry community. Among all of existed SOA based schemes for geospatial data processing, the Web Processing Service (WPS) initiated by Open Geospatial Consortium (OGC) has been proved as one efficient technology for constructing the Integrated Environmental Models (IEM) and service chains (Anthony et al., 2012). Many attempts to orchestrate OGC services into service-based geospatial workflows have been proposed within the geospatial and environmental domains (Schaeffer et al. (2008), Friss-Christensen et al. (2009), Granell et al. (2010)). Anthony et al. (2012) presented a design for a modelling service building form the OGC WPS protocol and demonstrated how these services can be chained into workflow for more complicated tasks. Chen (2010) proposed a geo-processing workflow model for wildfire hot pixel detection under the sensor web environment.
In this study, we proposed an automated and integrated approach for dust storm detection and tracking based on the OGC WPS specification. The presented WPS framework consists of EO data processing component, dust storm detecting and tracking component, and service chain orchestration engine. The EO data processing component applied the Unidata's Thematic Real-time Environmental Distributed Data Services (THREDDS). The dust storm detecting and tracking component combines three earth scientific models, which are Santa Barbara DISORT Atmospheric Radiative Transfer (SBDART) model (for computing aerosol optical depth (AOT)), Weather Research and Forecasting (WRF) model (for simulating meteorological parameters) and Hybrid Single Particle Lagrangian Integrated Trajectory (HYSPLIT) model (for simulating the dust storm transport processes). The service chain orchestration engine is implemented based on Business Process Execution Language for Web Service (BPEL4WS) technique using open-source software. Our aim here is to solve a specific instance of a complex EO data and scientific model integration problem by using a framework and scientific workflow approach together. The output results, including horizontal and vertical AOT distribution of dust particles as well as their transport paths, were represented using KML/XML and displayed in Google Earth.
2. A SHORT INTRODUCTION ABOUT THE METHODS FOR DUST STORM DETECTION
Dust storms are known to have adverse effects on human health and significant impact on weather, air quality, hydrological cycle, and ecosystem. Atmospheric dust loading is also one of the large uncertainties in global climate modelling as it is known to have a due to its significant impact on the radiation budget and atmospheric stability. Satellite observations provide an efficient tool to monitor the features of dust for their extensive areal coverage and ability to quantitatively measure dust’s optical properties. water particles exhibit higher absorption in longer wavelengths (Ackerman 1997; Zhao et al., 2010). Legrand (2001) developed the Infrared Difference Dust Index (IDDI) to detect the presence of desert dusts over Africa. The rationale of IDDI is based on observing thermal radiation (10 µm -12 µm) emitted by the same scene over the course of several days, where distinct changes are evaluated for potential dust presence. The equations of BTD and IDDI are shown as follows:
m
reference imagery with the same coordinate with
ori
BT
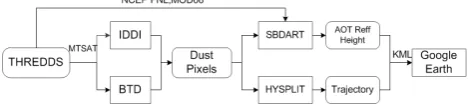
After the regions of dust storms have been identified, two processes will be triggered to generate the detailed information of dust aerosols. First, the SBART model are used to retrieve the AOT and dust layer height by means of so called look-up table (LUT) approach (Shao et al., 2006). Furthermore, the HYSPLIT Model developed by the Air Resources Laboratory of NOAA will be used to simulate the transportation of dust storm particles. The HYSPLIT trajectory mode is set to 48-hr forward trajectory with inputs from Global Forecast System (GFS) 0.5 degree data. Considering that the dust storms most commonly cover large areas, for which it is time consuming to generate forward trajectories from every pixel, the original image of dust pixels will be downscaled to 1 degree by bilinear interpolation method and the central location of each grid in the new image is used as the start point of HYSPLIT forward trajectory. Figure 1 displays the workflow of dust storm detection used in this study.
Figure 1. The flowchart of dust storm detection algorithm
Hourly Multifunctional Transport Satellites (hereafter MTSAT) Brightness Temperature (hereafter BT) images derived from four infrared channels (mid-infrared: IR3 and IR4; thermal-infrared: IR1 and IR2), with a spatial resolution of 4 km, and one visible channel (VIS), with a spatial resolution of 1 km, were used in this study as EO data. The WRF model with inputs from the National Center for Environmental Prediction (NCEP) FNL (Final) Operational Global Analysis data were used here to simulate the atmospheric parameters, for example, the atmospheric profiles (temperature profile) data in NetCDF format. In addition, The Moderate Resolution Imaging Spectroradiometer (MODIS) Gridded Atmospheric Product (MOD08) was used to offer the total water vapour column and The International Archives of the Photogrammetry, Remote Sensing and Spatial Information Sciences, Volume XL-2, 2014
land surface temperature (LST) products. All of these atmospheric parameters were used as the inputs to the SBDART model to calculate the dust aerosol properties (e.g. AOT and dust layer height).
3. DESIGN
3.1 Earth Observation (EO) data processing component
The Unidata's Thematic Real-time Environmental Distributed Data Services (THREDDS) is utilized for EO data (MTSAT) and atmospheric data (NCEP FNL and MOD08). The THREDDS Data Server (TDS) combines Unidata's THREDDS catalog services with integrated data-serving capabilities, including HTTP, OPeNDAP, WCS, Subset Service and automatic catalog generation. One major benefit of using TDS is that the Dataset Inventory Catalogs, which can be generated dynamically or statically, are used to provide virtual datasets of available data and their associated metadata. In this study, we applied NcML (Nativi et al., 2005) to aggregate MTSAT
datasets based on the ‘time’ dimension into a virtual dataset. The virtual dataset is extraordinarily useful when user needs to retrieve time-series data. Take the IDDI algorithm as an example, one of the inputs of IDDI algorithm is the maximum radiance for each pixel at the specified thermal band (IR1) of MTSAT during a large enough period (15 days in this study). In order to decrease the volume of data to be transported, users only need to request a subset of MTSAT datasets by specified the band name and time range using the following HTTP request:
http://158.132.186.198:8080/thredds/ncss/grid/mtsat2012.nc?v ar=IR1&north=55&south=20&west=90&east=135&accept=n etcdf&time_start= 2012-04-12T00:32:00Z&time_end=2012-04-27T00:32:00Z&timeStride=24
3.2 OGC WPS implementation
The OGC WPS specification was released on 2005 by OGC, in order to provide spatial processes through a standardized service interface in the distributed computing environment. A WPS is able to handle more than a single process and defined three mandatory operations: GetCapabilities, DescribeProcess and Execute (OGC, 2013). The WPS resources were created by leveraging the existing GeoServer project with WPS extension (hereafter GeoServer WPS). The main advantage of using GeoServer WPS over a standalone WPS is that the GeoServer WPS can be directly integrated with GeoServer OGC web services (e.g. WMS, WCS, and WFS) and the data catalog services. This means that it is possible to create processes based on the data served in GeoServer, as opposed to sending the entire data source in the request, and publish the results of a WPS as a new layer in the GeoServer catalog, which enable users to access these results with various format (GML, KML and GeoTiff etc.) based on their requirements. In this way, the GeoServer WPS acts as a full remote geospatial analysis tool, capable of reading and writing data from and to GeoServer. In addition, GeoServer WPS offers approach for developers to rapidly prototype new WPS resources by creating single function module.
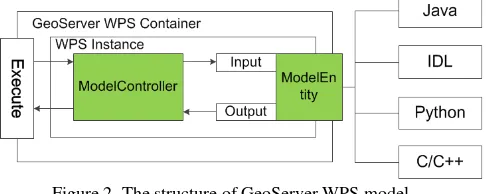
A generic structure of GeoServer WPS process model was designed based on the GEO Model Web proposed by Nativi (2013). Our WPS model was specially optimized for processing the distributed EO dataset and facilitating WPS orchestration in a scientific workflow environment. Figure2 illustrates the
structure of WPS model. Every environmental model can be instantiated as a WPS instance, which can be executed and controlled in the Geoserver WPS Container. A WPS instance consists of two objects: ModelController and ModelEntity. The ModelController is responsible for (a) processing the input parameters involved in the WPS request body, (b) initializing the model executing environment and (c) launching the execution of Model. The ModelEntity is an abstract entity of the executable encoding of an environmental model. The ModelEntity is designed very general which means that it can be implemented by other programming languages, such as C/C++, Java, C#, GRASS GIS, Python, and R. In this study, the IDL was used to construct the model entity for that it has been widely used for meteorological science and a large amount of code can be used directly to process EO data.
Figure 2. The structure of GeoServer WPS model
When the WPS instance is completed, ModelController will publish the model output to GeoServer as an OGC OWS dataset. The end-users can access these datasets through various data access methods, such as WMS, WCS, and HTTP. For example, if the user wants to perform some further analyses on the model outputs, a GeoTiff or NetCDF can be used to represent the structural multi-dimensional dataset. Should the output be only for visualization purposes, PNG images may be sufficient. For visualization in Web mapping clients (Google Earth), the user may request the output as an OGC-WMS reference. Figure 3(a) shows the GeoServer request builder interface, with a case of WPS ‘Execute’ request for IDDI model. Figure 3(b) is the corresponding XML encoding of the WPS ‘Execute’ request generated in Figure 3(a).
(a)
(b)
Figure 3. (a) GeoServer WPS request builder interface with a
demonstration of ‘lsgi:IDDI’ WPS request; (b) Request body of WPS ‘Execute’ operation in XML format for invoking the
‘lsgi:IDDI’ WPS model.
3.3 Web service orchestration using BPEL4WS
The final step in service-oriented modelling is defining workflow orchestrations that interlink independent WPS instance to perform analysis or modelling tasks. Based on the introduction of dust storm detection workflow in section 2 and GeoServer WPS structure in section 3.2, five GeoServer WPS instances were built named: SDS_BTD_Process, SDS_IDDI_Process, SDS_MERGE_Process, SDS_SBDART_Process and SDS_HYSPLIT_Process. The Business Processing Execution Language for Web Service (BPEL4WS) scripts were used to construct web service chain. Those five WPS instances were combined into a service chain in a dependent series to achieve the task of retrieving physical parameters of dust aerosols such as AOT and effective radius. Figure4 presents the deployed workflow. It was modelled with the Eclipse BPEL Designer Project (http://www.eclipse.org/bpel/), which can automatically create WSDL documents for the workflow partners and describe the workflow via BPEL4WS. The Apache ODE was used as the BPEL engine to orchestrate the service chain and control the execution of the workflow.
v
Figure 4. BPEL4WS model for dust storm detection designed by Eclipse BPEL Designer Project
4. CASE STUDY AND DISCUSSION 4.1 Dust storm from 26 to 28 Apr 2012
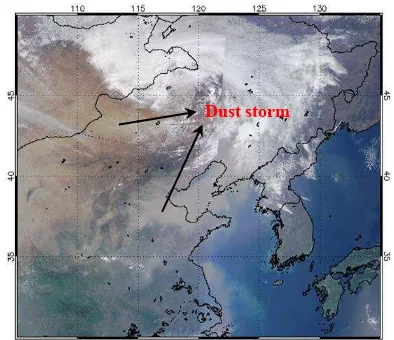
As shown is Figure 5, a serious dust storm, which occurred over northern China from 26 to 28 Apr 2012, was applied to test our system. The dust storm initiated over the northwestern China and Mongolia on 25 Apr 2012 and propagated towards broad downwind areas, include northern, and eastern China.
Figure 5. True-color Aqua image of a dust storm over the north China on Apr 27, 2012
Dust storm
(a) (b)
Figure 6. (a) BTD image, (b) IDDI image of of a dust storm over the north China on Apr 27, 2012
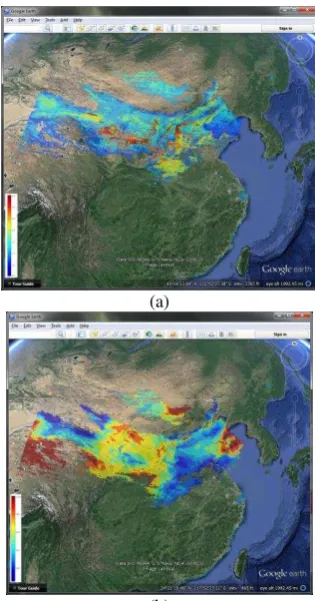
Figure 6 plots the BTD and IDDI images generated by SDS_IDDI_Process and SDS_BTD_Process respectivly using MTSAT imagery at the time of 04:32 UTC on Apr 27, 2012. During the execution of service chain for dust storm detection, the SDS_IDDI_Process and SDS_BTD_Process were executed in parallel and communicated results to downstrean compoment (SDS_MERGE_Process). The SDS_MERGE_Prcess checked out dust storm pixels by merging the results generared by SDS_BTD_Process and SDS_IDDI_Process and then transfered the dust pixels to SDS_SBART_Process as one of inputs. Then the SDS_SBART_Process was triggered to retrive the dust particles’ properties, such as AOT and dust layer height, based on a LUT generated by SBDART model using Optical Properties of Aerosols and Clouds (OPAC) optical model (Hess et al., 1998). Meanwhile, the SDS_HYSPLIT_Process was executed for simulating the moving path of dust storm. The dust storm AOT, height and trajectories were represenetd by KML, which can be displayed directly in Google Earth. Figure 7 shows the KML files of dust storm AOT and dust layer height gernerate by SDS_SBART_Process.
(a)
(b)
(c)
Figure 7. Model output of service chain. (a) AOT at 550 um; (b) height of dust layer; (c) HYPLIT 48-hr forward trajectories.
4.2 Discussion
This work utilizes existing web service technologies, such as WPS and BPEL4WS, to create and deploy web service resources. Expose existing models by using standardization of the service interface enables the users to use environmental models more easily. The THREDDS is utilized here as the EO data processing server, which make it possible to decrease the volume transported on the Internet during the execution of workflow. A WPS Instance model was desgined based on GeoServer WPS extension and tested using a true dust event. The experimental result shows that this newly automated and integrated framework can be used to give advance near real-time warning of dust storms, for both environmental authorities and public. The methods presented in this paper might be also generalized to other types of Earth system models, leading to improved ease of use and flexibility.
However, it is important to understand that there remains some challenges which must be taken into account. The first challenge is how to optimize the complex interactions between client and environmental models exposed in the form of WPS. Earth scientific models alwasys include dynamic physical, chemical, and biological processes that are coupled and can vary at different spatial and temporal scales. Users need to adjust the parameters frequently in order to improve the model output. How to build an interacting scheme to enable users to adjust the parameters of a model exposed during its execution is a very import point. Unfortunately the WPS specification
doesn’t offer such a scheme. One solution is to apply Agent-based architecture to coordinate the interaction between client and web service through some middleware, such as the Service Broker proposed by Nativi (2013).
Furthermore, little work was done to optimize the performance of the service oriented model. It can be of extreme time consuming to perform EO data analysis on large datasets or across entire simulation durations. In our future work, the web resources that employ large scale computations will be executed asynchronously, thus enabling the client to perform multiple tasks simultaneously. Zhao (2012) analysed several asynchronous patterns, which will be applied in our future work to provide a flexible way to build geospatial processing workflows in an asynchronous manner. In addition, Cloud Computing has grown into a powerful new paradigm for building Web systems. A key idea of the cloud computing concept is that it can offer elastic computer resources (processing, storage, software). Konstantinos (2013) provided a The International Archives of the Photogrammetry, Remote Sensing and Spatial Information Sciences, Volume XL-2, 2014
design and architectural framework for web applications based on open geospatial standards. However, geoscience applications have special requirements that cannot be automatically supported by generic cloud computing platforms, because most geospatial algorithms and applications are not designed to leverage multiple CPUs and be delivered through the Internet as a service. Most importantly, both the geoscience and the cloud computing environments are spatiotemporal intensive. Geoscience phenomena are complex processes and geoscience applications often take a variety of data as input with a long and complex workflow (Yang et al., 2011). There is an urgent need to investigate how geoscience can leverage cloud computing to improve the performance and enable the computability of scientific problems, and hide the complexity of the computing infrastructure so that scientists can focus on scientific problems.
5. CONCLUSION AND FUTURE RESEARCH
This paper introduced an automated and integrated framework for dust storm detection based on the Web Processing Services (WPS) initiated by Open Geospatial Consortium (OGC) and Business Processing Execution Language for Web Service (BPEL4WS). The presented WPS framework consists of EO data processing component using THREDDS, five WPS instances which not only can be used as single WPS for geospatial data processing, but also can be seamlessly chained to build the service chain for complex tasks. A service chain orchestration engine, Apache ODE, was introduced and applied to test the WPS workflow. A serious dust storm, which occurred over East Asia from 26 to 28 Apr 2012, is used to test the applicability of the proposed WPS framework. The experimental result shows that this newly automated and integrated framework can be used to give advance near real-time warning of dust storms, for both environmental authorities and public. The methods presented in this paper might be also generalized to other types of Earth system models, leading to improved ease of use and flexibility.
The next step will be to study how to improve the following components: an enhanced workflow engine to chain the diverse atomic processes into a uniform WPS, a workflow engine oriented to an OGC service interface to simplify the invocation of geospatial Web services. How to deploy the proposed WPS framework in Cloud Computing environment to improve the performing efficient of workflows is another research direction in our future work.
References:
Ackerman, S.A., 1997. Remote sensing aerosols using satellite infrared observations. Journal of Geophysical Research, 102(D14), 17069–17079.
Chen, N.C., Di, L.P., Yu, G., Gong, J., 2010. Geo-processing workflow driven wildfire hot pixel detection under sensor web environment. Computers & Geosciences, 36 (2010), pp. 362– 372
Dubois, G., Schulz, M., Skøien, J., Bastin, L., Peedell, S. 2013. eHabitat, a multi-purpose Web Processing Service for ecological modelling. Environ. Environmental Modelling & Software, 41 (3) (2013), pp. 123–133
Evangelidis, K., et al., 2014. Geospatial services in the Cloud. Computers & Geosciences 63(0): 116-122.
Friis-Christensen, A., Lucchi, R., Lutz, M., Ostländer, N., 2009. Service chaining architectures for applications implementing distributed geographic information processing. International Journal of Geographical Information Science, 23 (5) (2009), pp. 561–580
Geller, G.N., Turner, W., 2007. The model Web: a concept for ecological forecasting. In: Geoscience and Remote Sensing Symposium, 2007. IGRASS 2007. IEEE International, 2469-2472, 23-28 July 2007.
Goodall, J.L., Robinson, B.F., Castronova, A.M. et al., 2011. Modelling water resource systems using a service-oriented computing paradigm Environmental. Modelling & Software.
Granell, C., Diaz, L., Gould, M., 2010. Service-oriented applications for environmental models: reusable geospatial services. Environmental Modelling & Software, 25 (2010), pp. detection of dust using the IR imagery of Meteosat: 1. Infrared difference dust index. Journal of Geophysical Research, 106(D16), 18251–18274.
Masser I, 2005. GIS worlds: creating spatial data infrastructures, 1st edn. ESRI Press, Redlands.
Nativi, S., J. Caron, E. Davis and B. Domenico, 2005. Design and implementation of netCDF Markup Language (NcML) and Its GML-based extension (NcML-GML). Computers & Geosciences Journal, 31 (9), 1104-1118, 2005.
Nativi, S., Mazzetti, P., Geller, G.N., 2013. Environmental model access and interoperability: the GEO model web initiative. Environmental Modelling & Software, 39 (2013), pp. 214–228
Schaeffer, B., 2008. Towards a transactional Web processing service (WPS-T). In: of the proceedings 6th Geographic Information Days 2008, Munster, Germany, pp. 91-116.
Shao, Y., & Dong C.H., 2006. A review on East Asian dust storm climate, modelling and monitoring. Global and Planetary Change, 11, 8231-8256.
Stollberg, B. & Zipf, A., 2007. OGC Web Processing Service Interface for Web Service Orchestration Aggregating Geo-processing Services in a Bomb Threat Scenario. In Web and Wireless Geographical Information Systems, Lecture Notes in Computer Science (pp. 239–251). Berlin, Heidelberg: Springer.
Yang, C., M. Goodchild, Q. Huang, D. Nebert, R. Raskin, Y. Xu et al,. 2011. Spatial cloud computing: how can the geospatial sciences use and help shape cloud computing? International Journal of Digital Earth 4(4): 305-329.
Zhao, T.-P., Ackerman, S., & Guo W., 2010. Dust and Smoke Detection for Multi-Channel Imagers. Remote Sensing, 2(10), 2347-2368.