AUTOMATIC MAPPING OF GLACIER BASED ON SAR IMAGERY BY BENEFITS OF
FREELY OPTICAL AND THERMAL DATA
L. Fang, L. Hoegner, U. Stilla
Photogrammetry & Remote Sensing, Technische Universitaet Muenchen (TUM), Munich, Germany
-ICWG III/VII
KEY WORDS: Glacier, Surface Area, SAR, Optical data, Thermal data
ABSTRACT:
For many research applications like water resources evaluation, determination of glacier specific changes, and for calculation of the past and future contribution of glaciers to sea-level change, parameters about the size and spatial distribution of glaciers is crucial. In this paper, an automatic method for determination of glacier surface area using single track high resolution TerraSAR-X imagery by benefits of low resolution optical and thermal data is presented. Based on the normalized difference snow index (NDSI) and land surface temperature (LST) map generated from optical and thermal data combined with a surface slope data, a low resolution binary mask was derived used for the supervised classification of glacier using SAR imagery. Then, a set of suitable features is derived from the SAR intensity image, such as the texture information generated based on the gray level co-occurrence matrix (GLCM), and the intensity values. With these features, the glacier surface is discriminated from the background by Random Forests (RF) method.
1. INTRODUCTION
The glaciers in mountain areas sensitively interact with climate fluctuations and therefore they become very important climate indicators. Satellite remote sensing has a great capability in monitoring the glaciers located in cold high altitude regions and inaccessible areas. Visible sensors have been extensively and successfully used to map ice covered areas (Paul et al., 2002; Paul et al., 2004; Kargel et al., 2005; Hendriks and Pellikka, 2007), but the limitations are their dependence on weather conditions, which cannot provide timely information of the target area. However, SAR, due to its all day, all weather imaging capabilities, can reliably collect data with a pre-defined temporal interval over long periods of time with a spatial resolution compatible with the application of glacier surface area determination. Within opposition to that, using optical remote sensing imagery it might happen that cloud-coverage makes one (or more) acquisitions in the interval impossible, thus leading to a time series with “gaps”.
Much work has been done to map and study glaciers and ice sheets using SAR techniques: most of the work is based on interferometric information or polarimetric data (Shi and Dozier, 1993; Dall et al., 2004; Zhou et al., 2010). The interferometric information is usually limited by the temporal decorrelation between the sequential acquisitions, and the acquirement of polarimetric data is relied on characteristics of sensor. Oppositely, the SAR intensity image acquired from one track used in this experiment is much easier to get.
In this paper, we propose an automatic method for glacier area determination using high resolution TerraSAR-X imagery by benefits of freely acquired optical and thermal data. The surface area of a glacier is an important parameter not only for the two-dimensional mapping of changes of the glacier extent; it furthermore can be used to get rough estimates of the corresponding glacier volume based on geophysical models (Bahr et al., 1997).
2. STUDY AREA AND DATASETS
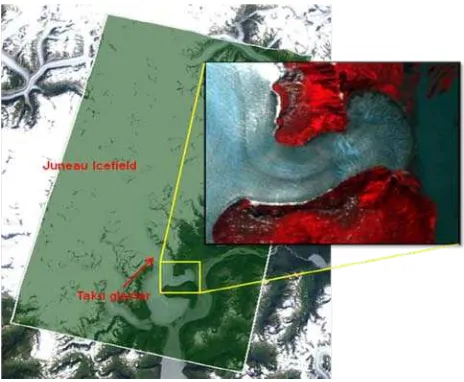
The Juneau Icefield is a low-latitude glacier system of small scale located in southeast Alaska. The Taku glacier, the outlet glacier, having the biggest content in this area is chose to be the study area. In this paper, a Landsat TM (with 30m as the resolution) scene was used to generate NDSI features and clusters mask used for the supervised classification of glacier on a high resolution TerraSAR-X scene acquired in summer 2009. Simultaneously, an Aster (with 90m as the resolution) and a Modis data acquired almost at the same time and same area were used to derive the LST map. Additionally, a digital elevation model (DEM) was used to provide topographic information.
The TerraSAR-X Single Look Slant Range Complex (SSC) data used in this paper was firstly orthorectified and geocoded using precise available DEM data. The enhanced data have a ground resolution of 3m (much better than that of optical and thermal images used in this experiment) with pixel spacing of 1.5m in both azimuth and range direction. The processed SAR scenes used in this research are plotted on the ground truth area shown in Figure 1. Additionally, the other optical and thermal data were georeferenced to the same coordinate system using this DEM information. Finally, one part of the Taku Glacier surging area marked by a yellow square box from all datasets were cut using the geometric annotation information aiming to test the method for delineating glacier surface addressed in the paper.
3. METHODOLOGY
The work proposed in this paper aims at the classification of glaciers surface areas. For this, first a pixel based glacier mapping method was carried out in order to derive a class mask with 30m as the ground resolution based on features like NDSI, LST and slope information. Afterwards, the class mask was applied to a supervised classification procedure using RF method aiming to distinguish the glacier from the background based on the TerraSAR-X scene. In the SAR data classification procedure, some low level features such as the second-order gray-level co-occurrence matrix (GLCM), and intensity values were used. Additionally, an unsupervised classification only using SAR data was simultaneously carried out in order to compare with the automatic glacier mapping method proposed in this paper.
3.1 Features from Optical and Thermal Data
3.1.1 Land Surface Temperature: The LST, an important factor in global climate change studies can be a feature for discriminating the glacier body from the surrounding environment, especially in summer time. In this work, we use split-window algorithm (SWA) to generate the LST based on an Aster and a Modis images (Pu et al., 2005).
The split-window algorithm (SWA) needs two important parameters: atmospheric transmittance (τ) and land surface
emissivity (ε). The τ was calculated by
content, ratio of Modis band 19 and 2, atmospheric transmittance of Aster band 13 and 14, separately (Kaufman and Gao, 1992).
For the ε, we assume the emissivity of the investigation area is constant (0.97, the emissivity of glacier ice).
Afterwards, the blackbody radiance of Aster band 13 and 14 were derived by
blackbody radiance at band i, separately. Additionally, C1=1.19104356*10 generated by a ratio algorithm with the raw digital numbers (DN) of a visible (VIS) and shortwave infrared (SWIR) band from Landsat TM data. This method utilizes the strong differences in spectral reflectance of ice and snow in these bands (high in the VIS and very low in the SWIR) (Dozier, 1989).
3.2 Features from SAR Data
3.2.1 Texture Information: Texture is one of the important characteristics used in image classification. The second-order gray-level co-occurrence matrix (GLCM) proposed by Haralick (1979) is a well proved effective approach to analyzing image texture features. The GLCM approach to texture analysis is based on the conjecture that the texture information in an image is contained in the overall or average spatial relationship between the gray tones of the image.
In this work, the GLCM of each pixel is generated by 4 directions comparing its 8 neighbourhoods which surround this centre pixel. Afterwards, 4 features are derived from the GLCM: contrast, correlation, energy and homogeneity, which are calculated by
Then, also the mean values of the 4 calculations from 4 different directions of these 4 features are calculated, such that finally 4 texture features are defined to be used in the experiments. Much of the glacier surface area is featured by characteristic textures (e.g., crevasses or drainage patterns), which makes the texture a useful kind of information for the classification.
3.3 Classification Methods
3.3.1 Pixel Based Glacier Mapping: In this paper, clean ice and snow were mapped using NDSI values. The debris covered ice was discriminated by the gentle slope and surface temperature information (Rastner et al., 2013).
3.3.2 Random Forest: The Random Forest (RF) is an
that is based on a multitude and outputting the classification result that is the classes provided by individual trees. Each tree in the forest classifies the sample based on an independently sampled random variable set which are used to best split the node under a certain criteria (e.g., information gain, Gini impurity). After every tree grows until minimum node size is reached, the forest chooses the classification having the most votes (Breiman, 2001).
4. EXPERIMENT RESULTS
4.1 Generated Feature Set
4.1.1 Land Surface Temperature: Using the method
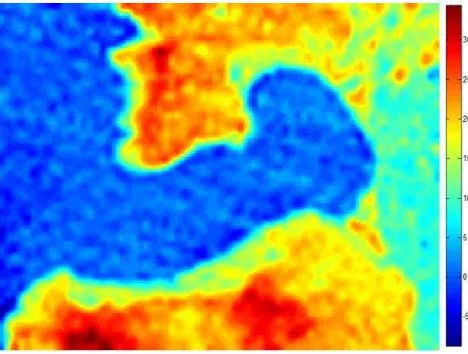
described in section 3.1.1, the LST image in the test area is estimated (Fig. 2). Furthermore, the surface temperatre value differences between glacier and its surrounding neighbourhoods are helpful for classification.
Figure 2. Land Surface Temperature image generated by split-window algorithm.
4.1.2 Normalized Difference Snow Index: The NDSI
information was shown in Figure 3. The resolution of this NDSI map is 30m, better than the LST image which is 90m as the Aster thermal band resolution. This could be the main information for glacier classification in optical data. However, the water is seems having the same values as the glacier area, which could disturb the discriminating procedure.
Figure 3. Normalized Difference Snow Index map derived from Landsat TM image.
4.1.3 Slope Information: The slope map was generated
based on an available DEM derived by SAR Radargrammetry technique (Fig. 4). The water area in slope map is valued with zero, different with other classes, which can help for the discrimination between glacier and water area.
Figure 4. Slope information by SAR Radargrammetry technique.
Figure 5. Upper left: mean value of contrast. Upper right: mean value of correlation. Lower left: mean value of energy. Lower right: mean value of homogeneity.
4.2 Low Resolution Binary Mask
Based on the LST, NDSI and slope information, and the pixel based glacier mapping method, the binary mask with 30m resolution was derived as in Figure 6.
Figure 6. The glacier surface classification result (red colour) based on optical and thermal data plotted on the geo-coded gray scale SAR scene with 3m resolution.
4.3 Glacier Classification Results
Afterwards, the clusters mask was applied to a supervised classification procedure using RF method aiming to distinguish the glacier from the background based on the TerraSAR-X scene. For the unsupervised SAR image classification, features such as the second-order gray-level co-occurrence matrix (GLCM), and intensity values were used.
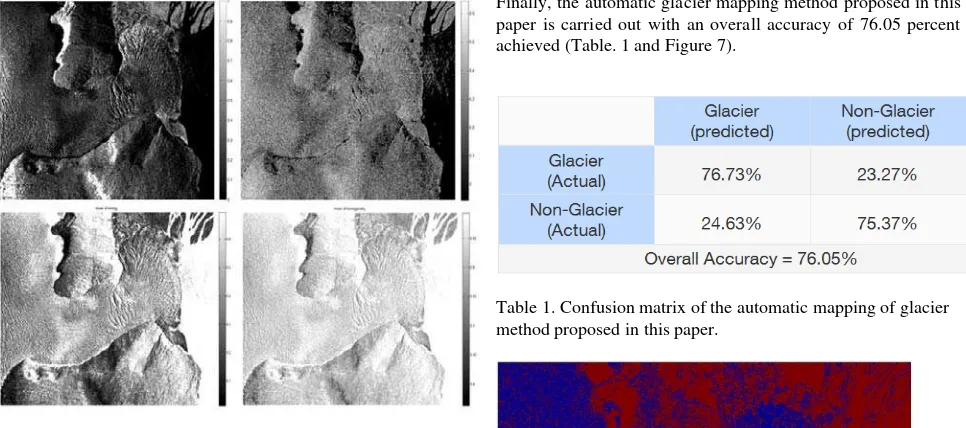
Finally, the automatic glacier mapping method proposed in this paper is carried out with an overall accuracy of 76.05 percent achieved (Table. 1 and Figure 7).
Table 1. Confusion matrix of the automatic mapping of glacier method proposed in this paper.
Figure 7. Classification result of the automatic mapping of glacier method proposed in this paper. Blue colour: glacier area; Red colour: non-glacier area.
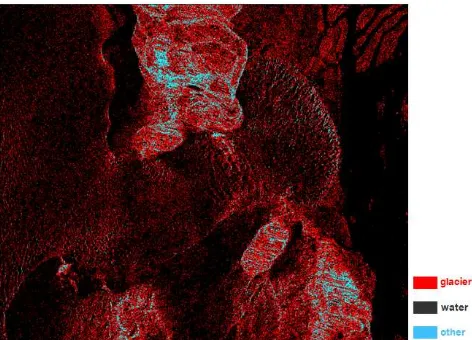
Additionally, an unsupervised classification only using SAR data was simultaneously carried out in order to compare with the automatic glacier mapping method above (see Table 2 and Figure 8).
Table 2. Confusion matrix of the classification result only using SAR data.
Figure 8. Classification result only using SAR data. Red colour: glacier area; Black colour: non-glacier area; Blue colour: the others.
5. CONCLUSION AND RECOMMENDATION
This paper proposes a framework for automatic mapping of glacier area using high resolution SAR data by benefits of the freely acquired optical and thermal data. In order to achieve this goal features such as normalized difference snow index (NDSI) and land surface temperature (LST) map were generated from optical and thermal data, and texture information was the only feature need to be derived from single track SAR image, which is much easier to get than interferometric information or polarimetric data, the mostly used information for glacier classification based on spaceborne SAR imagery. It has been shown that all these features allow for an appropriate discrimination between glacier and non-glacier areas in SAR image. The automatic glacier mapping method proposed in this paper has been proved to be effective.
However, there are still many improvements left for further research. For instance, for the clusters mask generation, the pixel based glacier mapping method should be replaced by high level classification method such as object-based-image analysis technique; for the SAR image classification, other high level features should be used instead of the GLCM texture information (e.g., the other glacier physical information). In future work, a precise knowledge of the glacier surface area is expected to help the mapping of two-dimensional glacier changes as well as serve as an important indicator for glacier volume estimation within geophysical models.
6. REFERENCES
Bahr, D.B., Meier, M.F. and Peckham, S.D., 1997. The physical basis of glacier volume-area scaling. Journal of Geophysical Research, 102 (B9), pp. 20355-20362.
Dall, J., Papathanassiou, K.P. and Skriver, H., 2004. Polarimetric SAR interferometry applied to land ice: modeling. In: Proceedings of EUSAR 2004, pp. 247-250.
Dozier, J., 1989. Spectral signature of alpine snow cover from the Landsat thematicmapper. Remote Sensing of Environment, 28, pp. 9–22.
Haralick, R. M., 1979. Statistical and structural approaches to texture. Proceedings of the IEEE, 67 (5), pp. 786-803.
Hendriks, J.P.M. and Pellikka, P.K.E., 2007. Semi-automatic glacier delineation from Landsat imagery over Hintereisferner in the Austrian Alps. Zeitschrift für Gletscherkunde und Glazialgeologie, 41, pp. 55-75.
Kargel, J.S., Abrams, M. J., Bishop, M. P. and et al, 2005. Multispectral Imaging contributions to Global Land Ice Measurements from Space. Remote Sensing of Environment, 99, pp. 187-219.
Kaufman, Y.J. and Gao, B.C., 1992. Remote Sensing of Water Vapor in the Near IR from EOS/MODIS. IEEE Transactions on Geoscience and Remote Sensing, 30(5), pp. 871-884.
Paul, F., Kääb, A., Maisch, M., Kellenberger, T. and Haeberli, W., 2002. The new remote sensing derived Swiss Glacier Inventory: I. Methods. Annals of Glaciology, 34, pp. 355-361.
Pu, R.L., Gong, P., Michishita, R., and Sasagawa, T., 2006. Assessment of multi-resolution and multi-sensor data for urban surface temperature retrieval. Remote Sensing of Environment, 104, pp. 211-225.
Rastner, P., Bolch, T., Notarnicola, C. and Paul, F., 2013. A Comparison of Pixel- and Object-Based Glacier Classification With Optical Satellite Images. IEEE Journal of Selected Topics in Applied Earth Observations and Remote Sensing.
Shi, J. and Dozier, J., 1993. Measurements of snow- and glacier-covered areas with single-polarization SAR. Annals of Glaciology, 17, pp. 72-76.