Increasing the efficiency of plant nutrient recycling within the
agricultural system as a way of reducing the load to the environment —
experience from Sweden and Finland
Artur Granstedt
∗The Biodynamic Research Institute, Skilleby Farm, 153 91 Järna, Sweden Received 23 June 1999; received in revised form 1 December 1999; accepted 8 February 2000
Abstract
Annual loads of nitrogen and phosphorus from the Baltic drainage area to the Baltic Sea in 1995 are estimated at 761 000 and 37 500 Mg, respectively. In Sweden it has been estimated that human activities account for 54% of the annual input of nitrogen and 55% of the annual input of phosphorus to the Baltic Sea. Agreements to halve the quantity of nutrients reaching the marine environment by 1995 were made within the Helsinki Commission (base year 1987) and at the North Sea Conference/Paris Commission (base year 1985). This goal has not been achieved. Agriculture has contributed substantially to an increase in nutrient leaching. From 1950 to 1980, the inputs of nitrogen, phosphorus and potassium in the form of inorganic fertilizer increased strongly in relation to their outputs in the form of agriculturally produced foodstuffs such as milk, meat and bread grain in Sweden and Finland. After 1980 the surplus of nitrogen remained at the same level. Based on the results of these studies it was concluded that the local and regional specialization of farms is one important reason for the high losses of plant nutrients: one type of farm specializes in crop production based on the use of artificial fertilizers, while the other specializes in animal production with high inputs of purchased fodder and a surplus of plant nutrients in the form of ineffectively utilized manure from the animals.
To minimize the high surplus and losses of plant nutrientsfromthe agricultural system the input of nutrientstothe system needs to be reduced. This can be solved by increasing recycling within the system. In this paper, examples are presented showing that it is possible to conserve and minimize the losses of nitrogen and other plant nutrients through careful recycling within the agro-ecosystem trough integration of crop and animal production. However, to achieve high levels of production and recycling efficiency, there needs to be a good balance between the intensity of animal production and crop production hectarage at the local, regional, and national levels. Assuming that these principles are followed, animal production needs to be decreased in the southern regions in Sweden, while a corresponding increase is required in central Sweden. By applying these agricultural principles throughout the Baltic region it should be possible to halve nitrogen losses and minimize losses of phosphorus, thereby meeting the goals set by the states of the region. © 2000 Elsevier Science B.V. All rights reserved.
Keywords:Agro-ecosystem; Baltic Sea; Farming system; Nitrogen surplus; Nutrient balance; Nutrient leaching; Nutrient recycling efficiency; Organic farming
∗Tel.:+46-8-551-577-02/+46-8-551-577-99; fax:+46-8-551-577-81.
E-mail address:[email protected] (A. Granstedt)
1. Introduction
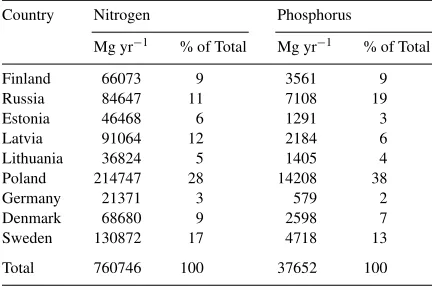
Total annual inputs of nitrogen and phosphorus to the Baltic Sea are estimated to be 1 360 000 and 59 500 Mg, respectively (Stålnacke, 1996). Much of the pollution load is introduced into the Baltic Sea via rivers. An-nual loads of nitrogen and phosphorus from the Baltic drainage area to the Baltic Sea in 1995 are estimated at 761 000 and 37 500 tons, respectively (HELCOM, 1998). Of the calculated load 34% originates in Estonia, Latvia, Lithuania, Russia, 28% in Poland, 17% in Swe-den and 9% for Finland (Table 1). However, per-capita output levels of nitrogen are twice as high for Sweden and Finland compared with Poland. Levels of phospho-rus and nitrogen in the Baltic are currently eight and four times higher, respectively, compared with what they were in 1900 (Enell, 1996). This increase is a re-sult of human activities around the Baltic Sea and in-cludes point and diffuse sources. In Sweden it has been estimated that human activities account for 54% of the annual input of nitrogen and 55% of the annual input of phosphorus to the Baltic Sea. Agreements to halve the quantity of nutrients reaching the marine environment by 1995 were made within the Helsinki Commission (base year 1987) and at the North Sea Conference/Paris Commission (base year 1985).
Agriculture has contributed substantially to an in-crease in nutrient leaching (Jansson, 1997). One fifth of the Baltic Sea drainage area is under cultivation. For Sweden, calculations indicate that agriculture is re-sponsible for 42% of the anthropogenic nitrogen losses (69 030 Mg) and 21% of the phosphorus (2590 Mg)
Table 1
Loadings of nitrogen and phosphorus from the Baltic drainage area to the Baltic Sea in 1995, by country (HELCOM, 1998)
Country Nitrogen Phosphorus
Mg yr−1 % of Total Mg yr−1 % of Total
Finland 66073 9 3561 9
Russia 84647 11 7108 19
Estonia 46468 6 1291 3
Latvia 91064 12 2184 6
Lithuania 36824 5 1405 4
Poland 214747 28 14208 38
Germany 21371 3 579 2
Denmark 68680 9 2598 7
Sweden 130872 17 4718 13
Total 760746 100 37652 100
losses from human activities. For Finland, the corre-sponding values were somewhat higher. From other countries in Europe, too, similar values for the share of anthropogenic losses attributable to agriculture are reported. In Germany, the proportions are estimated at about 44 and 28% of total nitrogen and phosphorus inputs to surface waters (Werner and Wodsak, 1995).
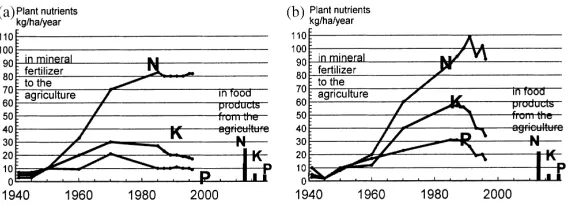
On the basis of official statistics it is possible to com-pare the increased use of artificial fertilizers and the quantities of plant nutrients in food products (Granst-edt, 1992a, 1995). From 1950 to 1980, the inputs of nitrogen, phosphorus and potassium in the form of in-organic fertilizer strongly increased in relation to their outputs in the form of agriculturally produced food-stuffs such as milk, meat and bread grain in Sweden and Finland (Fig. 1). Today, the input of nitrogen in artificial fertilizer to the agricultural systems is more than three times higher than the output of nitrogen in the form of agricultural food products such as bread grain, milk and meat. About 80% of the arable land in Sweden is used for producing animal fodder. This was also true in 1950, but over the last 40 years the number of animal-producing farms has steadily de-creased, while the number of animals per farm has in-creased. Meanwhile, the proportion of arable land used for grain-based animal production has increased, while the ley proportion of arable land has declined from about 45 to 38%. Cattle population has been nearly halved, whereas pig population has almost doubled (SNV, 1994). In some counties in southern Sweden the concentration of animal production is particularly marked (i.e., in Blekinge, Halland and certain parts of Skåne). Thus, for example, about 5% of Swedish farming enterprises account for 90% of the pork pro-duction (SCB, 1998). Farms without animals currently depend on artificial fertilizers to produce fodder for an-imals, which is then exported to the intensively man-aged animal farms, resulting in excessive loads of plant nutrients there. A similar trend towards regional spe-cialization in agriculture has been observed in Finland (Granstedt, 1996, 1999) and in other parts of the Eu-ropean Union (Kleinhanss et al., 1997; Oomen et al., 1998).
Fig. 1. Inputs of fertilizer nitrogen, phosphorus and potassium ( kg ha−1per year) and outputs of nitrogen, phosphorus and potassium (kg ha−1) in the form of animal- and plant-based food products (a) in 1995 in Swedish agriculture and (b) in 1993 in Finnish agriculture. Data for the period 1940–1995 and 1940–1993 for Sweden and Finland, respectively.
1800 and 1950, i.e., before the large-scale introduc-tion of artificial fertilizers and pesticides, agriculture in Sweden underwent a technical and biological revolu-tion aimed at meeting the increased need for food by the Swedish population which had grown from ca. 2 mil-lion to 7 milmil-lion during this period (Granstedt, 1998). Animal production was relatively equally distributed among farms, and the number of animals on each farm was determined by the farm’s fodder-production ca-pacity. In addition, the manure produced on a given farm was returned to the soil on the same farm. In other words, animal and crop production was integrated on each farm. The agricultural system was also self-sufficient with regard to fodder for horses. The export and losses of nitrogen were compensated through nitro-gen fixation in leys with clover and other nitronitro-gen-fixing crops in a crop rotation tailored to the needs and condi-tions on each farm. In this highly developed agricultural system the importation of external resources was very low, and by reconstructing plant nutrient balances from 1951 it was shown that nitrogen losses were about 50% lower than compared with today (SCB, 1997). In prin-ciple, the same description is applicable to Finland, the difference being that the agricultural revolution came about 50 years later there (Granstedt, 1999), and also to other countries in Western Europe. Kjaergaard (1994) has described in detail how agricultural production in Denmark was increased substantially by the introduc-tion of the legume clover as early as the 18th century.
The nutrient flows on various types of farms in dif-ferent regions of Sweden have already been determined for 1990 (Granstedt, 1995). The aims of this paper are (i) to determine the nutrient flows in different regions of Sweden in 1995, (ii) to compare the situation in
1995 with that in 1990, (iii) to explain the strong de-pendence on artificial fertilizers and the high losses of plant nutrients in agriculture today, and (iv) to describe how, with the technological resources available today plant nutrients could be handled more effectively at both the production and consumption levels, thereby minimizing losses of nitrogen and phosphorus to the environment.
Although the results and discussion presented here mainly relate to the situation in Sweden, the general conclusions reached are generally applicable to the whole Baltic Sea drainage area and also to agriculture in other parts of Europe with excessive surpluses of ni-trogen and phosphorus. The ultimate aim is to create the knowledge base needed for developing a strategy for changing Baltic agriculture systems so that losses of nitrogen and phosphorus can be reduced by 50% (hope-fully, only the first stage of a successive reduction) in the countries around the Baltic Sea.
2. Methods
2.1. Introduction of the NPK-flow model used
nutrient uptake in crops, harvested yield and recycling with crop residues, manure and urine on each field were combined with data on inputs in the form of fertilizers, nitrogen fixation, atmospheric pollution, imported fod-der and the export of food products. Mean values over all years were used to calculate a total balance for the farm, in kg N ha−1per year. Thereafter the model was
simplified so that it predicted the flows of N, P, and K without field studies (Granstedt, 1995). This sim-plified model was based on statistical data from each farm or statistical data allowing the model to be used for a group of farms at the municipality, landscape or
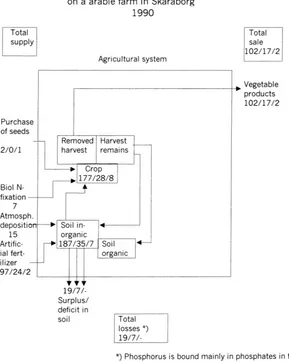
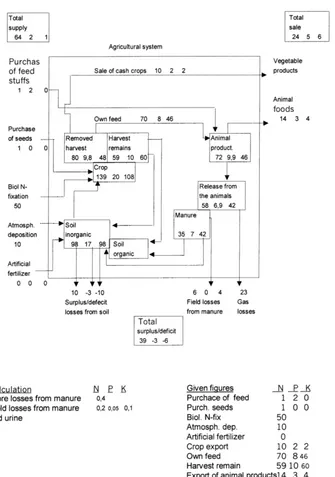
Fig. 2. Plant nutrient (N, P and K) flows, in kg ha−1per year, calculated for a farm in Skaraborg County that specialized in cereal production in
1990.
country levels. Such studies of NPK flows in Sweden were made in both 1990 (Granstedt, 1995) and 1995 (this paper).
2.2. Plant nutrient pools in the agriculture–community ecosystem
Data on plant nutrients are presented here in kg ha−1
and the community can be visualized as being com-posed of different pools: one soil pool, one plant pool, one domestic animal pool and one human pool. Plant nutrient flows between these different pools can be cal-culated, as can the budget.
This study is based on available Swedish official statistics (SCB, 1996a, b) and, at the farm level, also on information obtained from accounting records. Plant nutrient balances have been calculated at the farm, regional and county levels. In these calculations flows related to the production and human consumption of agricultural foodstuffs within the agriculture–commu-nity ecosystem have been analyzed. This ecosystem is not closed, since there is a constant input of plant nu-trients, e.g., in purchased fertilizers, feed, atmospheric deposition and biological nitrogen fixation. At the same time nutrients are exported from the system through the sales of crop and animal products, losses to the at-mosphere and water, etc. Plant nutrient stores within the different pools have not been estimated, nor has long-term variation been considered here. All calcu-lations are based on statistics from two representa-tive years, 1990 (study described earlier) and on those obtained in the 1995 study.
In this study, priority was given to studying animal production and crop production together as compo-nents of the agricultural system as a whole. Manure from animals is in this context viewed as a transforma-tion of nutrients within the system, and it is important to understand how each farm utilizes its own plant nu-trient resources. On farms (or within counties or coun-tries) with insufficient home-produced fodder for the animals there is an input of nutrients in purchased fod-der. In other studies in Europe (Brouwer et al., 1995) and Sweden (Hoffman, 1999) the animal production with purchase of fodder are excluded. In these stud-ies estimates have been made of the amount of manure used in agriculture as one component in the calculation of the nutrient input to agriculture.
2.3. Import of plant nutrients to the agro-ecosystem
Nitrogen is imported to the agro-ecosystem through bacterial nitrogen fixation by legumes, atmospheric deposition, the application of fertilizers and the pur-chase of fodder. Phosphorus and potassium can be made available for plant uptake through the application of fertilizers, the purchase of fodder or soil weathering.
In estimating the contribution of nitrogen fixation it was assumed that 25% of the ley area (SCB, 1996a) in all counties is in the form of a first-year ley with legumes producing 100 kg fixed nitrogen per hectare. Fodder peas and beans were assumed to fix 50 kg ni-trogen per hectare.
The figures for nitrogen deposition are based on measurements of wet and dry deposition made by the Swedish Environmental Research Institute (IVL) for the period 1990–1994 (SCB, 1996b), and the value used represents the net effect after evaporation of ammonia to the atmosphere from crops and the soil surface.
For counties, the import of plant nutrients in the form of purchased fodder was calculated as the difference between the total fodder requirements of the animals and the total amount of nutrients in fodder produced in each respective area.
For counties, the import of plant nutrients in food-stuffs was calculated as the difference between the production of the ecosystem and consumption by the population, based on average (1 year) consumption and the number of inhabitants. Calculations based on food consumption statistics (SCB, 1996a) show that the human community met 60% of its nitrogen and phos-phorus requirements and 40% of its potassium require-ments by consuming animal products, while the rest came from plant products.
To calculate the import of nutrients in form of purchased fodder and foodstuffs for the country as a whole, the official trade balance for agricultural prod-ucts was used (SCB, 1996a). For plant nutrients in an-imal food products, it was calculated that there was a balance between imports and exports and, for cereal products, that there was an export surplus for the year in question.
2.4. Transfer of plant nutrients within the system
In this study annual mineralization was assumed to correspond to the amount of organic nitrogen supplied every year through the decomposition of crop residues and animal manure. For the country as a whole, it is difficult to determine whether there has been a net in-crease or a net loss of organically bound nitrogen in the soil. Of course, there are also regional differences. In the NPK-balance for the whole of Sweden we con-sidered statistics for 1995 with regard to amounts of nutrients provided to the fodder industry in the form of slaughter waste and the spreading of wastes from com-munity sewage treatment plants on agricultural fields (Granstedt, 1992a).
2.5. Export
Significant losses of organically bound phosphorus occur when animal manure is spread under unsuit-able conditions. Losses of phosphorus and potassium through leaching and runoff were assumed to be around 10 and 5%, respectively, of the amounts supplied to the soil in the form of animal manure. Phosphorus in manure is mostly in organic form, and only a small part is soluble. It is assumed that about 30–40% of the nitrogen is lost through volatilization during storage and that 10–20% is lost in the field, although this fig-ure will vary depending on the species of animals and manure-handling techniques (Lundin, 1988; Claesson and Steineck, 1991). Calculation factors used are given in Figs. 3 and 4.
Soil nitrogen can disappear from the agro-ecosystem through denitrification, volatilization and leaching. Soil denitrification is higher in clay soils than in sandy soils. However, the proportion of nitrogen lost through leaching is larger in sandy soils than in clay soil (Gustavsson, 1996). Recently it was discovered that substantial losses of nitrogen can occur from wilt-ing organic material (Whitehead et al., 1988). These losses were included when calculating nitrogen losses from the soil. Losses of nitrogen were calculated as the sum of total nitrogen supplied to the soil in crop residues and manure and mineral nitrogen supplied in fertilizer minus the nitrogen taken up by the plants.
Losses of plant nutrients in the form of wastes cre-ated when processing food were calculcre-ated for
ani-mal products. The aniani-mal parts not used for human consumption (wastes from the slaughterhouses) were considered as lost. One part is used by the fodder-processing industry; i.e. the nutrients are recirculated in fodder. This recirculation is taken into account in the figures for Swedish counties (Figs. 5 and 6) and for Sweden as a whole (Fig. 7). These wastes from slaughterhouses are, like the wastes from the human population, a potential agricultural resource. N, P, and K contents of whole animal bodies are 2.6, 0.5 and 0.2% for pig and 2.5, 0.7 and 0.2% for cow, respec-tively (Kirchmann and Witter, 1991; Fagerberg and Salomon, 1992). Based on the relation between ani-mal production and actual consumption of the aniani-mal products (SCB, 1994), it was estimated that only 50% of the nitrogen, 57% of the phosphorus and 64% of the potassium are present in the consumed parts of the animal body. The rest is waste.
Figures describing plant nutrient flows in the country as a whole are based on the calculated nutrient budgets and nutrient flows in each county complemented with data on the export and import of agricultural products in 1990 and 1995. Data used in a calculation program are given in Fig. 7.
In the figures one animal unit (a.u.) corresponds to one dairy cow, two young cows,three sows, 10 fatten-ing pigs or 100 hens.
3. Results and discussion
3.1. Plant nutrient flow
3.1.1. Plant nutrient flow on the farm level
The total calculated budgets for nitrogen, phospho-rus and potassium on the farm level are shown in the flow diagram in Figs. 2–4. Plant nutrient flows are di-vided into three groups: import, transfer and export, and related to the different pools. The arrows refer to flows (import and export) from the soil, plant, animal and foodstuff pools as well as import and export in relation to the whole agro-ecosystem.
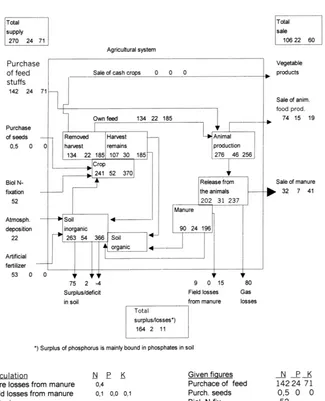
Fig. 3. Plant nutrient (N, P and K) flows, in kg ha−1per year, calculated in 1997 for a specialized dairy farm in Skåne County, 38 ha and 2 a.u. ha−1
(55 dairy cattle).
is exemplified in Fig. 2 and Table 2 with a farm in Skaraborg county with 0 a.u. ha−1. On the dairy farms
number two in Table 2 with 0.75 a.u. ha−1was the
sur-plus higher and the farms number three with
inten-sive pig production and number four, i.e., 2 a.u. ha−1,
Fig. 4. Plant nutrient (N, P and K) flows, in kg ha−1per year, calculated in 1995 for the Skilleby biodynamic farm which had not used mineral
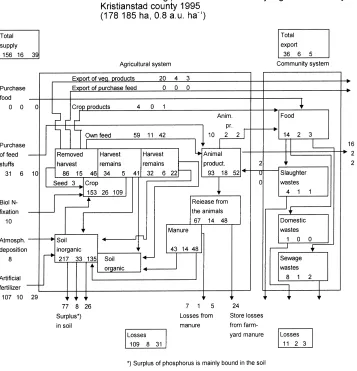
Fig. 5. Plant nutrient (N, P and K) flows, measured as kg ha−1arable land per year in the community-agroecosystem in Kristianstad County.
Surpluses/losses on the swine farm in 1990 (farm number three in Table 2) were assumed to be 166 kg N, 25 kg P, and 60 kg K ha−1. The assumption that ni-trogen losses were 166 kg or more was based on the assumption that no further net immobilization of ni-trogen occurred during the humus formation process as a consequence of there being no ley and grassland on this type of farm (Jansson, 1986). Today this farm must have access to an additional area (e.g., arable land on a nearby farm) on which it can spread the manure. Even for a representative dairy farm (Table 2 and Fig. 3) in the dairy district of Skåne in 1997 (Sandgren et al., 1999), which sold some of its manure in
com-pliance with Swedish regulations to limit the intensity of animal production, estimated losses of nitrogen were very high (164 kg N ha−1).
The farm described in Fig. 4 (farm number five in Table 2) is a biodynamic farm, which has not used fer-tilizers or chemical pesticides since 1967 (Granstedt, 1992a). This farm is representative of farms in the cen-tral part of Sweden, with clay loam, fairly dry climatic conditions for Sweden (annual average precipitation 550 mm and yearly average temperature 6◦C), and a
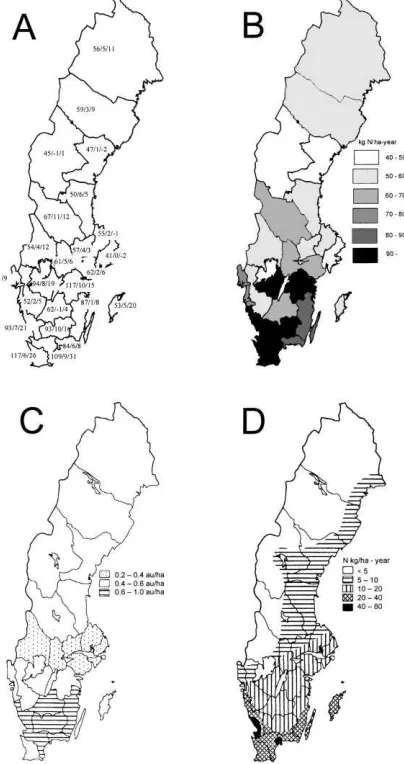
success-Fig. 6. A. Surplus of nutrients (N, P and K), in kg ha−1arable land per year, calculated for 1995 as the difference between amounts im-ported and exim-ported. B. Total nitrogen losses in different counties of Sweden. C. The Swedish counties, grouped according to their in-tensity of animal production. 1 a.u. equals either one dairy cow, two young cows,three sows, 10 fattening pigs or 100 hens. D. Levels of nitrogen leaching in different parts of Sweden.
fully run a farm that is self-sufficient in terms of plant nutrients and minimize the losses of plant nutrients. Nitrogen flows on the farm (at the soil, crop, field and whole-farm levels) were studied by the author over a 7-year period between 1981 and 1987 (Granstedt, 1990, 1992a). Production, calculated in plant nutrients in bread grain and animal products from this farm, is
about the same as the average for the agricultural sec-tor, but animal production is based more on grass and clover/grass than on the average farm.
3.1.2. Plant nutrient flows for counties
The calculated budgets for nitrogen, phosphorus and potassium for a county are exemplified in the flow dia-gram in Fig. 5. Such budgets is done by the author for each of the 23 counties in Sweden for 1990 (Granstedt, 1995) and 1995 (this paper). The arrows refer to flows (import and export) from the soil, plant, animal and foodstuff pools as well as import and export in relation to the whole community-agro-ecosystem.
There is great variation between counties in terms of the import of plant nutrients, plant nutrient contents of foodstuffs, and nutrient surpluses and losses. In Fig. 5 the plant nutrient flows are specified for Kristianstad County, where losses of nitrogen are higher than the average for Sweden. Nutrient inputs in the form pur-chased feedstuffs (31 kg N ha−1) and artificial
fertil-izers (107 kg N ha−1) supplied to the county are also
higher than the average for Sweden, and levels for 1995 and 1990 are similar. Table 3 shows the relations be-tween the input and output of plant nutrients for three counties representing a low, average, and high intensity of animal production, respectively. Surplus and losses are normally relatively higher for the agricultural sys-tems compared with that from the community system. However, in counties where the ratio of agricultural area to inhabitants is lower, losses from the commu-nity system are higher.
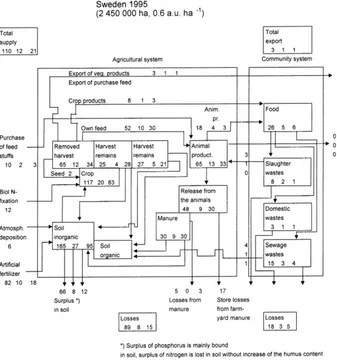
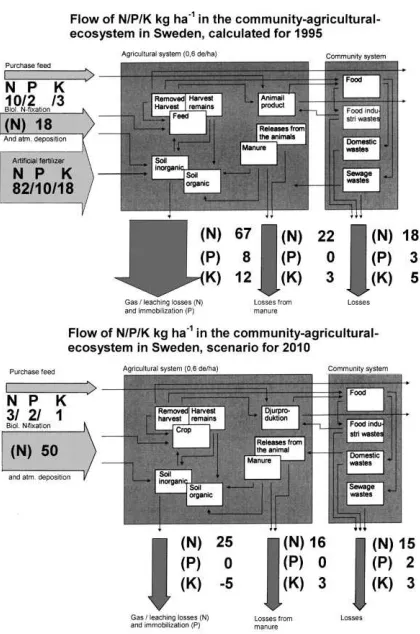
Fig. 7. Plant nutrient (N, P and K) flows, measured as kg ha−1arable land used in 1995 in the Swedish community-agroecosystem.
Table 2
Supply, export and surplus of N, P and K, in kg ha−1, in three counties of Sweden with 0.2, 0.4 and 0.8 animal unit/ha
County Animal Supply to the agricultural Export from the Losses from the Food consump-unit/ha system agricultural system agricultural tion in community
system system Purchase of Biol. Atmosph. Artificial Animal Crop
feedstuffs N-fixation deposition fertilizer products products
Västmanland 0.2 9/0/0 7 5 82/11/11 7/1/1 35/7/7 61/4/3 19/4/5
Kopparberga 0.45 22/3/3 16 5 69/15/19 16/3/3 12/2/4 84/13/15 42/9/11 Kristianstad 0.8 33/6/10 9 8 107/10/29 26/4/4 22/4/3 109/9/31 14/2/3
Table 3
Supply, export and surplus of N, P and K (N/P/K) in kg ha−1year−1, on five farms describing five farm types in Sweden: cereal farm, combined dairy and cereal farm, pig farm, dairy farm and ecological farm
Farm type a.u.ha−1 Supply to the farm Total supply Export from the farm Total export
Surplus
Feed, seed Biol. N-fix. Deposition Fertilizer Crop pr. Anim. pr.
Cereal farm 0 2/0/1 7 15 97/24/20 121/24/20 102/17/25 102/17/25 19/7/-4 Comb. farm 0.75 15/6/19 17 15 91/5/0 140/11/20 27/5/7 26/6/7 53/11/14 87/0/6 Pig farm 2 137/43/68 4 15 103/0/0 259/43/68 6/1/1 87/17/7 93/18/8 166/25/60 Dairy farm 2 142/24/71 52 22 53/0/0 270/24/71 106/22/60 106/22/60 164/2/11
Ecol. farm 0.6 2/2/0 50 10 54/2/1 10/2/2 14/3/4 24/5/6 39/-3/-6
nitrogenous compounds during each of the handling steps.
A similar relationship between the intensity of ani-mal production and high losses of nutrients in regions is documented from Finland, other Nordic countries (Rekolainen and Leek, 1996) and other countries of Europe (Brouwer and Hellegers, 1997). For example, owing to the intensity of crop production and the con-centration of livestock, the surplus of nitrogen is signifi-cantly higher (120–150 kg ha−1) in the north of
Germany than in the rest of that country (Kleinhanss et al., 1997).
3.1.3. At the country level — Sweden
The calculated budgets and nutrient flows for nitrogen, phosphorus and potassium for the whole community-agro-ecosystem Sweden 1995 are shown in the flow diagram in Fig. 7. A comparison of the nitro-gen surplus in the agricultural system for 1995 (Granst-edt, 1995) with that in 1990 shows that it increased from 86 to 89 kg N ha−1. Despite the decline in the amount of
agricultural land under cultivation, the total difference between the input and output of nitrogen increased dur-ing this time from 180 000 to 191 000 tons accorddur-ing to Statistics Sweden (SCB, 1998). As for phosphorus, there was a minor decline in the surplus from 1990 to 1995, from 10 to 8 kg P ha−1
Of the total nitrogen imported to the agro-ecosystem, 20% is exported from the agro-ecosystem in the form of protein nitrogen in foodstuffs. The difference between import and export (80%) represents the surplus which is either immobilized in the soil or lost to the environment (mainly to water and air). Although about two thirds of the phosphorus is surplus, only a smaller part is lost to the environment. Of the potassium, 70% is surplus
and lost on its way through the agro-ecosystem. The average leaching of nutrients from arable land in Swe-den has been estimated at 48 000 tons N per year and 621 tons P per year, on the basis of measurements of drainage water (Gustavsson, 1996). Retention by lakes and watercourses is assumed to be 50% for nitrogen and 25% for phosphorus. Calculations based on these figures indicate that, on average, leaching should ac-count for 30% of the total losses of nitrogen from the soil (67 kg N ha−1in an assumed steady state in the
humus) or 20 kg ha−1 per year (Löfgren and Olsson,
1990). In addition, it is assumed that another 5 kg ha−1
is lost from the rooting zone, with the water passing through the drainage system, penetrates deeper down into the soil and reaches groundwater (Brink, 1990). About 65% of the calculated total losses of nitrogen from the soil pool are lost to the atmosphere. The prin-cipal causes of losses of soil nitrogen to the atmosphere are denitrification and volatilization. Of the surplus 8 kg P ha−1only an average of 0.25 kg P ha−1is lost
through leaching of organic and inorganic phospho-rus compounds and most is bound to insoluble organic and inorganic phosphorus compounds stored in the soil. This surplus accumulates year after year in the soil and can be assumed to be a potential source of losses to the environment for a long time to come.
The fractions of plant nutrients in foodstuffs con-sumed within the country that end up in slaughterhouse wastes, domestic wastes (wastes from household and food industry) and sewage wastes are shown in Fig. 7 (the community system). Between 30 and 60% (11 kg N, 3 kg P and 2 kg K ha−1) of the plant nutrient
con-tents of the food products (26 kg N, 5 kg P and 6 kg K ha−1) end up in these first two fractions. Of the total
is found in the sewage fraction. Other studies involving calculations of nutrients from food consumption in the sewage fraction in Sweden produced the same results (Kirchman, 1998). One part of the sewage fraction was recycled to agriculture in 1995. This year the farmers’ organization has recommended farmers not to accept municipal waste on arable land. Only the first two men-tioned fractions can be recycled to agriculture without risking the kind of contamination found in the sewage system today.
A comparison with other countries shows that the surplus of nitrogen (89 kg N ha−1per year) is the same
as in Finland (89 N kg ha−1per year in 1993) (Granst-edt, 1999) and lower than in our neighboring countries Denmark (129 ha−1per year in 1990/1991) (Brouwer
et al., 1995) and Norway (135 kg ha−1 per year in
1988–1991) (Bleken and Backen, 1997). In these other countries the use of artificial fertilizer was higher than in Sweden during the years in question (Finland 93 kg ha−1, Denmark, 142 kg ha−1and Norway 110 kg
ha−1) and the difference between inputs and outputs of
nitrogen the same as Finland or higher than in Sweden. In Denmark imported fodder is an important input of nitrogen to the system.
3.2. Excessive surpluses and losses of plant nutrients from agriculture — reasons and proposed measures to remedy the problems
3.2.1. The imbalance between plant and animal production
The imbalance between plant and animal production at the country level as well as regionally and locally is one important factor contributing to the mismanage-ment of plant nutrients. This becomes clear when com-paring a swine farm (Table 3) or a specialized dairy farm with a cereal-producing farm without animals (Figs. 2 and 3). Plant nutrients are supplied as artificial fertilizer to the cereal farms, where they are converted to foodstuffs that are delivered to the animal producers. There they accumulate and to a large extent are lost.
The losses of plant nutrients in agriculture accounted for in this investigation were shown to differ greatly be-tween counties and regions, as well as within counties and farms. The grouping of counties based on their an-imal production intensity shows that the losses of plant nutrients are highest where animal production intensity
is high. At the same time, the requirements for and use of fertilizers are highest in counties with few animals. About 25% of the nitrogen losses in the Swedish agri-cultural system can be attributed directly to the animals and their excrement (manure and liquid manure) with mainly emissions of nitrogen compounds (NH4-N) to the atmosphere. Losses of nitrogen compounds from soil are also higher on the animal farms and are strongly related to animal production and its intensity.
Plant nutrient balances calculated at the country level show that substantial surpluses develop which result in losses of nitrogen as well as phosphorus and potassium (Fig. 2). Losses of potassium are not an environmen-tal problem, but do represent a cost for the agricultural system as well as a waste of this limited resource. Some 80, 65 and 70% of the nitrogen, phosphorus and potas-sium, respectively, supplied to the agricultural system ends up in surplus and is released to the surrounding air or water or is immobilized in the soil.
A comparison with other countries shows that the above description is applicable to farms and regions in Finland (Granstedt, 1999) and in the rest of Eu-rope where agriculture is technically more developed. Oomen et al. (1998) show that the environmental ni-trogen problem connected with agriculture in the Eu-ropean Union (EU) is related to recent segregation of animal and crop production. This specialization can also be seen not only between farms, but also between regions, as was shown here in the case of Sweden. In principle, manure produced by cows, pigs and poultry should be returned to the regions where their feed was produced.
3.2.2. Plant nutrient surplus at the farm level Examples at the farm level show that fertilizers are applied on livestock farms even through plant nutrients accumulate in excess, in the form of animal manure, on these farms. This holds true for the animal-producing farm with 0.75 a.u. ha−1(Table 2) and a higher degree
of within-farm plant-nutrient recycling, as well as for farms with an animal production intensity of more than 1.0 a.u. ha−1(farm number three and four in Table 2 and Fig. 4).
The annual use of manure led to a high release of min-eral nitrogen on these farms, much of which is lost if the plants do not take it up. This is reflected in the bal-ance accounts presented here and confirmed in studies of mineralization on farms practicing intensive animal husbandry (Granstedt, 1990). During a transitional pe-riod, a high animal-production intensity will lead to a rise in the immobilization of nitrogen in the form of an increase in soil humus content, but will later lead to increased mineralization. Studies of mineralization carried out in long-term experiments comparing the ef-fects of animal manure with those of artificial fertilizer have shown that the most important factor is the con-tent of total nitrogen in the animal manure (Granstedt, 1997). Nutrient management advice based only on the content of mineral nitrogen in animal manure has led to increased losses of nitrogen from farms with intensive animal production in Sweden.
3.2.3. The input of plant nutrients to agriculture and their losses from the agricultural system can be minimized
Fig. 5 presents a representative example from central Sweden of the plant nutrient flows on a farm managed according to the principles of ‘recycling eco-logical agriculture’, which preclude the use of inor-ganic fertilizers. The yield on this farm is comparable to the Swedish average, but total losses of nitrogen are about half as high as the average in Sweden. This type of management requires that the level of animal pro-duction on a given farm be adjusted on the basis of the farm’s crop production. The optimum level of intensity of animal production for a given farm can be calculated based on its fodder production. Due to the good bal-ance between animal husbandry and plant production (0.6 a.u ha−1 is optimum in this part of Sweden) the
net outflow of plant nutrients is so low that it can be compensated for through weathering, small inputs of fodder and nitrogen fixation by leguminous ley crops (Granstedt, 1992b). In studies done in Finland by the author similar results were obtained for Finnish condi-tions (Granstedt, 1996, 1999). Oomen et al. (1998) have described the benefits of mixed farming in the Nether-lands, compared with traditional agriculture, illustrated by the favorable nitrogen balances of two designed prototypes where arable, dairy and sheep farming are integrated to a high degree.
Effective recycling must be combined with the best techniques available for conservation in both the animal-manuring system and the crop–soil system. The reported farm studies (Granstedt, 1992a, 1995) show that, on each farm or group of co-operating farms, it is essential that nutrients in manure be effectively uti-lized in relation to the needs of the different crops in the crop rotation.To develop such environmentally sound farms there is a need for more case studies of ecologi-cal farms with a high degree of plant nutrient recycling which could serve as good examples for demonstration and extension services in different regions of a country related to climatic, soil, geographical and economical conditions.
Assuming that these principles are followed it is pos-sible to roughly predict the regional breakdown of crop and animal production in Sweden in a future, ecolog-ically based, resource-conserving agricultural system. Animal production needs to be decreased in the south-ern regions in Sweden, while a corresponding increase is required in central Sweden. In the areas around Kris-tianstad, Blekinge, Kalmar, and Halland, animal hus-bandry must be halved as well as decentralized within each region in order to achieve a balance between plant production and recycled animal manure.
By integrating crop and animal production it is possi-ble to achieve effective utilization of the plant nutrients in manure, minimize the input of nutrients in the form of artificial fertilizers, minimize the surplus of nutrients and, as a consequence, minimize losses of nitrogen and phosphorus for whole Sweden (Fig. 8).
In a recycling-based agricultural system not every enterprise needs to produce both animal and plant prod-ucts. For instance, forms of co-operation could be es-tablished between neighboring farms whose products complement one another. It would also be desirable to increase the extent to which plant nutrients exported from the agricultural system to the community are re-turned to the farms. This recycling should also include quality tested wastes from the food industry. Special restrictions with animal and crop production must also be accepted in the coastal regions.
commer-Fig. 8. Plant nutrient (N, P and K) flows, in kg ha−1, in arable land in 1995 in the Swedish community-agroecosystem and in a scenario for 2010 with halved losses of nitrogen resulting from increased in-tegration of crop and animal production. This increase in inin-tegration allowed nitrogen to be more effectively recycled within the system and its input to be halved.
cial production of fertilizer would be reduced. Such a converting for the whole agriculture in Sweden should need more grassland with clover in the crop rotation in the southern regions and an increased share of meat from ruminants as a consequence.
4. Conclusions
Agriculture has contributed substantially to an in-crease in nutrient leaching. Ultimate aim is to create the knowledge base needed for developing a strategy for changing Baltic agriculture systems so that losses of nitrogen and phosphorus can be reduced by 50%
(hope-fully, only the first stage of a successive reduction) in the countries around the Baltic Sea.
Based on the results of these studies, it was con-cluded that the local and regional specialization of farms is one important reason for the high losses of plant nu-trients: one type of farm specializes on crop production based on the use of artificial fertilizers, while the other type specializes on animal production with a high in-put of purchased fodder and a surplus of plant nutri-ents in the form of manure from the animals. The crop production farm mainly produces fodder. This fodder and the plant nutrients it contains are exported to the intensive animal farms where the manure and urine with plant nutrient accumulate in surplus, causing plant nutrient losses to the environment. These two types of farms are concentrated in different regions of the country.
An additional reason for the high surplus and losses of plant nutrients is that farms with a high intensity of animal production also import artificial fertilizer rather than effective use of the own animal manure. Nutrient management should also take the total nitrogen content in manure in account.
A comparison of the nitrogen surplus in the agricul-tural system in 1995 with that in 1990 shows that the surplus of nitrogen increased and the surplus of phos-phorus decreased only a little.
It is exemplified that through integration of crop and animal production on a farm is it possible to maximize the effectiveness in using plant nutrients in manure, minimize the input of plant nutrients, minimize the surplus of plant nutrients and, as a consequence, min-imize losses of nitrogen and phosphorus. To minmin-imize the high surplus and losses of plant nutrientsfromthe agricultural system the input of nutrientstothe system needs to be reduced. This can be solved by increasing recycling within the system.
By applying these agricultural principles throughout the Baltic region it should be possible to halve nitro-gen losses and minimize losses of phosphorus, thereby meeting the goals set by the states of the region which were presented in the introduction to this paper.
What is clear is that more studies are needed, es-pecially at the farm level, to develop the optimal im-plementation of effective recycling-based agriculture under different climatic and soil conditions, in Swe-den, the other countries of the Baltic region and in the rest of Europe where there are similar problems to be solved. Another question is how to adopt new strate-gies for farming systems within the current economic and social structure of agriculture in countries with an established agricultural structure involving a different type of agricultural specialization, or in other coun-tries like Poland, which to some extent have an older agricultural structure which has yet to undergo major change.
Acknowledgements
This study was supported by funds from the Council for Forestry and Agricultural Research and the Research Foundation of Anna Svennedal. The author gratefully acknowledges the important technical assis-tance of Paul Granstedt. I am very grateful for the valu-able contributions of Lotten Westberg to this work.
References
Biermann, S., 1995. Flächendeckende, räumlich differenzierte Untersuchung von Stickstoffflüssen für das Gebiet der neuen Bundesländer. Der Landwirtschaftlichen Fakultät der Martin-Luther-Universität Halle Wittenberg, Dissertation, Verlag Shaker (in German).
Bleken, M.A., Backen, L.R., 1997. The nitrogen cost of food production: Norwegian society. Ambio 26, 134–142.
Brink, N., 1990. Land use changes in Europe. In: Brower, F.M. (Ed.), Process of Change, Environmental Transformation and Future Patterns. Kluwer Academic Publishers, London.
Brouwer, F., Hellegers, P., 1997. Nitrogen flows at farm level across European Union Agriculture. In: Romstad, E., Simonson J., Vatn (Eds.), Controlling Emissions in European Agriculture. pp. 11–26.
Brouwer, F.M., Godeschalk, F.E., Hellegers, P.J.G.J., Kelholt, H.J., 1995. Mineral Balances at Farm Level in the European Union. Onderzoekelseverslag 137, Agricultural Economics Research Institute (LEI-DLO), The Hague, 141 pp.
Claesson, S., Steineck, S., 1991. Växtnäring, hushållning-miljö. Sveriges Lantbruksuniversitet, speciella skrifter 41, Uppsala (in Swedish).
Enell, M., 1996. Utsläpp från olika källor. Belastning av kväve och fosfor på Östersjön — svenskt och internationellt perspektiv. In: Kväve och fosfor i mark och vatten — en ödesfråga inför 2000-talet. Seminarium den 22–31 mars 1995. J. R. Swedish Acad. Agric. For. KSLAT 135 (3), 109–118 (in Swedish). Fagerberg, B., Salomon, E., 1992. Dataprogrammet NPK FLO,
Handledning för beräkning av växtnäringsbalanser på gårds och marknivå Växtodling 41 (Users manual for the computer programme NPK FLO for calculations of plant nutrient balances on the farm and soil levels). Swedish University of Agricultural Sciences, Department of Crop Production Science, Uppsala (in Swedish with English summary).
Frissel, M.J., 1977. Mineral nutrient cycling in agro-ecosystems. Agro Ecosystems 4, 27–32.
Granstedt, A., 1990. Fallstudier av kväveförsörjning i alternativ odling (Case studies on nitrogen supply in alternative farming). Alternative Agriculture, 4. Dissertation, Swedish University of Agricultural Sciences. Research Committee for Alternative Agriculture, Uppsala (in Swedish with English summary). Granstedt, A., 1992a. Case studies on the flow and supply of nitrogen
in alternative farming. I. Skilleby-Farm I 1981–1987. Biol. Agric. Hortic. 9, 15–63.
Granstedt, A., 1992b. The potential for Swedish farms to eliminate the use of artificial fertilizers. A basic discussion centered around data on plant-nutrient conservation in Sweden between 1950 and 1980 and on plant-nutrient balances in conventional and alternative farming. Am. J. Alternative Agric. 6, 122–131. Granstedt, A., 1995. Studies on the flow supply and losses
of nitrogen and other plant nutrients in conventional and ecological agricultural system in Sweden. In: Proceedings of the international workshop Nitrogen leaching in ecological agriculture, 11–15 October 1993. The Royal Veterinary and Agricultural University, Copenhagen, Denmark. Biol. Agric. Hortic. 11, 51–67.
Granstedt, A., 1996. Kretsloppsjordbruk enligt principerna för ekologisk odling. Agrofood 1996. Tampere. Konferensrapport (in Swedish).
Granstedt, A., 1997. Experiences from Long term studies in Nordic countries to understanding the conversion process and development of organic farms. In: Proc. 2nd International Workshop of the European Network for Scientific Research Co-ordination in Organic Farming (ENOF). Steps in the Conversion and Development of Organic Farms. 3–4 October, 1996, Barcelona.
Granstedt, A., 1998. Ekologisk odling i det framtida kret-sloppssamhället. Naturskyddsföreningens förlag. 88 pp (in Swedish).
Granstedt, A., 1999. Ekologinen Maatalous ja Kierrätys. Biodynaaminen yhdistys, Helsinki, 77 pp (in Finnish). Granstedt, A., Westberg, L., 1993. Flöden av växtnäring i jordbruk
och samhälle. Aktuellt från lantbruksuniversitetet, 416, Uppsala, 32 pp (in Swedish).
ödesfråga inför 2000-talet. Seminarium den 22–23 mars 1995. J. R. Swedish Acad. Agric. For., KSLAT 135 (3) 47–59 (in Swedish).
Hansson, A., 1987. Roots of arable crops: Production, growth dynamics and nitrogen content. Doctoral thesis, Swedish University of Agricultural Sciences, Department of Ecological and Environmental Research, Report 28, Uppsala.
HELCOM, 1998. The third Baltic Sea Pollution Load Compilation (PLC-3). Baltic Sea Environ proc. No. 70.
Hoffman, M., 1999. Assessment of leaching loss estimates and gross load of nitrogen from Swedish arable Land in Sweden. Doctoral thesis, Swedish University of Agricultural Sciences, Agraria 168. Jansson, S.L., 1983. Kväve och fosforbudget för två regioner i Sverige (Malmöhus och Värmlands län) med särskild hänsyn till jordbrukets roll (Nitrogen and phosphorus budgets for two counties in Sweden with special reference to agricultural conditions). J. R. Swedish Acad. Agric. For. KSLAT 122, 293–302 (in Swedish with English summary).
Jansson, S.L., 1986. Markbiologi-växtproduktion-bördighetsstudier. Skörderesterna som bördighetsfaktor (Soil biology–plant production–soil fertility studies. The crop residues as a component of soil fertility). J. R. Swedish Acad. Agric. For., KSLAT Supplement 18, 9–31 (in Swedish with English summary).
Jansson, B.-O., 1997. The Baltic Sea: current and future status and impact of agriculture. Ambio 26, 424–431.
Kaffka, S., 1984. Thirty years of energy use, nutrient cycling and yield on a self-reliant dairy farm. In: Edens, T.C., Fridgen, C., Battenfield, S. (Eds.), Sustainable Agriculture & Integrated Farming Systems. Michigan State University Press, pp. 143–158. Kirchman, H., 1998. Phosphorus flows in Swedish society related to agriculture. In: Phosphorus balance and utilization in agriculture-towards sustainability. J. R. Swedish Acad. Agric. For., KSLAT 135 (7), 145–156.
Kirchmann, H., Witter, E., 1991. Växtnäringsmängder i husdjursgödsel och tätortsavfall-potentiell recirkulation. Lantbru-kskonferensen 1991. SLU-info rapporter. Allmänt 175 (in Swedish).
Kjaergaard, T., 1994. The Danish Revolution, 1500–1800; An Ecohistorical Interpretation. Cambridge University Press, UK, 314 pp (David Hohnen, Trans.).
Kleinhanss, W., Becker, H., Schleef K.-H. 1997., Impacts of Agri-environmental Policy Measures on Nitrogen Emissions
from Agriculture. In: Romstad, E., Simonson, J., Vatn (Eds.), Controlling Emissions in European Agriculture. pp. 137– 155.
Lundin, G., 1988. Ammoniakavgång från stallgödsel. Jordbruk-stekniska Institutet, JTI-rapport, 94, Uppsala (in Swedish). Löfgren, S., Olsson, H., 1990., Tillförsel av kväve och fosfor till
vattendrag i Sveriges inland. Swedish Environmental Protection Agency, Report 3692, 100 pp (in Swedish).
Oomen, G.J.M., Lantinga, E.A., Goewie, E.A., Van der Hoek, K.W., 1998. Mixed farming systems as a way towards a more efficient use of nitrogen in European Union agriculture. Environ. Pollution 102, 697–704.
Rekolainen, S., Leek, R. (Eds.) 1996. Regionalization of erosion and nitrate losses from agricultural land in Nordic Countries. Tema Nord 1996, 615, 68 pp.
Sandgren, P., Svensson C., Sällvik, K., 1999. Växtnäringsbalans på mjölkgårdar i Södra Sverige. Swedish University of Agricultural Sciences. SSJ-Info 17, Alnarp (in Swedish).
SCB, 1996a. Yearbook of Agricultural Statistics. Official Statistics of Sweden, Stockholm.
SCB, 1996b. The Natural Environment in Figures. Official Statistics of Sweden, Stockholm.
SCB, 1997. Kväve och fosforbalanser för svensk åkermark och jordbrukssektor 1995 (Nitrogen- and phosphorus balances in arable land and agricultural sector in Sweden 1995). Statistics Sweden, 34 pp (in Swedish with English summary).
SCB, 1998. Yearbook of Agricultural Statistics. Official Statistics of Sweden, Stockholm.
SNV, 1994. Eutrophication of soil, fresh water and sea. The Environment in Sweden Status and Trends. Swedish Environmental Protection Agency, Report 4244.
Stålnacke, P., 1996. Nutrient loads to the Baltic Sea. Linköping Studies in Arts and Science 146. Dissertation, Linköping University.
Swedish National Food Administration, 1993. Food Composition Tables — energy and nutrients. Uppsala.
Werner, W., Wodsak, H.P., 1995. The role of non-point sources in water pollution-present situation, countermeasures, outlook. Water Sci. Technol. 31 (8), 87–97.