THE PROCESS OF DIGITIZING OF OLD GLOBE
K. Ambroˇzov´aa, J. Havrlanta, M. Talicha, O. B¨ohma a
Research Institute of Geodesy, Topography and Cartography, v.v.i, ´Usteck´a 98, 250 66 Zdiby, Czech Republic -(klara.ambrozova, jan.havrlant, milan.talich, ondrej.bohm)@vugtk.cz
Commission V, WG V/2
KEY WORDS:globes, digitizing device, digital model, complex adjustment, 2D and 3D visualisation, cultural heritage
ABSTRACT:
This paper describes the process of digitalization of old globes that brings with it the possibility to use globes in their digital form. Created digital models are available to the general public through modern technology in the Internet network. This gives an opportunity to study old globes located in various historical collections, and prevent damage of the originals. Another benefit of digitization is also a possibility of comparing different models both among themselves and with current map data by increasing the transparency of individual layers.
Digitization is carried out using special device that allows digitizing globes with a diameter ranging from 5 cm to 120 cm. This device can be easily disassembled, and it is fully mobile therefore the globes can be digitized in the place of its storage. Image data of globe surface are acquired by digital camera firmly fastened to the device. Acquired image data are then georeferenced by using a method of complex adjustment. The last step of digitization is publication of the final models that is realized by two ways. The first option is in the form of 3D model through JavaScript library Cesium or Google Earth plug-in in the Web browser. The second option is as a georeferenced map using Tile Map Service.
1. INTRODUCTION
Old globes are an important part of cartographic heritage as well as the other old cartographic products such as maps or atlases. The most important reason for converting these unique exhibits into digital form is to protect the originals from damage, and en-able the public to study the globes without visiting the archives, museums or libraries where the originals are stored.
Although the globes are cartographic products, and it is neces-sary to fully respect their cartographic characteristics during the digitization, it is not possible to use the same technologies and methodologies as for digitization of old maps and atlases. There-fore it is necessary to develop new ones and put it into practice. Currently, there are globally about 10 projects that deal with the digitization of old globes. One of the most actual and largest projects is the Virtual Globes Museum (Gede, 2009) created at the university in Budapest. As basis for digitization were used both globe gores and real globes. Another important project is a digital globes of Gerardus Mercator created at the Ghent Univer-sity (Stal et al., 2012). In this project were tested four different techniques for digitizing, all based on the use of high-resolution images. It is also worth to mention Coronelli’s virtual globe (Adami and Guerra, 2008) which was created by 3D laser scan-ning at the University IUAV in Venice.
2. ACQUISITION OF DIGITAL DATA
During image acquisition it is necessary to abide the following conditions. The position of globe should be fixed while the ro-tation of globe around its axis must be enabled. Likewise, the position of camera should be fixed. These conditions are met thanks to the construction of special digitizing device. During photographing it is also necessary to pay attention to the proper and constant light conditions that affect the image quality and color consistency of model.
For the purposes of digitization was developed a new special mo-bile device (Figure 1). The device was produced in collaboration
with a specialized company on the basis of predefined techni-cal requirements. This device enables gentle and safe handling of globes, and contributes to the acquisition of high-quality and accurate data by ensuring stable conditions during digitization. Thanks to its adjustability this device allows digitalizing globes with diameter from 5 cm to 120 cm.
Figure 1. Device for digitizing globes
surface.
The process of image acquisition is as follows. First, the globe is rotated by a constant angle around its vertical axis while a series of images covering the meridian zone is taken. After that, a single rotation of globe by a constant angle around its horizontal axis is done, and series of images of the next meridian zone is taken. The main factor for determining the size of the photographed area is the size of the digitized globe. For smaller globes with diameter up to about 15 cm the size of areas is in most cases 20◦latitude x 20◦longitude. For the largest globes the size can be reduced to 5◦latitude x 5◦longitude. This implies that the total number of images for one globe is in the range from 150 to 2000. To maintain an overview, about which parts of the globe are already captured, each image is named by latitude and longitude of geo-graphical grid intersection lying in the upper right corner of the photographed area.
3. PROCESSING OF DIGITAL DATA
3.1 Tie points collection
For purposes of georeferencing and other calculations it is im-portant to define tie points with known approximate geographical coordinates. The best solution is to use points in the intersec-tions of geographical grid, but it is not absolutely necessary. Any other points with known geographical coordinates can be chosen as tie points. For collecting tie points can be used three different methods.
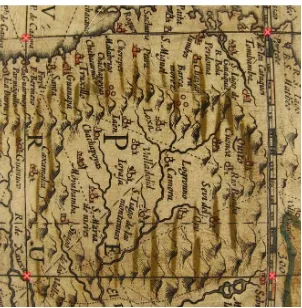
3.1.1 Manual collection: The tie points are in the intersec-tion of geographical grid and each image contains at least 4 points. These points are the intersections of meridians and par-allels bounding area of the image that will be used for digital model. This work is fairly time-consuming, because sometimes it is necessary to collect thousands of points, and it is also neces-sary to determine points with the same geographical coordinates in each image exactly in the same place.
Figure 2. Manually determined tie points
3.1.2 Semiautomatic collection: The tie points selection can be simplified by image correlation. The principle is that every intersection of geographical grid is manually marked only in one image, and in the other images this point is automatically found by image correlation. This reduces the amount of manual work approximately to a quarter. For correlation is used the Pearson’s correlation coefficient (CIMT, 2008)
rxy= n
P
xiyi−PxiPyi
p
nP
x2
i−(
P
xi)2
·
p
nP
y2
i −(
P
yi)2, (1)
where n= number of pixels of sample,
xi= color value of sample in ith pixel,
yi= color value of target in ith pixel.
A problem arises here, because the sample and the target must be sufficiently similar. That means they have to have the same rotation and scale, but this condition is not met for the source images. This problem can be solved by finding the approximate elements of exterior orientation for each image (see chapter 3.2). Using these parameters is obtained a direct relationship between image coordinates and geographical coordinates. If we know this relationship, we can transform the sample and the target image into the same map projection, and perform the correlation in this projection.
One of the possible map projections suitable for correlation is azimuthal projection in general position (Snyder, 1987). In this case the grid intersection in question is chosen as cartographical pole.
3.1.3 Automatic collection: This method uses interest points in the image. This approach was developed specifically for globes without geographical grid, but is currently used for all globes. There are many methods for detection of interest points. The most widely used in practice is Harris corner detector (Harris and Stephens, 1988). Using this detector yield sets of points for all images. Corresponding points in these sets are then selected by image correlation. For correlation is used the Pearson’s correla-tion coefficient (1). In this way supposedly corresponding points in images are found but not all points really correspond. Some points are determined incorrectly. These points are excluded by using the RANSAC algorithm (Chum, 2005) that estimates pa-rameters of a mathematical model from a set of observed data which contains outliers.
Figure 3. Automatically determined tie points
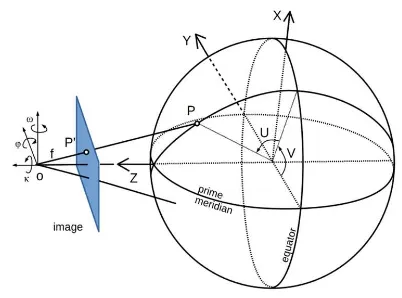
3.2 Calculation of the exterior orientation elements
For further calculations it is necessary to obtain the elements of exterior orientation for each image. This elements help us to de-fine the direct mathematical relationship between image coordi-natesx,yand geographical coordinatesU,V.
The elements of exterior orientation are 3 angles of rotation of imageω,ϕ,κand spatial coordinates of projection centerX0,
Figure 4. Scheme of photographing the globe
First, it is necessary to obtain approximate values of the elements of exterior orientation. The elements are obtained in two steps. In the first step the elements are determined by using the approx-imate latitude and longitude of image center which can be iden-tified from geographical grid. From approximate coordinates of image center is calculated the approximate rotation matrix (2). This rotation matrix is valid only if the globe is placed into the digitization device with North Pole on the right side from the view of observer.
where US= latitude of image center,
VS= longitude of image center.
Using rotation matrix (2) approximate rotation angles are calcu-lated
The spatial coordinates of projection centerX0,Y0,Z0are cal-culated according to formulas
X0=rF·cosUS·sinVS, Y0=−rF·cosUS·cosVS, Z0=rF·sinUS,
(4)
where rF = approximate distance of camera projection center from the center of globe.
In the second step more accurate elements of exterior orientation are calculated from tie points in the image using Least Squares Method adjustment. At least 3 points in the image are needed because 6 elements are unknown.
The initial relationship is given by the following equations
x0i =x0−f
where x0i,y0i = approximate coordinates of tie points in the
image,
i= 1, . . . ,n, = n number of tie points in the image,
f= focal length,
X0,Y0,Z0= coordinates of projection center,
x0,y0= coordinates of principal point in the image,
ri,j= elements of rotation matrixR(6),
Xi,Yi,Zi= spatial coordinates of tie points on the globe (7),
where rg= radius of globe,
Ui,Vi= geographical coordinates of tie points (obtained during tie points collection).
For adjustment the initial relationship has to be linearized and converted to residual equation
v=Ax−l, (8)
where A= matrix (9) of the partial derivatives of equation (5) with respect to unknown elements of exterior orientation,
x= vector (10) of increments of approximate exterior orientation elements,
l= vector (11) of reduced mesurements,
The solution is given in the form
x= (ATA)−1ATl. (12)
The calculation is made iteratively which is necessary to reduce the error from linearization of residual equations during Least Squares Method adjustment.
3.3 Complex adjustment
If the elements of exterior orientation are calculated accurately enough, it is possible to proceed to the complex adjustment of whole globe. During this adjustment the elements of exterior ori-entationω,ϕ,κ,X0,Y0,Z0are again unknown, and in addition the geographical coordinates of the tie pointsU,V on the globe are unknown.
Within the complex adjustment the equations (7) are substituted into the equations (5) and the Least Squares Method adjustment is solved. For purposes of adjustment it is again necessary to ob-tain the residual equation, and then make an iterative calculation. To ensure the stability of calculation it is appropriate to define some control points as fixed and not adjust their geographic coor-dinates. As fixed points were chosen 5 significant points that can be identified on all digitalized globes.
The results of adjustment are accurate values of the exterior ori-entation elements for each image. The direct transformational relationship between geographical and image coordinates is ob-tained by substituting the values of exterior orientation elements into the equations (5). Obtained geographical coordinates of all pixelsUj,Vjcan be transformed into the properly chosen carto-graphic projection which is used for subsequent visualization of the digital model.
4. VISUALIZATION AND PUBLICATION OF MODEL
As suitable cartographic projection was chosen equidistant cylin-drical projection (Snyder, 1987). The transformation of all pixels into this projection is realized by substituting the geographical coordinatesUj,Vjinto the equations of projection
Xj=R·Uj,
Yj=R·Vj, (13)
where R= Earth radius,
Uj, Vj= geographical coordinates of pixels,
Xj, Yj= rectangular coordinates of pixels in the plane of equidistant cylindrical projection.
At the end the transformed images are merged into one seam-less layer that constitutes the final image of globe in equidistant cylindrical projection. In the case of old globes it is important to remember that the prime meridian passes through not only Royal Observatory at Greenwich, but also the Island El Hierro or its sur-roundings.
In some cases it may happen that the connection of individual images is visible in the final model. This is caused mostly by the fact that the globe is not a perfect sphere or paper with a drawing is peeled off from the surface of globe. Blending between neigh-boring pictures is used to eliminate this discrepancy resulting in a smooth transition between images. Another problem may be un-even lighting of globe during digitization. This results in a color mismatch at the boundary of images (Figure 5). These distracting color gradients can be remove by color equalization of images.
Figure 5. Consequence of wrong lighting conditions
The outcome of the entire digitization process is publication of digital models. The problem with publication is the large size of the final model causing lengthy loading times on the web. This can be partly solved by using so called pyramids. The final trans-formed image of the globe is cut into a large number of tiles for several levels of zoom, usually one tile of lower zoom cor-responds to four tiles of the next higher (i.e. more detailed) zoom level. When the model is displayed only visible tiles of appro-priate zoom level are downloaded saving bandwidth and client memory requirements.
Publication of models can be realized basically in two ways. The first option is publication in the form of 3D model (Figure 6) us-ing JavaScript library Cesium or Google Earth plug-in in a web browser.
Figure 6. Digital model of the globe (JavaScript library Cesium)
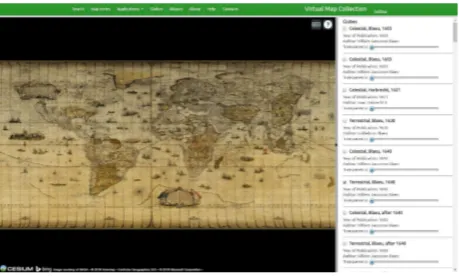
The second option is in the form of a georeferenced map (Fig-ure 7) using for example Tile Map Service.
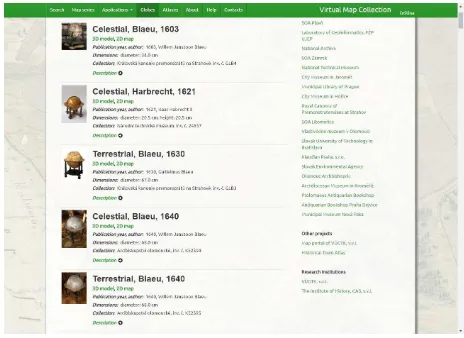
Digital models of globes are exhibited on online map portal called Virtual Map Collection. Part of map collection devoted to the globes contains a list of globes sorted by release date. Each globe is published with the overall picture, technical details and a brief annotation in Czech or English (Figure 8). A collection of globes is available on the web site
http://chartae-antiquae.cz/en/globes/.
Figure 8. Globe section in Virtual Map Collection
Currently, 104 digital models of globes are exhibited in the map collection. Collection includes terrestrial and celestial globes, and also globes of the Moon and planet Mars coming both from the collections of memory institutions and from the private col-lections.
Digital copies of globes can be zoomed in and out, and 3D mod-els can be rotated. Each model is a separate layer which can be switched on or off at will. This feature, together with the possi-bility of increasing the transparency of individual layers, allows to compare different globes among themselves. For comparison with the current state, there is also current orthophoto layer.
5. CONCLUSION
This paper presents a technology for digitization of old globes which provides an interesting possibility of protection and mak-ing this unique exhibits available.
For the purposes of digitization was developed a special mobile device that makes the process of photographing faster, and con-tributes to better quality of the resulting model. Processing of obtained data can be done by several methods, but as the most suitable method was chosen complex adjustment. This method enables a relatively fast processing of digital data, without hav-ing a significant impact on the required quality of final products that are then distributed through the Internet.
Thanks to the procedure above it was possible to create an exten-sive online database of digital models of old globes.
This database includes models of the most valuable exhibits lo-cated on the territory of the Czech Republic, and it is widely used in research related to the historical science and cartography. Ex-hibited digital models have a high quality of processing that will stand a worldwide comparison.
ACKNOWLEDGEMENTS
The authors gratefully acknowledge Ministry of Culture of the Czech Republic which funded the project no. DF11P01OVV021: ”Cartographic sources as a cultural heritage. Research of new methods and technologies of digitization to enable access and use of old maps, plans, atlases and globes.” Under the auspices of this project, the paper was created.
REFERENCES
Adami, A. and F. Guerra, 2008. Coronellis Virtual Globe.
e-Perimetron [online], Vol. 3, No. 4, pp. 243-250,
www.e-perimetron.org/Vol 3 4/Adami Guerra.pdf (31 March 2010).
Ambroˇzov´a, K. and M. Talich, 2013. Digitization of old globes. In 8th International Workshop Digital Approaches to Carto-graphic Heritage, Rome, Italy.
Centre for Innovation in Mathematics Teaching (CIMT), 2008. Correlation and regression. InCourse Material of Statistics [on-line], http://www.cimt.plymouth.ac.uk/projects/mepres/alevel/ stats ch12.pdf (15 June 2015).
Gede, M., 2009. Publishing globes on the Internet. Acta Geo-daetica et Geophysica Hungarica, Vol. 4, No. 1, pp. 141-148.
Harris C. and M. J. Stephens, 1988. A combined corner and edge detector. InAlvey Vision Conference, pp. 147152.
Chum O., 2005. Two-View Geometry Estimation by Random Sample and Consensus. Czech Technical University in Prague, 90 p., Disertation thesis.
Linder, W., 2003.Digital photogrammetry: Theory and applica-tions. Springer, Berlin-Heidelberg, 189 p. ISBN 3-540-00810-1.
Snyder, J. P., 1987. Map Projection A Working Manual. U.S. Geological Survey, Washington.
Stal, C. et al., 2012. Digital representation of Historical Globes: Methods to Make 3D and Pseudo-3D Models of 16th Century Mercator Globes. The Cartographic Journal, Vol. 49 (2), pp. 107-117. ISSN 0008-7041.