AN INTEGRATED APPROACH TO ACCURATE DEM GENERARTION USING
AIRBORNE FULL WAVEFORM LIDAR DATA
B. Hu *, D. Gumerov, J.-G. Wang
Dept. of Earth and Space Science and Engineering, York University, Toronto, ON, M3J1P3, Canada - (baoxin, damirg,
jgwang)@yorku.ca
Commission VI, WG VI/4
KEY WORDS: Remote Sensing, full waveform LiDAR, DEM generation, Morphology, integration.
ABSTRACT:
In this study, full waveform LiDAR data were exploited to improve the generation of a large-scale digital elevation model (DEM). Building on the methods of progressive generation of triangulation irregular network (TIN) model reported in the literature, we proposed an integrated approach. In this method, echo detection, terrain identification, and TIN generation were performed synergically and iteratively, instead of their separate determinations as in most DEM generation methods. This method started with a TIN model made up of terrain points detected using a morphological opening operation and a curve matching method. For any given TIN facet, the full waveforms of the return associated with the laser pulses interacting with this TIN facet were examined near the surface for any terrain echoes. The TIN was then updated using the newly detected terrain points. These processes were iterated until no new terrain points were identified. The developed method was tested on a data set collected by a Riegl LMS Q-560 scanner over a study area near Sault Ste. Marie, Ontario, Canada (463356N, 832518W). The results demonstrated that 30% more terrain points were identified under shrubs and trees using this integrated approach, compared with the commonly used Gaussian decomposition method. The DEMs generated by the developed method exhibited more details in the terrain for two test sites than those obtained by using the TerraScan software.
1. INTRODUCTION
An accurate digital elevation model (DEM) is critical to many applications ranging from transportation planning, landform monitoring to forest and water resource management, etc. Although technologies, such as aerial photogrammetry, have been available in the past to generate DEMs, the use of airborne discrete LiDAR (Light Detection And Ranging) data revolutionizes the generation of the digital representation of a terrain surface in terms of accuracy, resolution, and cost. A discrete LiDAR instrument can record more than one echoes backscattered from a surface object, and measure its 3-D coordinate together with on-board position and navigation sensors. Research indicates that the vertical accuracy of the DEM generated from LiDAR data can reach up to 15 cm for open, flat, and hard surface (Su and Bork, 2006). The accuracy tends to be deteriorated on the vegetated landscapes, such as those under shrubs and trees.
The increasing availability of the new generation small footprint full waveform airborne LiDAR system provides a good opportunity to improve the DEM generation. It is able to record the entire waveform of each received pulse. The shape of a waveform can be analyzed to achieve high multi-target resolution and range accuracy (Chauve et al., 2007). In addition, the waveform parameters, such as pulse width and back scatter cross-section, can be used to improve the separation between integrate the pulse width information into the progressive
densification filter developed by Axelsson (2000), and this approach was demonstrated to be more effective to remove low vegetation points and be able to generate more accurate DEM, compared with the traditional methods. Nonetheless, in their method (Lin and Mills, 2009), pulse information needed to be derived based on the Gaussian decomposition method (Lin et al., 2008, and Reitberger et al., 2008), before the integrated filter process. Weak echoes from the terrain may not be detected using the Gaussian decomposition method (to be demonstrated in Section 3), but they are very important to increase DEM accuracy in densely vegetated terrain. As a result, in order to fully exploit the information in full waveform data and especially to detect weak returns backscattered by the bare terrain, an integrated approach was proposed in this study to progressively carry out echo detection, terrain points’ identification, and triangulation irregular network (TIN) generation.
2. FULL WAVEFORM DATA
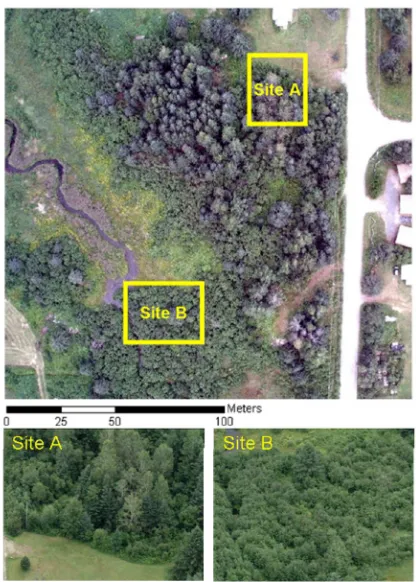
Figure 1: The true color composite imagery of the test area. Sites A and B were used to evaluate the generated DEM.
3. METHODS
3.1 The general idea
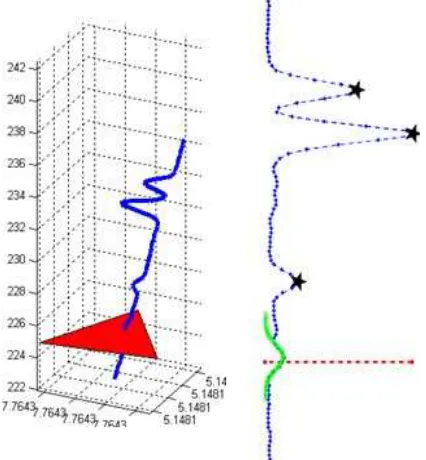
Before going into details with the developed methodology, we would like to demonstrate the problem in DEM generation that was solved in this study. Figure 2 shows a recorded full waveform of the returns by a tree and the underneath terrain (blue and green dots). The red curve in Figure 2 is the result of fitting 8 Gaussian functions (Reitberger et al., 2008) to the observations. By examining the path of the emitted laser pulse, we noticed that the weak echo circled in pink was backscattered by the bare terrain under the tree. However it was not detected by the Gaussian decomposition method. On the other hand, if the Gaussian decomposition was constrained to only the pink circle interval (green dots), the weak terrain echo (circled in pink) can be detected. The red curve in Figure 2 was the Gaussian fitting result to the dots in green. It is worthy to mention that different numbers of Gaussian functions were fitted to the observations, but none of them could pick up the echo within the pink circle. In addition, due to noise in the recorded full waveform data, peaks with low intensity (weak echoes) are usually screened out by a pre-determined threshold in order to avoid over fitting.
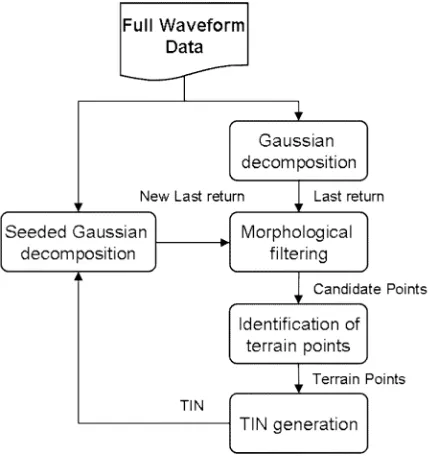
of the developed method is shown in Figure 3. In this method, each full waveform was first decomposed into several discrete echoes using the Gaussian decomposition method (Reitberger et al., 2008). The information of the last echo including the original recorded data and the results from the Gaussian decomposition (such as the echo position and its width) were used to generate the terrain points. In the second step of this method, a series of morphological opening operations were employed to estimate the dominant sizes of objects within the scene of interest based on the locations of the last returns and generate candidates of terrain points. These points were further classified into terrain and non-terrain points based on the width, intensity, and shape of the last returns. A TIN model was built based on the identified terrain points and then used to guide the
Figure 2: An example of a returned full waveform of a laser pulse passing through a tree (dots), the modelled one by fitting the summation of 8 Gaussian functions to whole waveform (red line). The circled (pink) echo was returned by the terrain and the blue curve was the result by fitting one Gaussian function to this echo.
Figure 3: The diagram of the developed method
3.1 Morphological filtering
Identification of the initial terrain points is a critical step in the developed method (Figure 3). As in most of filters for terrain points, a user-identified or pre-determined neighbourhood was examined in Axelsson (2000) and Lin and Mills (2009) and the lowest points was treated as initial terrain points. In this study, the morphological opening operations (Soille, 1999) were used to automatically identify the dominant object sizes in the scene of interest, which served as the basis for the neighbourhood determination. Morphological operations are usually used for data in raster format (imagery). In this study, they were adapted for the LiDAR data points.
A series of disk structuring elements (SEs) with diameters from 0.25 m to 12 m was employed in the opening operations and resulted in corresponding opened data clouds. In each opened data set, objects fully containing the corresponding SE were retained, whereas smaller ones were sifted. For each pair of consecutive opened data, the mean of their differences was calculated by using the mean of the opened data with the smaller SE size as the minuend. The result can be viewed as the first derivative of the opened data with the smaller SE size.The
first derivatives of the opened data for the test site (excluding the final one) are shown in Figure 4. Many local minima can be observed in Figure 4. A local minimum would occur wherever there was a big difference in object sizes between the opened data with two adjacent SE sizes. Therefore, the first derivatives of the opened data can reveal the size distribution or the scale range of the objects in this scene. As indicated from Figure 4, the range in sizes of the objects is wide and it contains multiple dominant size groups smaller than 10 m in diameter. Viewing Figure 1, one can see that the smaller size groups in Figure 4 may represent trees in various sizes, while the large objects, such as houses, form the large size group.
Figure 4: The first derivative of the morphologically opened data revealing the dominant object sizes in the scene.
Based on the results obtained in Figure 4, the circle with the diameter of 10 m was used as the neighbourhood of each LiDAR point (in term of its horizontal position). If a LiDAR point was the lowest in its neighbourhood, it was considered as a candidate for terrain points. It is worthy to mention that the size of neighbourhood would be changed from iteration to iteration. In this study, it was reduced to 0.75 m on the second iteration.
3.2 Identification of terrain points
All of the points identified through morphological filtering were classified into terrain and non-terrain points. Several terrain points selected on an open ground were used as training samples. The curve of the last return corresponding to each candidate terrain points was compared with that of training points. The similarity measure used in this study for the curve match was the spectral angle mapper (SAM) commonly used in hyperspectral remote sensing. The initial ground points identified are shown in Figure 5. Comparing with the image shown in Figure 1, it is clear that all of the ground points are near roads, river banks, and on the open areas.
Figure 5: The initial ground points identified.
3.3 Seeded Gaussian decomposition
Figure 6: The full waveform of the return of a laser pulse passing through a facet in the initial TIN model. The stars are the peaks of the echoes detected by the Gaussian decomposition method. The red line shows the location of the seed used for the seeded Gaussian decomposition, and the green curve is the result by fitting one Gaussian function to the points near the seed.
After the seeded Gaussian decomposition, a number of new candidates of terrain points were detected and they were input to the module of “morphological filtering” for the next iteration.
4. RESULTS
To clearly demonstrate the results, two sites (shown in Figure 1) were used as examples. Figures 7 and 8 also show the new terrain points identified after the first iteration of the integrated process for these two sites. It is clear from Figures 7 and 8 that the terrain points were increased by more than 30% using the integrated approach developed in this study. Comparing between these two sites, more new points were detected for Site B than for Site A. As shown in Figure 1, Site B consists of deciduous shrubs and there are more gaps within each shrub where a laser pulse can pass through. On the other hand, Site A is dominated by trees. For some of the trees, the leaves or needles are very dense so that there are hardly any gaps within the crown. As a result, it is reasonable that few new points were identified.
Figure 7: The initial terrain points (black crosses) detected from the Gaussian decomposition method (performed over the whole waveform) and the new terrain points (blue circles) added using the integrated approach developed in this study for Site A.
Figure 8: The initial terrain points (black crosses) detected from the Gaussian decomposition method (performed over the whole waveform) and the new terrain points (blue circles) added using the integrated approach developed in this for Site B.
5. CONCLUSSION
The objective of this study is to investigate the effectiveness of the full waveform LiDAR data on the improvement of the generation of the large-scale DEM. An integrated approach was developed to incorporate the echo detection, terrain identification, and TIN model generation in an iterative process. In such a way, the built TIN model guided the echo detection in terms of its location and provided a constraint on the Gaussian decomposition method. As a result, the weak echo in a recoded full waveform that usually is generated by the terrain under vegetation is likely detected (as shown in Figure 6). The preliminary results have demonstrated that this approach can increase the bare terrain points under trees and shrubs by more than 30%. The generated DEMs for two test sites exhibited more terrain details compared with those obtained by the software TerraScan. Quantitative accuracy evaluation of the generated DEM will be carried out in future work.
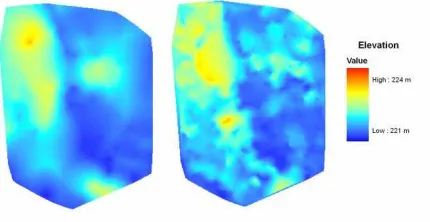
Figure 9: The DEMs of Site A generated by the proposed method (right) and TerraScan (left).
Figure 10: The DEMs of Site B generated by the proposed method (right) and TerraScan (left).
6. ACKNOWLEDGEMENTS
The authors are grateful for financial support provided by the Natural Sciences and Engineering Research Council (NSERC) of Canada, the Canadian Space Agency, and GeoDigital Inc. We would also like to thank Jili Li and Linhai Jing for their help with the processing of the LiDAR data.
7. REFERENCE
Axelsson, P. 2000. DEM generation from laser scanner data using adaptive TIN models. International Archives of
Photogrammetry and Remote Sensing, 33(B4/1): 110-117.
Chauve, A., C. E. Mallet, F. E. E. Bretar, S. Durrieu, M. P. Deseilligny, and W. Puech, 2007. Processing full waveform lidat data: modeling raw signals. International Archives of the
Photogrammetry, Remote Sensing and Spatial Information Sciences, 36(3/W52): 102-107.
Lin, Y.-C. and J. P. Mills, 2009. Integration of full-waveform information into the airborne laser scanning data filtering process. International Archives of the Photogrammetry,
Remote Sensing and Spatial Information Sciences, 38 (3/W8):
224-229.
Lin, Y.-C., J. Mills, and S. Smith-Voysey, 2008. Detection of weak and overlapping pulses from waveform airborne laser scanning data. SilviLaser 2008, 478-487, Sept. 17-19, Edinburgh, UK.
Reitberger, J., Krzystek, P., and U. Stilla, 2008. Analysis of full waveform LiDAR data for the classification of deciduous and coniferous trees. International Journal of Remote Sensing, 29(5):1407-1431.
Soille, P. 1999. Morphological Image Analysis: Principles and
Applications (New York: Springer-Verlag:), 319 p.
Su, J. and E. Bork, 2006. Influence of vegetation, slope, and LiDAR sampling angle on DEM accuracy. Photogrammetric
Engineering & Remote Sensing, 72(11), pp. 1265-1274.
Wagner, W., M. Hollaus, C. Briese, and V. Ducic, 2008. 3D vegetation mapping using small-footprint full-waveform airborne laser scanners. International Journal of Remote