Conformity of Patient-Received Medicine Information towards
Understanding in Surabaya-Indonesia Primary Health Centres
A.P. Setiadi
1*, S. Supriyanto
2, W. Purnomo
31
Health Sciences Study Program, Public Health Faculty, Universitas Airlangga, Surabaya
60115, Indonesia
2
Health Policy and Administration Department, Public Health Faculty, Universitas Airlangga,
Surabaya 60115, Indonesia
3
Biostatistics Department, Public Health Faculty, Universitas Airlangga, Surabaya 60115,
Indonesia
Abstract
Institute of Medicine presented the data on how almost half of Americans had low health literacy in which they hardly understood medicine instructions, possibly leading to therapy failure or unreachable medication safety. Few researches have been done on the patient understanding regarding the received medicine information. Considering that patient understanding has barely
left the common ground, the study aspires to evaluate the inluence of medicine information both
orally and written for enhancing medication safety. It concerns over 200 respondents of 120 toddler’s caregivers and 80 elder patients randomly taken from 40 primary health centres out of 62 located in Surabaya. From each, the respondents consist of three toddler’s caregivers and two elderlies. The data of written medicine information was obtained from observing medicine labels embedded on the patients’ medicines. Simultaneously, the data of oral medicine information was gained while the respondents were receiving medicine from pharmacy staff. The data of patient understanding was derived from the structured interview result after patients obtained medicines. The collected data was analysed descriptively through Pareto principles and PLS SEM v 3.0. Thus, patient understanding at Surabaya’s primary health centres belongs to the quite strong category with its source from the average level of its written and strong level of oral information. Indeed, with the majority of Surabaya’s primary health centres’ patients still adhering to oral/traditional culture, they require oral explanation in terms of absorbing written medicine information.
Keyword: patient understanding, written medicine information, oral medicine information
1. INTRODUCTION
Knowledge about prescribed medications
is one important area of study in the ield of
health literacy.1 Institute of Medicine issued the data on almost half American grown-ups having low health literacy rate in the sense that
they have dificulties in understanding medicine
instruction which can affect compliance, leading to failure in therapy and medication safety.2, 3 From the condition above, it can be implied that Clear communication is critical to successful health care.2
In younger populations, an evaluation of parents’ ability to comprehend medicine labels for their children and calculate appropriate doses found that 77 percent of the adults studied were unable to correctly administer oral rehydration therapy, 56 percent were unable to calculate appropriate doses of cough syrup, and 68 percent planned therapy schedules led to incorrect dosing.4 Another study in a survey of older hospitalized patients prior to discharge, only 40 percent reported having no problems in reading their medicine labels, and even fewer
*Corresponding author: Adji Prayitno Setiadi, Faculty of Pharmacy, Universitas Surabaya, Raya Kalirungkut Surabaya 60293, Indonesia.
reported that they had a clear understanding of the instructions and also geriatric patients found that they frequently did not understand how to time their dosing in relation to meals.5, 6 In a multisite study of primary care patients, nearly half were unable to understand one or
more of the label instructions on ive common
prescription medicines.7 However, most studies on patient’s understanding about prescribed medications are taken from Western developed countries, while there is a relative lack of research from developing Asian countries especially in Indonesia.
Clear communication performed while giving the medicine to the patients consists of giving written and oral information,8-10 which if seen from the patients’ perspectives are the tools to help their understanding. However, how important the role of each of the information toward patient understanding is still unknown. This research aims to evaluate the impact of written and oral medicine information toward patient understanding regarding the received medicine information with the hope to in-crease adherence and medication safety.
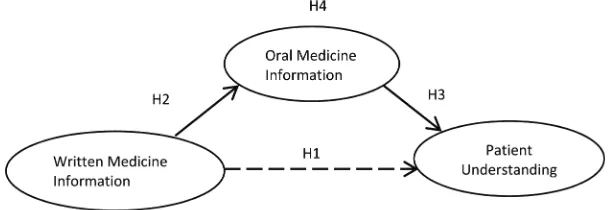
2.
RESEARCH FRAMEWORK AND
HYPOTHESIS
H1: Written medicine information patient given has a positive effect on patient understanding. H2: Written medicine information given has a
positive effect on oral medicine Information given.
H3: Oral medicine information given has a positive effect on patient understanding. H4: Oral medicine information given mediates
a relationship between written medicine information given and patient understanding.
3. METHODS
3.1Unit Analysis
The unit analysis is primary health centre.
3.2 Sample
The research caters for 200 respondents of 120 toddler’s caregivers who their toddlers are receiving medicines prescriptions as well
as 80 elderly patients who are also obtaining medicine prescriptions from doctors. Respondents came from 40 health centres of which had been selected randomly out of the total 62 in Surabaya. Respondents from every primary health centre were three toddler’s caregivers and two elderly patients, which were randomly selected.
3.3 Data Collection
The written data information was taken from the observation toward the embedded medicine label accepted by respondents and matched with its label photos. Likewise, the oral data information was obtained while the patients were receiving medicines and its explanation from pharmacy staff. The respondent under-standing data was taken from the structured interview result after the respondents had received their medicines. Data was collected from May to August 2014.
3.4 Data Analysis
The obtained data is analysed descrip-tively using Pareto principles, stating that:
“ around 80% of all positive results are produced by just 20% of efforts. Similarly, roughly 80% of all problems can be traced to approximately 20% all possible causes”, cited from Sashkin,11 Rinehart,12 and Robson.13
Approximately, 80% performance is the result of 20% effort, hand in hand with around 80% problems can be traced through its 20% factors. Based on Pareto Principles this means the research variable indicator of good quality gains the score 4 and 5, higher
than 80%, while the less qualiied indicator
(gaining score percentage of 4 and 5, lower than 80%) requires serious attention in particular if the percentage score 4 and 5 is smaller than 20%. This means there is a 80% performance problems or more and we need to learn its cause by checking the percentage which possesses
scores 1, and 2 as much as ≥20%. Correlating
“This suggest that 20% of the processes cause 80% of the problems”.
with the test will be held on mediation effect of oral medicine information on giving written medicine information towards patient understanding with PLS SEM v 3.0.
4. RESULTS AND DISCUSSION
4.1 General Description of Health Centres in Surabaya
As a technical implementation unit of Surabaya City Health Department, Surabaya’s Primary Health Centres in total are 62, spread around 31 districts in the city. These Surabaya health centres serve primary health of Surabaya citizens who domiciled in 160 villages (desa/ kelurahan), with the number of 2,853,265 people so that every health centre is viewed to serve 46.020 people 15,16 on average number.
Being the capital of the province of East Java, Surabaya’s area extends on 326 km2, with Madura Strait to the North and the East, the Sidoarjo Regency to the South, and Gresik Regency to the West. 15
This research includes respondents who are toddler’s caregivers and elderlies who underwent their treatment in 40 selected health centres.
4.2 The Data of Demographic Respondents
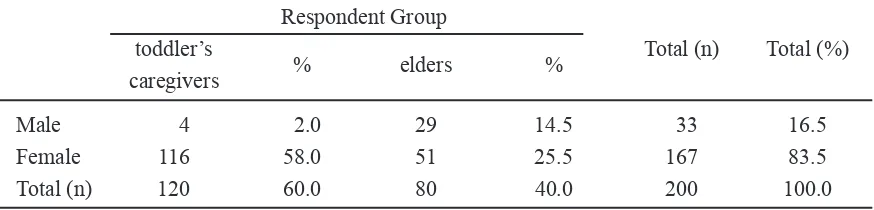
The distribution data of the respondents’ gender based on their roles can be seen on Table 1:
The proportion of female respondents compared to the male in total is 5:1. The female respondents dominated both toddler’s caregivers and elderlies groups, with their number doubles over the male respondents in the latter group.
The distribution data on education and occupational level based on age group can be seen on Table 2:
The commonest age found among the respondents is between 20-40 years old from toddler’s caregivers group and followed with those whose age more than 60. The most education level possessed by respondents are High School and lower, reaching up to 90% and the most occupation found among them is homemaker.
4.3 Description on Medicine Information Variable
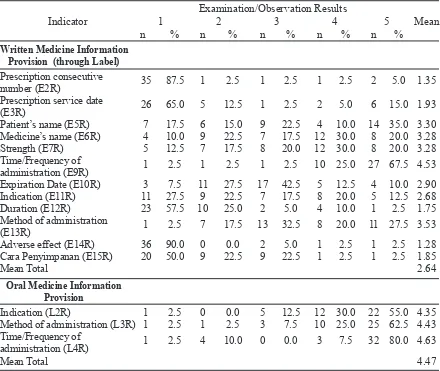
The following is the frequency distribu-tion of written informadistribu-tion provision through given medicine label and oral medicine infor-mation during the medicine handover to patients based on the score of check up results of examination/observation on Table 3:
Respondent Group
toddler’s Total (n) Total (%)
caregivers % elders %
Male 4 2.0 29 14.5 33 16.5
Female 116 58.0 51 25.5 167 83.5
Total (n) 120 60.0 80 40.0 200 100.0
n= the number of respondents
Respondent Age Group (year) Total Total
≤ 20 >20-40 >40-60 >60 (n) (%)
Respondent’s Postgraduate - - - 1 1 0.5
Latest Education Undergraduate - 8 1 5 14 7.0
Diploma - 3 1 1 5 2.5
Senior High 1 53 2 13 69 34.5
Junior High 3 16 2 12 33 16.5
Elementary 1 19 7 30 57 28.5
Uneducated - 1 1 19 21 10.5
Total (n) 5 100 14 81 200 100.0
Respondent’s Pharmacy technician - 1 - - 1 0.5
Occupation Civil Servants - 2 - - 2 1.0
Enterpreneur - 5 2 13 20 10.0
Private employees 1 13 - 2 16 8.0
Homemaker 3 78 9 26 116 58.0
Retired - - - 17 17 8.5
Others/not working 1 1 3 23 28 14.0
Total (n) 5 100 14 81 200
Total (%) 2.5 50.0 7.0 40.5 100.0
n= the number of respondents
Table 2. Demography of the respondents’ education and occupational levels based on age group
Table 3. Frequency distribution of medicine information provision surabaya primary health centres 2014
Examination/Observation Results
Indicator 1 2 3 4 5 Mean
n % n % n % n % n % Written Medicine Information
Provision (through Label) Prescription consecutive
number (E2R) 35 87.5 1 2.5 1 2.5 1 2.5 2 5.0 1.35
Prescription service date
(E3R) 26 65.0 5 12.5 1 2.5 2 5.0 6 15.0 1.93
Patient’s name (E5R) 7 17.5 6 15.0 9 22.5 4 10.0 14 35.0 3.30
Medicine’s name (E6R) 4 10.0 9 22.5 7 17.5 12 30.0 8 20.0 3.28
Strength (E7R) 5 12.5 7 17.5 8 20.0 12 30.0 8 20.0 3.28
Time/Frequency of
administration (E9R) 1 2.5 1 2.5 1 2.5 10 25.0 27 67.5 4.53
Expiration Date (E10R) 3 7.5 11 27.5 17 42.5 5 12.5 4 10.0 2.90
Indication (E11R) 11 27.5 9 22.5 7 17.5 8 20.0 5 12.5 2.68
Duration (E12R) 23 57.5 10 25.0 2 5.0 4 10.0 1 2.5 1.75
Method of administration
(E13R) 1 2.5 7 17.5 13 32.5 8 20.0 11 27.5 3.53
Adverse effect (E14R) 36 90.0 0 0.0 2 5.0 1 2.5 1 2.5 1.28
Cara Penyimpanan (E15R) 20 50.0 9 22.5 9 22.5 1 2.5 1 2.5 1.85
Mean Total 2.64
Oral Medicine Information
Provision
Indication (L2R) 1 2.5 0 0.0 5 12.5 12 30.0 22 55.0 4.35
Method of administration (L3R) 1 2.5 1 2.5 3 7.5 10 25.0 25 62.5 4.43
Time/Frequency of
administration (L4R) 1 2.5 4 10.0 0 0.0 3 7.5 32 80.0 4.63
Mean Total 4.47
Among the twelve Written Medicine Information Provision indicator variables as shown in Table 3. Based on the Pareto Principle, the E9R indicator about the time/frequency of medicine use is the most powerful indicator as to obtain the percentage of examination/ observations in the medicine label upper limit of the Pareto Principle, namely 80.0% gained 92.5% (67.5% ‘all complete’ and 25.0% ‘many complete’). Among the twelve Written Medicine Information Provision indicator variables the E14R, E15R, E2R, E12R, and E3R indicators respectively have performance problems by 95.0%, 95.0%, 92.5%, 87.5%, 80.0% and equal to or higher than 80% of the problem based on the Pareto principle and on each of the indicators the percentage obtaining examination/ observations of category 1 (one) and 2 (two) above the limit of 20% Pareto Principle, namely sequentially 90.0%, 72.5%, 90.0%, 82.5% , and 77.5%. E14R indicator on adverse drug reactions obtain the results of the examina-tion/observation of category 1 (one) and 2 (two) by 90% (90.0% ‘not given’ and 0.0% ‘a little full’), E2R indicator on the serial number of the prescription obtain examination/observations of category 1 (one) and 2 (two) amounted to 90.0% (87.5% ‘not given’ and 2.5% ‘a little full’), E12R indicator on duration use of medicines obtain examination/observations of category 1 (one) and 2 (two) amounted to 87.5% (57.5% ‘not given’, and 25.0% ‘a little full’), E3R indicator on the date of prescription service obtain examination/observations of category 1 (one) and 2 (two) amounted to 77.5% (65.0% ‘not given’, and 12.5% ‘a little full’), and E15R indicator on how storage obtaining medicine obtain examination/observations of category 1 (one) and 2 (two) amounted to 72.5% (50.0% ‘not given’, and 22.5% ‘a little full’).
There is also the average value of the Written Medicine Information Provision indicator variable of primary health centres in Surabaya by 2.64 includes enough category (2.6 - 3.4).
Among the three indicators of Oral Medicine Information Provision variable as shown in Table 3 all the indicators are strong performance for obtaining the percentage of
observations of medicine information orally
category four (4) and ive (5) above the 80.0%
limit of the Pareto Principle. L4R indicators on the time/frequency of medicine use obtained a value of 87.5% (80.0% ‘all complete,’ and 7.5% ‘many full’), L3R indicator on method of medicine administration obtaining observations value of 87.5% (62.5% ‘all complete,’ and 35.0% ‘many full’), and L2R indicator on indication obtaining observations grades of 85.0% (55.0% ‘all complete ‘and 30.0%’ many full’). Among the three indicators of Oral Medicine Information Provision variable were not found problematic performance indicator because it is below 80% of the Pareto Principle and also not found indicators that derive value observed category 1 (one) and 2 (two ) is equal to or greater than 20% of the Pareto Principle.
There is also the average value of the three indicator Giving Oral Medicine Information variable Primary Health Centre in Surabaya by 4.47 including strong category (4.2 - 5.0).
In between the two variables of Medicine Information Provision, the Written Medicine Information Provision variable is weaker when compared with the Oral Medicine Information Provision for the indicators to obtain a percentage of 48.96% compared to 6.67% based on the average results examination/ observation that gained value category 1 (one) and 2 (two) in each variables or with a statement to the contrary Oral Medicine Information variable is a variable that is stronger than Written Medicine Information Provision variable to obtain a percentage of 86.67% compared to 32.29% based on the average examination/ observations results of category 4 (four) and
5 (ive).
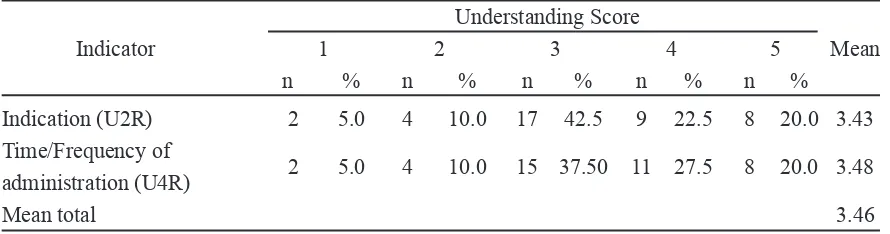
4.4 Description Patient Understanding Variable
Here is presented a frequency distribu-tion of the Patient Understanding indicator variable (Table 4).
patient’s assessment category 4 (four) and ive
(5) equal to or greater than the 80% limit of the Pareto Principle. Similarly, even though there are performance problem issues sequentially by 57.5% and 52.5% for U2R indicator on indication, or U4R indicators on time/frequency of medicine use obtain lower than 80% problem based on Pareto principle, also not found indi-cators that obtain category 1 (one) and 2 (two) above the 20% limit of the Pareto Principle for understanding the value of ‘do not know’, and ‘little understood’.
There is also the average value of the Patient Understanding indicator variable primary health centres in Surabaya at 3.46 including the category is strong enough (3.4 - 4.2).
4.5 Relective Measurements Model (Construct)
Evaluation
Measurements Model (Construct) Evaluation is aimed to assess the quality of the construct that includes an evaluation of the reliability and validity.17,18 Evaluation of construct reliability includes an indicator reliability and internal consistency reliability (composite reliability and Cronbach Alpha), while the evaluation of construct validity includes convergent validity (average variant extracted = AVE) and discriminant validity (Fornell Larcker Criterion and Cross Loading).18
Relective construct evaluation results
can be seen in Table 5 as follows: Understanding Score
Indicator 1 2 3 4 5 Mean
n % n % n % n % n %
Indication (U2R) 2 5.0 4 10.0 17 42.5 9 22.5 8 20.0 3.43 Time/Frequency of
administration (U4R) 2 5.0 4 10.0 15 37.50 11 27.5 8 20.0 3.48
Mean total 3.46
Explanation: n = the number of health centre
Table 4. Frequency distribution of the patient understanding surabaya primary health centres 2014
Reliability Validity
Indicator Internal Consistency Convergent Discriminant Latent
Indicator Reliability Reliability Findings Validity Validity Findings
Variable
(Outer Composite Cronbach AVE Fornell Cross
Loading)2 Reliability Alpha Larcker Loading
Criterion
Written Expiration date (E10R) (0.851)2= 0,724 0.854 0.775 Reliable 0.594 0.771 0.851 Valid
Medicine Indication (E11R) (0.746)2= 0,556 0.746
Information Duration of medication
(E12R) (0.739)2= 0,546 0.739
Method of administration
(E13R) (0.740)2= 0,548 0.740
Oral Medicine Indication (L2R) (0.903)2= 0,815 0.923 0.878 Reliable 0.801 0.895 0.903 Valid Information Method of administration
(L3R) (0.946)2= 0,895 0.946
Time/Frequency of
administration (L4R) (0.833)2= 0,694 0.833
Patient Indication (U2R) (0.936)2= 0,876 0.910 0.805 Reliable 0.835 0.914 0.936 Valid
Understanding Time/Frequency of
administration (U4R) (0.891)2= 0,794 0.891
4.5.1 Construct Reliability Indicators
Construct reliability indicators state that the indicator has many similarities/generality with the related constructs. Indicators of reli-ability of the construct are determined by the value of proper outer loadings which are greater than 0.708 with consideration that quadrated value outer loading of 0.7082 is 0.50 or 50%, stating that the latent variables are substantially explained at least 50% of each variant constructs of constituent indicators. Indicators with outer loading between 0.40 - 0.70 are removed only if the removal of the composite indicators improve
reliability and AVE above the speciied threshold
value, whereas the outer loading indicator <0.40 is deleted. There are also indicators that are removed, namely E2R, E3R, E5R, E6R, E7R, E9R, E14R, and E15R.
4.5.2 Internal Consistency Reliability Construct
Internal consistency reliability construct states that estimated reliability is based on the observed inter-correlations variable indicators. Internal consistency reliability construct is determined by the composite reliability value of the minimum limit of 0.708 (on research that is exploratory 0.60 - 0.70 is acceptable), while the value of Cronbach Alpha is a conser-vative measure of internal consistency reliability with a minimum limit of 0.70 righteously. On Table 6, it appears that the composite reliability value of all of the construct variables and
Cronbach Alpha value are > 0.70.
4.5.3 Convergent Validity Construct
Convergent validity states that a measuring instrument (indicator) accurately
relects the intended construct. Convergent
construct validity is determined by the value of Average Variance Extracted (AVE) that must be greater than 0.50, which means that 50% or more variants of indicators can be ex-plained. On Table 6 it appears that the entire
value of AVE is ≥ 0:50.
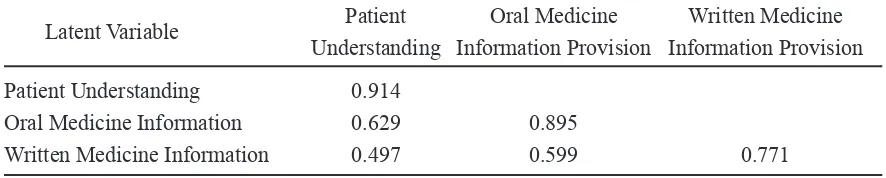
4.5.4 Discriminant Validity Construct
Discriminant validity is related to the principle that the distinct measure (manifest variables) constructs should not be highly correlated, or in other words that to precisely test a construct will only measure the construct that is deemed vital. Validity discriminant construct is determined by the Fornell Larcker Criterion and Cross Loading value. The Fornell Larcker Criterion test is done by comparing the square root of AVE within each variable on the diagonal Table 6 with the correlation between the constructs in the model. The shown good validity of the square roots AVE for each construct is greater than the correlation between the constructs in the model. On the Table 6 Fornell Larcker Criterion, it appears that the entire square root AVE in each construct is greater than the correlation between the constructs in the model. In the validity test done with Cross Loading which is declared valid by looking at the value of each indicator, outer loading constructs must be greater than the whole other cross loading indicator construct in the same column. In Table 7 the Cross Loading, it seems that the whole outer loading value of each indicator can constituent a bigger construct than the entire value of the entire other cross loading indicator constituent construct in the same column.
Latent Variable Patient Oral Medicine Written Medicine
Understanding Information Provision Information Provision
Patient Understanding 0.914
Oral Medicine Information 0.629 0.895
Written Medicine Information 0.497 0.599 0.771
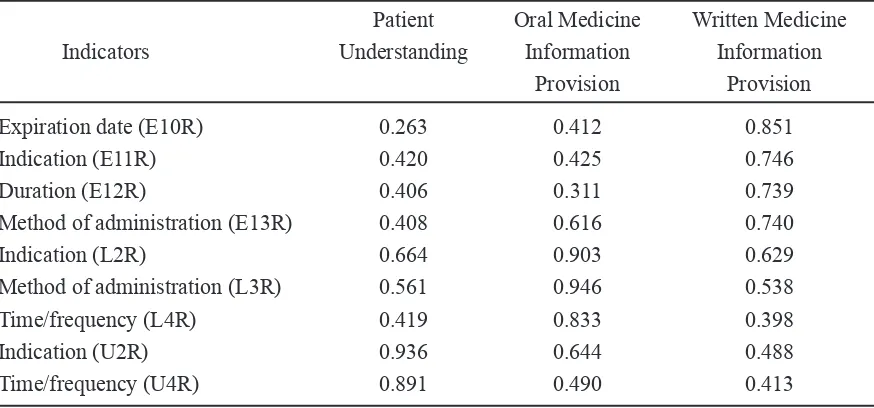
4.6 Measurement Model / Outer Model Results
Measurement models are an element that contains a model of the path indicators and
its inluence on related constructs. Measurement
models are also referred to as outer models in PLS-SEM. Outer loading value declares the weight of each indicator as a measurement of each of the latent variables/constructs respectively. Indicator with the largest outer loading states that indicators as variable are measuring the strongest (dominant). Outer loading value
expresses signiicant measurement/relection
on the related latent variables/constructs if the value of t-statistic is greater than 1.96 (for a
signiicance level of 5%) or a p-value that is
less than 0.05.
4.6.1 Outer Model on the Written Medicine Information Provision
Here are the presented results of the outer model Written Medicine Information Provision (Table 8):
Patient Oral Medicine Written Medicine
Indicators Understanding Information Information
Provision Provision
Expiration date (E10R) 0.263 0.412 0.851
Indication (E11R) 0.420 0.425 0.746
Duration (E12R) 0.406 0.311 0.739
Method of administration (E13R) 0.408 0.616 0.740
Indication (L2R) 0.664 0.903 0.629
Method of administration (L3R) 0.561 0.946 0.538
Time/frequency (L4R) 0.419 0.833 0.398
Indication (U2R) 0.936 0.644 0.488
Time/frequency (U4R) 0.891 0.490 0.413
Table 7. Cross loading
Table 8. he results of the outer model written medicine information provision
Indicator Outer Loading Standard Error t-statistic p-value Finding
Expiration date (E10R) 0.851 0.062 13.803 0.000 Signiicant
Indication (E11R) 0.746 0.075 10.013 0.000 Signiicant
Duration (E12R) 0.739 0.094 7.848 0.000 Signiicant
Method of administration (E13R) 0.740 0.088 8.428 0.000 Signiicant
From the outer model examination above it appears that all four indicators of written medicine information provision have strong
values outer loading (> 0.708), and the T-statistic values and p-values are signiicant, indicating
that the measurement of written medicine
information provision is relected by the four
indicators.
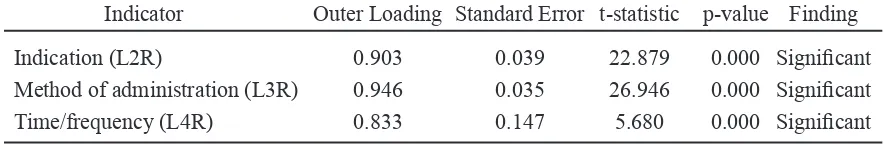
4.6.2 Outer Model on Oral Medicine Information
Here are presented the results of the outer model of the oral medicine information (Table 9):
values and p-values are signiicant, perceiving
the measurements oral medicine information
that are relected by the three indicators.
4.6.3 Outer Model on Patient Understanding of the Medicine Information be Accepted
Here are presented the results of the outer model of the patient understanding variables (Table 10):
From the outer model examination above it seems that all the two indicators have strong outer loading values (more than 0.708). This implies that the measurement of
under-standing Patient is relected by the two indicators.
4.7 Evaluation of Structural Model
Evaluation of the structural model is intended to test the predictive capability of
the model and its inluence among constructs.
Evaluation of structural models includes
as-sessment of collinearity, the signiicance and
relevance of the effect of the structural model. Relevance of the structural impact assessment is carried out by assessing the degree of R2, the assessment of the f 2 size effect and predictive Q2 relevance judgements.
Indicator Outer Loading Standard Error t-statistic p-value Finding
Indication (L2R) 0.903 0.039 22.879 0.000 Signiicant
Method of administration (L3R) 0.946 0.035 26.946 0.000 Signiicant
Time/frequency (L4R) 0.833 0.147 5.680 0.000 Signiicant
Table 9. he results of the outer model of the oral medicine information
Table 10. he Results of the Outer Model of the Patient Understanding Variables
4.7.1 Collinearity Assessment
Estimates path coeficients in the structural
model are based on ordinary least square regression (OLS) on any endogenous latent variables in conjunction with related constructs. As in the general multiple regression, path
coeficients may be biased if the estimate involves a signiicant degree of collinearity among related
constructs. Collinearity indications tolerance limit is set by the value of <0.20 or variance
inlation factor (VIF) > 5.0. If there is collinearity,
it can be done with disposal construct or by combining predictors into a single construct. In this study there is no indicator/predictor that has collinearity.
4.7.2 Signiicance and Relevance of the Inluence of Structural Model
After ensuring the validity and reliability of the construct, the next step is conducted to assess the effect on the structural model (path
coeficients) which illustrates the hypothesized inluence among constructs. Standardized path coeficient has values between -1 and +1, +1 approaching path coeficient estimates express strong positive inluence (and vice versa for
negative values) that are almost always
statisti-cally signiicant (i.e. different from 0 (zero) in
the population). The closer it is to 0 (zero), the
weaker its inluence. Very small value close to 0 (zero) is usually not signiicant (i.e. not
Indicator Outer Loading Standard Error t-statistic p-value Finding
Indication (U2R) 0.936 0.024 39.432 0.000 Signiicant
signiicantly different from zero). Whether or not a coeficient expresses a signiicant value, it depends on its standard error.
The signiicance of the inluence of
structural model can be direct and indirect.
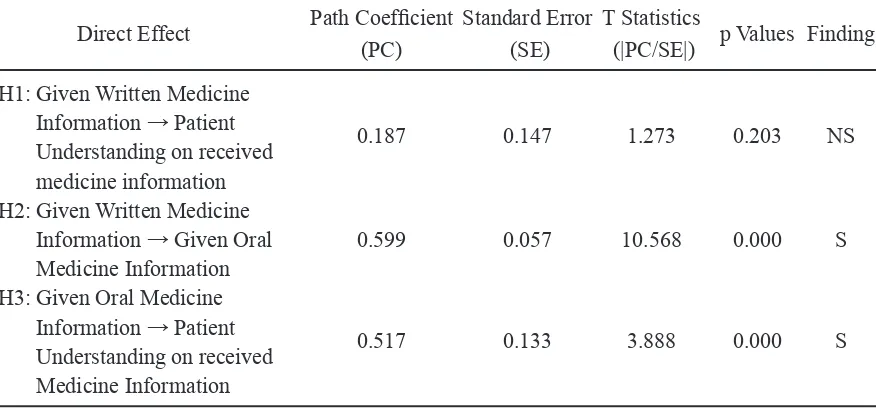
4.7.2.1 Direct Effect
Here is presented the signiicance of the direct inluence of the structural model as
shown in Table 11 below:
Graphically, the examination is presented in complete inner models in the Figure 2 below
(solid line expresses signiicant path, dotted lines express non signiicant path):
From the examination in Table 11 can be expressed more of the following:
1. Testing the direct inluence of written
medicine information provision to the patient
understanding path coeficient values obtained
for 0.187 with a value of t-statistic of 1.273
<1.96 and p-value equal to 0.203> 0.05, it can be stated that there is no signiicant direct inluence of written medicine information
provision to the patient understanding in the sense that whatever value of written medicine information provision is, it does not have a direct
inluence on the strength or weakness of the
patient understanding value.
2. Testing the direct inluence of written
medicine information provision to the oral
medicine information path coeficient values
obtained for 0.599 with a value of t-statistic
10.568 > 1.96 and p-value 0.000> 0.05 can be implied that there is a signiicant direct effect
between written medicine information Provision and the oral medicine information. Positively
marked path coeficient indicates that the inluence
on both is positive, in the sense that the stronger written medicine information provision values are, the more powerful oral medicine information values will.
3. Testing the direct inluence of oral
medicine information for patient understanding on medicine information received by path
coeficient values obtained for 0.517 with a value of t-statistic by 3.888> 1.96 and p-value 0.000> 0.05, it can be stated that there is a direct signiicant inluence of oral medicine
information on patient understanding. positively
marked path coeficient indicates that the inluence
on both is positive, indicating that the stronger the values oral medicine information are, the stronger the values of the patient understanding are.
4.7.2.2 Mediating Effect
Here is presented the signiicance of indirect inluence of the structural model as
shown in Table 12 below:
From Table 12, the examination result
of indirect inluence obtained is as follows:
Direct Effect Path Coeficient Standard Error T Statistics
(PC) (SE) (|PC/SE|) p Values Finding H3: Given Oral Medicine
Information → Patient
Understanding on received 0.517 0.133 3.888 0.000 S Medicine Information
Explanation: S= Signiicant; NS= Non Signiicant
The indirect effect of the written medicine information provision to the patient understanding through mediation oral medicine
Information, the path coeficient for 0.310 with 3.514 t-statistic> 1.96 and p-value of 0.000 <0.05 can be stated that there is signiicant inluence
from written medicine information to the patient understanding through mediation oral medicine
information. Positively marked path coeficient indicates that the direct inluence of written
medicine information for patients understanding is mediated by oral medicine information.
Indirect effect size determination in relation to the total effect or how big an effect is mediated, which is according to Hair (2014), is determined by the amount of Variance Accounted For (VAF) which is calculated by the following formula:18
VAF = (p12.p23) / (p12.p23 + p13)
Based on the data path coeficient
written medicine information provision on patient understanding mediated by oral medicine information as shown in Figure 2, it can be calculated with its magnitude toward VAF written medicine information provision on patient understanding mediated by oral medicine information:
VAF = (0.608 x 0.521) / (0.608 x 0.521 + 0.179) = 0.316768 / 0.495768
= 63.89% (20% ≤VAF≤80%) → partial
mediation
So, oral medicine information provision partially mediates the effect of written medicine information provision to the patient under-standing of received medicine information.
Indirect Inluence Path Coeficient Standard Error T Statistics
(PC) (SE) (|PC/SE|) P- Values Finding
H4: Written Medicine Information →
Patient Understanding on received 0.310 0.088 3.514 0.000 S medicine information
Explanation: TS= Insigniicant; S= Signiicant
Table 12. he signiicance of indirect inluence of the structural model
Figure 1. Research Framework and Hypothesis.
4.7.3 Coeficient of Determination (R2 Value) The most common size for evaluating the structural model is R2. This coeficient is an accurate measurement of the predictive models and is calculated as the square of the
correlation from the actual value of speciic
endogenous to construct predictive value.
Coeficients express the combined effects of exogenous latent variables to endogenous la-tent variables. In addition to the square of the
correlation coeficient of the actual value and the predictive coeficient, it is also stated that
the number of variants in the endogenous
constructs described by all the exogenous constructs is related. The R2 has a range of 0 (zero) to 1 (one), getting closer to 1 (one) increasingly have a degree of predictive accuracy. Not easy to determine the rules of acceptable R2 value because it depends on the complexity of the model and disciplines, as an example of the value of R2 = 0.20 is rated high on the consumer behaviour discipline 18. Chin (1998) states that the value of R 2 = 0.67, 0.33, and 0.19 show
coeficient of determination that is strong,
moderate, and weak.15, 16 The R2 in this study can be seen in Table 13 below:
Latent Variable (Endogen Construct) R Square Finding
Given Oral Medicine Information 0.359 Average to strong
Patient Understanding on
Received Medicine Information 0.418 Average to strong
Table 13. Coeicient of determination R2
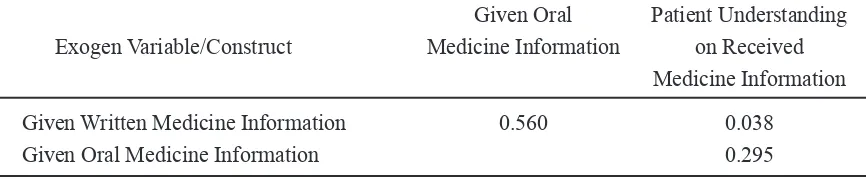
4.7.4 The f 2 Effect Size
In addition to assessing all constructs endogenous R2, R2 value changes when certain endogenous constructs are removed from the model that can be used to evaluate, whether the removal constructs have a substantive impact on the endogenous constructs as well as the f2 effect size states how much a construct predictors can contribute to the value of R2 constructs targets in the structural model. Guidelines for assessing the effect of f 2 are 0.02, 0.15, and 0.35 that state to have the effect of small, medium, and large of latent exogenous variables.18 Here
are presented the value f 2 data processing results of research (Table 14):
From the data processing research results in Table 14, it can be stated that the value of R2 oral medicine information provision construct receives one variable that brings a major impact on the written medicine information variable (f 2 = 0.560). The value of R2 patients understanding constructs get two variables
that are inluential; the effect is moderate on
oral medicine information variable (f2 = 0.295) and a small effect on written medicine informa-tion provision variable (f 2 = 0.038).
Given Oral Patient Understanding Exogen Variable/Construct Medicine Information on Received
Medicine Information
Given Written Medicine Information 0.560 0.038
Given Oral Medicine Information 0.295
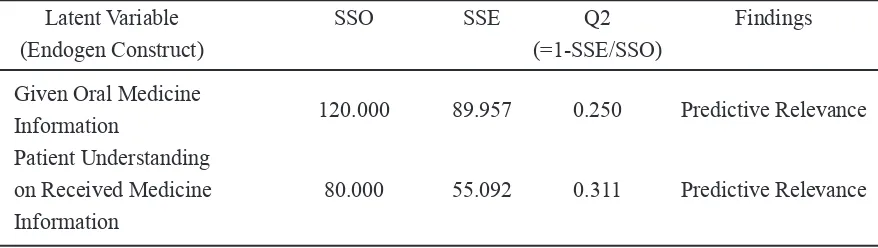
4.7.5 Q2 Predictive Relevance
In addition to assessing the value of R2 as predictive accuracy criteria, the writer also tests the value of Q2 Stone-Geisser. Q2 values measure model’s predictive relevance, more particularly when the PLS-SEM shows predictive relevance, accurately predicting the indicator
data in a relective measurement model of
endogenous constructs and endogenous single constructs. Q2 value is greater than 0 (zero),
implying that the model has predictive relevance for certain endogenous constructs and on the other hand, Q2 value is equal to 0 (zero) or lower, indicating no predictive relevance. Q2 values are obtained using blindfolding procedures and only applied to the endogenous constructs
that have a relective measurement model
including endogenous single-item construct.14 The examination is presented in the Q2 value as follows (Table 15):
Latent Variable SSO SSE Q2 Findings
(Endogen Construct) (=1-SSE/SSO)
Given Oral Medicine
Information 120.000 89.957 0.250 Predictive Relevance
Patient Understanding
on Received Medicine 80.000 55.092 0.311 Predictive Relevance Information
Table 15. Predictive relevance Q2
5. CONCLUSION
Patient understanding at Surabaya’s primary health centres belongs to the adequately strong category with its source from the average level of its written and strong level of oral information. Indeed, with the majority of Surabaya’s primary health centres’ patients still adhering to oral/traditional culture, they require oral explanation in terms of absorbing written medicine information.
REFERENCES
1. Parera T, Ranasinghe P, Parera U, Parera S, Adikan M, Jayasinghe S, et al. Knowledge of prescribed medication information among patients with limited English
proiciency in Sri Lanka. BMC Research Notes. 2012; 5:658:1-8.
2. Nielsen-Bohlman L, Panzer A, Hamlin BN, Berger A, editors. Health literacy: a prescription to end confusion. Washington,
DC 20055: Institute of Medicine; 2004.
3. Lesar TS. Medication Safety. In:
cotherapy Self-Assessment Program. 5th ed. Kansas City, MO: The American College
of Clinical Pharmacy; 2005.
4. Patel VL, Branch T, Arocha JF. Errors in Interpreting Quantities as Procedures:The Case of Pharmaceutical Labels. International Journal of Medical Informatics. 2002; 65 (3):193-211.
5. Hallworth RB, Goldberg LA. Geriatric Patients Understanding of Labelling Medicines: Part 1. British Journal of
Pharmaceutical Practice. January 14.
6. Zuccollo G, Liddell H. The Elderly and Medication Label: Doing it Better. Aging.
1985; 14 (6):371-376.
7. T.C.Davis. Literacy and Misunderstanding Prescription Drug Labels. Annals of Internal
Medicine. 2006; 145 (12):887-894.
Jenderal Bina Kefarmasian dan Alat
Kesehatan;
9. Whalley BJ, Fletcher KE, Weston SE, Howard RL, Rawlinson CF. Foundation in Pharmacy Practice. Reading UK:
ceutical Press; 2008.
10. Winield AJ, Rees JA, Smith I, editors. Pharmaceutical Practice. Fourth Editiion
ed. Edinburgh: Elsevier; 2009.
11. Sashkin M, Kieser KJ. Putting Total Quality Management to Work. San Francisco:
Koehler Publisher, Inc.; 1993.
12. Rinehart G. Quality Education. Milwaukee,
Wisconsin: ASQC Quality Press; 1993.
13. Robson M. Problem Solving in Groups. Cambridge: Gower Publishing Company
Limited; 1993.
14. Sallis E. Total Quality Management in
Education. London: Kogan Page Limited;
1993.
15. Anonim. Data Demograi Kota Surabaya,
2015. Surabaya: Proil Kota; 3 Januari 2015. 16. Anonim. Data Penduduk Surabaya, 2015. Surabaya: Dispendukcapil Surabaya; 3
Januari 2015.
17. Latan H, Ghozali I. Partial Least Squares:
Konsep dan Aplikasi Path Modeling
Menggunakan Program XLSTAT-PLS. Semarang: Badan Penerbit Universitas
Diponegoro; 2013.
18. Hair JF, Hult GTM, Ringle CM, Sarstedt M. A Primer On Partial Least Squares Structural Equation Modeling (PLS-SEM). Los Angeles: Sage Publication, Inc.; 2014 [cited January