U. Michel a, *, H. Thunig a, M. Ehlers b, P. Reinartz c
a
University of Education Heidelberg, Department for Geography, Czernyring 22/11'12, 69115 Heidelberg, Germany (michel, thunig)@ph'heidelberg.de
b
University Osnabrück, Institut für Geoinformatik und Fernerkundung, Barbarastraße 22b, 49076 Osnabrück, Germany c
Deutsches Zentrum für Luft' und Raumfahrt e.V., Münchner Straße 20, 82234 Oberpfaffenhofen'Wessling, Germany
! " # $%& &
' ( : Change Detection, Disaster Management, Classification, Segmentation, Monitoring, Knowledge
)
This paper focuses on change detection applications in areas where catastrophic events took place which resulted in rapid destruction especially of manmade objects. Standard methods for automated change detection prove not to be sufficient; therefore a new method was developed and tested. The presented method allows a fast detection and visualization of change in areas of crisis or catastrophes. While often new methods of remote sensing are developed without user oriented aspects, organizations and authorities are not able to use these methods because of absence of remote sensing know how. Therefore a semi'automated procedure was developed. Within a transferable framework, the developed algorithm can be implemented for a set of remote sensing data among different investigation areas. Several case studies are the base for the retrieved results. Within a coarse dividing into statistical parts and the segmentation in meaningful objects, the framework is able to deal with different types of change. By means of an elaborated Temporal Change Index (TCI) only panchromatic datasets are used to extract areas which are destroyed, areas which were not affected and in addition areas where rebuilding has already started.
'* + *
Diese Arbeit beschäftigt sich mit Change Detection Methoden in Katastrophengebieten, in denen Schäden an Gebäuden und Infrastrukturen aufgetreten sind. Bekannte und etablierte Verfahren von Change Detection Methoden sind für die schnelle Generierung von Ergebnissen oftmals nicht praktikabel, daher wurde ein neues Verfahren entwickelt und getestet. Die hier vorgestellte Methode erlaubt die schnelle Erfassung und Visualisierung von Veränderungen in Krisen' und Katastrophengebieten. Da Change Detection Methoden oftmals nicht nutzerorientiert entwickelt werden und Erfahrungen im Umgang mit Fernerkundungstechniken fehlen, können Organisationen und Behörden diese nicht anwenden. Im vorliegenden Fall wird daher ein semi'automatisierter Ansatz gewählt. Der übertragbare Ansatz ermöglicht die Anwendung der entwickelten Methode auf verschiedene Fernerkundungsdatensätze und auf unterschiedliche Untersuchungsgebiete. Mehrere Fallstudien bilden die Grundlage der Untersuchung. Durch die grobe Einteilung der Datensätze in statistische Einheiten und die Segmentierung in sinnvolle Objekte können in diesem Ansatz verschiedene Änderungsereignisse detektiert werden. Mithilfe des entwickelten Temporal Change Index (TCI) werden panchromatische Datensätze analysiert, um Flächen ermitteln zu können, die entweder zerstört, erhalten oder neu entstanden sind. order to identify changes (Radke et al., 2005). A main focus of these analyses is on ecosystems as they are in a permanent conversion (Coppin et al., 2004). Image differencing, post' classification comparison and principal component analysis are popular methods in change detection studies. During last decades artificial neural networks and spectral mixture analysis were carried out as feasible methods for change detection as well. An overview of the typical change detection methods could be found at Jianya et al. (2008) and Lu et al. (2004). In recent years change detection methods become applicable in particular to the field of disaster management (Günthert et al., 2011; Al'Khudhairy, Caravaggi, 2005).
Rapid change detection is used particularly with regard to natural hazards and disasters. This analysis leads to rapid information on areas of damage. In certain cases the lack of information after catastrophe events is obstructing supporting measures within disaster management. Earthquakes, tsunamis, civil war, volcanic eruption, droughts and floods have much in common: people are directly affected, landscapes and buildings are destroyed. In any case, geospatial data is needed to gain knowledge as a basis for decision support. Where to go first? Which infrastructure is usable? How much area is affected? These are essential questions which need to be answered before appropriate, eligible help can be established.
work language (CNL) which is implemented in
was used to design an easy to use algorithm which rely on an Temporal Change Index (TCI).
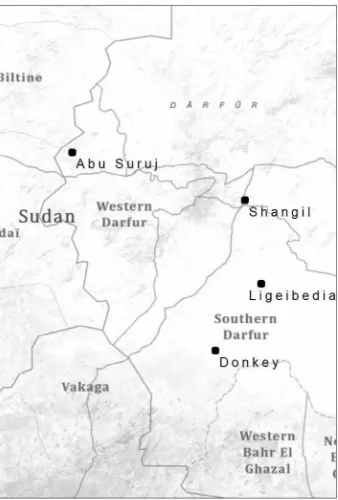
.-For the development of an automated transferable algorithm for rapid change purposes different investigation areas were used. In the focus of interest were four villages in Darfur as part of Western Sudan (see fig. 1) which were affected by civil war actions in this African region. In addition there is a small area of urban patterns in Zimbabwe (Porta Farm, a slum near Zimbabwe's capital Harare) with different housing structures to check transferability of the developed algorithms.
Figure 1. Investigation areas. Source: own representation based on Bing Maps (Copyright © 2009 Microsoft Corporation).
Darfur is experiencing a complex structure of violence that led to a civil war with a peak in the years 2004 to 2006 (Reyna 2011). The circumstances which lead to the disaster of more than 200.000 persons killed and more than 2 million displaced people are not completely clear today (Kevane; Gray, 2008). The history of colonialism since the late 19th century to the droughts in 2003 leads to damage in human settlements in great parts of Darfur (Reyna 2011). This paper focuses on rapid change detection which is useful for several applications like monitoring of ongoing war actions, monitoring of new building constructions and urban growth and detection of affected areas for disaster management. A crucial factor for fast analysis and processing is the use of remotely sensed data with sparse pre' processing and low specific requirements to gain transferability. In addition a farm with about 850 buildings, where condemnation took place, will be investigated.
The remote sensing imagery used for the development of the rapid change algorithms are very high resolution data sets with a pixel size of 2.4 meter and below (see tab. 1). To gain transferability only panchromatic datasets were used, this is a crucial factor for the mentioned application as in case of disasters quickly captured data can be treated similar because panchromatic datasets are available from nearly every remote
sensing platform. Each of the datasets was available in two time steps, before and after the disaster event. Those datasets which are available only in multispectral layers were modified by summating the channels to get a pseudo panchromatic image (in this study for Shangil). A basic pre'processing was necessary to get a coarse co'registration of the image pairs (Coppin et al., 2004). No further pre'processing was necessary.
Study Site Spatial
Table 1. Remote Sensing Data Specifications of the Different Investigation Areas
- (
The main goal of this study was to detect the changes in the investigation areas in three categories: destroyed, preserved and new constructed in a bi'temporal image change detection framework. Jianya et al. (2008) identified three general ways for change detection methods: direct comparison, post'analysis comparison and uniform modeling. In the presented study direct comparison was used in an object'oriented approach without post classification. This kind of analysis can’t be defined as belonging to any category described in the change detection review studies in (Coppin et al., 2005; Blaschke, 2005; Radke et al., 2005; Jianya et al., 2008).
!/ $ 0
separately. If the resulting objects size is similar to the parameter given during segmentation, those areas are considered as area of no interest. This step is done three times with decreasing object sizes and can be described as AOI definition. This step is somehow a basic classification without using feature space criteria. The result is thematic information about areas which are homogeneous and which are not in the focus of the change detection.
Figure 2.Schematic workflow of the analysis steps.
A standard change detection algorithm is not available within the used software; therefore the two datasets (T1 and T2) are treated like two spectral channels of one shot with two different object levels. By using a Temporal Change Index (TCI) (see eq. 1) objects of interest can be compared directly in the next step.
(1)
where ϭ = standard deviation
T1 = dataset before disaster event T2 = dataset after disaster event
The TCI is included as a feature for the appraisal of change. For the time step T1, every object of the AOI will be evaluated with the TCI. The idea behind can be described as follows: If something is damaged the structures will be smoother and sharp edges appear less clear, hence the standard deviation will be smaller. Vice versa it can be assumed that new objects, which
are only on the image object level derived from T2 will show a higher standard deviation. These circumstances can be used for dark and bright objects as well. By a logical linkage between the object level T1 and T2 objects of the AOI can be classified as ‘destroyed’, ‘new constructed’ and ‘preserved’. The evaluation of the change is done by the use of a threshold for the TCI: low values are indicating destruction while high values are allusion to new constructed areas.
# %$&
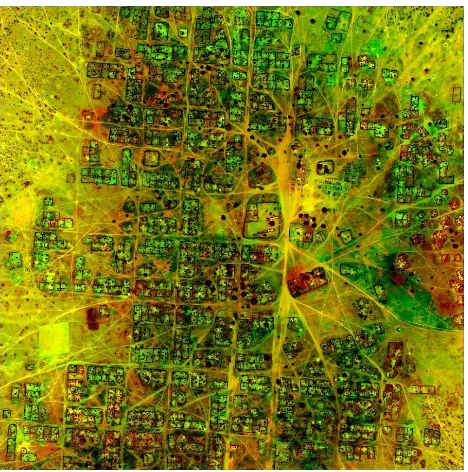
In Figure 3 a false colour composite shows the investigation area of Abu Suruj, where the red parts are indicating structures which are only in T2 and greenish areas showing objects which are only during time step T1.
Figure 3. Falscolor composit for Abu Suruj. Green = T1, Red = T2
The outcome of the transferable algorithm is shown in figure 4. The classification result is distinguished in AONI (area of no interest) and in different categories of change.
In the case of Abu Suruj (see figure 4) at time T1 little huts surrounded by fences are dominating the landscape. They are clearly visible with a darker shade when comparing to the environment. While the second image (figure 5) shows areas in south'east in detail where buildings are destroyed and in north' west some new constructions were already set up.
Figure 5. Results in detail of the Change Detection Analysis for the village Abu Suruj.
The rule set was applied to the other investigation areas and showed similar results with modified thresholds for the definition of the AOI and for the classification of damaged areas. Figure 6 gives an overview over the village Donkey where nearly all buildings were destroyed and now reconstruction took place.
Figure 6. Falscolourcomposit for Donkey. Green = T1, Red = T2
Figure 7. Results of the Change Detection Analysis for the village Donkey.
The classification result (see figure 7) was retrieved with the same rule set and only slight modifications for the thresholds. Those parts in green which are marked as ‘preserved’ are infrastructural objects like trails.
11%! 12 # # &
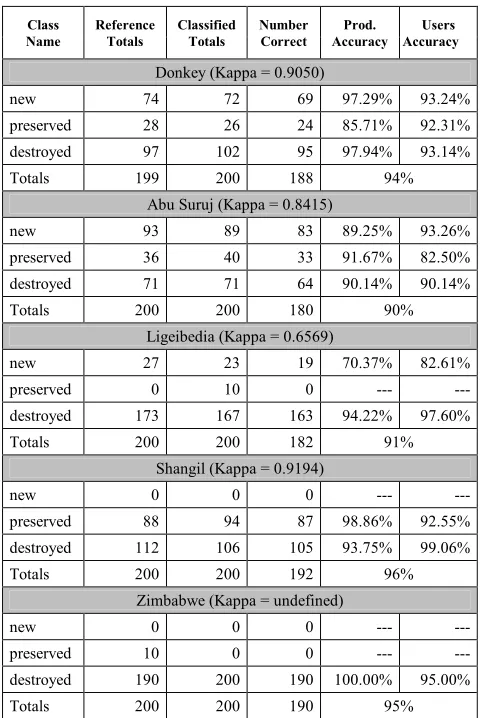
Table 2. Results of the Accuracy Assessment Calculation
The accuracy values appear to be very high when comparing to other change detection studies, especially when using only 8'bit panchromatic data for the analysis. However the restriction into three classes minimizes misinterpretation.
3- * * '
This paper presented a new rapid change detection method for disaster monitoring based on a semi'automated algorithm by means of an adapted segmentation approach and an elaborated Temporal Change Index. It shows also great promises in transferring this algorithm to different datasets and areas. Our future work will combine different algorithms which we had developed for rapid change analyses (Sofina. et al. 2011, Demharter et al. 2011, Thunig et al. 2011, Klonus et al. 2011 and Ehlers et al. 2010).
Al'Khudhairy, D. and Caravaggi, I. G. S., 2005. Structural Damage Assessments from Ikonos Data Using Change Detection, Object'Oriented Segmentation and Classification Techniques. Digital change detection methods in ecosystem monitoring: a
review ) * % 25(9), pp.
1565'1596
Demharter, T., Michel, U., Ehlers, M. und Reinartz, P. 2011. Object'based change detection: dimension of damage in residential areas of Abu Suruj, Sudan. " %
, Bellingham, WA.
Ehlers, M., Klonus, S., Tomowski, D., Michel, U. & Reinartz, P. 2010. Automated Change Detection from High'resolution
Remote Sensing images. + , + + * #
% " - . / 0 1 ' " 2
# " 3.
Günthert, S.; Wieland, M., Siegmund, A., 2011. Change Detection Analysis for Assessing the Vulnerability and Protective Effect of Beach Forests in Case of the Tsunami 2004
in Thailand. 2 # $* "* 2
, % - #,32 2011(4), pp. 247'260.
Jianya, G., Haigang, S., Guori, M., Qiming, Z., 2008. A Review of Multi'temporal Remote Sensing data Change Detection
Algorithms. % 42
" % 2
XXXXVII(b7), pp. 757'762.
Kevane, M., Gray, L., 2008. Darfur: rainfall and conflict.
5 . 2008(3).
Klonus, S., Ehlers, M., Tomowski, D., Michel, U. und Reinartz, P. 2011. Detektion von zerstörten Gebäuden in Krisengebieten aus panchromatischen Fernerkundungsdaten, S. 219'231. In: Ulrich Michel und Manfred Ehlers (Ed): " % Image Change Detection Algorithms: A Systematic Survey.
, 14(3), pp. 294'307.
Reyna, S.P., 2011. The Disaster of War in Darfur, 1950'2004.
" 6 " 7* 4 31(8), pp. 1297'1320.
Sofina, N., Ehlers, M. und Michel, U. 2011. Object'based detection of destroyed buildings based on remotely sensed data
and GIS. " % 2 & 2 6 .
Trimble, 2011. 8 9: ; ,* "e.
Trimble GmbH, München, Germany.
Thunig, H., Michel, U., Ehlers, M. und Reinartz, P. 2011. Object'based rapid change detection for disaster management.