A Nonparametric Estimation
Eric Helland
Alexander Tabarrok
a b s t r a c t
We take advantage of the fortuitous randomization of trial outcome to provide a novel strategy to identify the deterrent effect exclusive of incapacitation. We compare the post-sentencing criminal activity of criminals who were convicted of a strikeable offense with those who were tried for a strikeable offense but convicted of a nonstrikeable offense. As a robustness check, we also make this comparison in states without three-strikes laws. The identification strategy lets us estimate the deterrent effect nonparametrically using data solely from the three-strikes era. We find that California’s three-strike legislation significantly reduces felony arrest rates among the class of criminals with two strikes by 17–20 percent.
I. Introduction
California’s ‘‘three strikes and you’re out’’ legislation has been called ‘‘the largest penal experiment in American history’’ (Zimring, Hawkins, and Kamin 2001). Formulating effective penal policy for the twenty-first century requires a care-ful evaluation of the results of this experiment.1
California’s three-strikes law took effect in March of 1994. A ‘‘strike’’ is a conviction for a serious or violent felony as these are laid out in the California Penal Code. Examples of strikes include murder, rape, robbery, attempted murder, assault with intent to rape or rob, any felony resulting in bodily harm, arson, kidnapping, mayhem, burglary of occupied dwelling, grand theft with firearm, drug sales to minors, and any felony with a deadly weapon. A criminal with one strike who is convicted ofanysubsequent felony (not nec-essarily a strike) faces an automatic doubling of the sentence length on that conviction and
Names are in alphabetical order. Eric Helland is a professor of economics, Claremont-McKenna College and RAND, Claremont, California. Alex Tabarrok is a professor of economics, George Mason University. Tabarrok thanks the Center for Study of Public Choice and the Mercatus Center for financial support. Much of this work was undertaken while Helland was a visitor at the Stigler Center. He wishes to thank Sam Peltzman the Olin Foundation and the University of Chicago for their generous support. Helland also wishes to thank the Henri Salvatori Center at Claremont McKenna College for generous financial support. The authors also thank Joseph Bessett, Bryan Caplan, Robin Hanson, and two anonymous referees for especially helpful and informed comments. The data used in this article can be obtained beginning October 2007 through September 2010 from Eric Helland, 500 E. 9th Street Claremont, CA 91711 eric.helland@claremontmckenna.edu
[Submitted January 2006, accepted July 2006]
ISSN 022-166X E-ISSN 1548-8004Ó2007 by the Board of Regents of the University of Wisconsin System
T H E J O U R NA L O F H U M A N R E S O U R C E S d X L I I d 2
cannot be released prior to serving at least 80 percent of the sentence length. A criminal with two strikes who is convicted of any subsequent felony faces a prison sentence of 25 years to life and cannot be released prior to serving at least 80 percent of the 25-year term. Although other states have passed similar sounding laws, the California law is widely considered to be the most severe (Zimring, Hawkins, and Kamin 2001; Shepherd 2002). The California Attorney General’s (CAG) Office claimed that in the four years after the law was passed it resulted in 4,000 fewer murders and 800,000 fewer criminal vic-timizations (Lungren 1998). The CAG study, however, merely compared the prelaw rate with the postlaw rate and concluded that the difference represented the effect of the law. Even a simple improvement in methods such as an examination of before and after trends finds much smaller and generally insignificant effects (Stolzenberg and D’Alessio 1997; Zimring, Hawkins, and Kamin 2001; Greenwood and Hawken 2002.) The most sophisticated analysis is by Shepherd (2002) who uses a structural model estimated with county-level data and county-fixed effects. Shepherd finds that in its first two years the three-strike law resulted in just eight fewer murders but several thousand fewer aggravated assaults and nearly 400,000 fewer burglaries.
Our approach is quite different from any previous effort. Rather than examining ag-gregate crime rates and trying to correlate these with a measure of three-strikes law we follow a large subset of criminals who were released from prison in California in 1994. We estimate the effect of the law by comparing the subsequent arrest profiles of crim-inals who were released with two strikeable offenses with those released with two trials for strikeable offenses but only one conviction for a strikeable offense.
Our approach has several virtues. First, we do not need to engage in any pre- and post-law comparisons in order to identify a causal effect. All of the previous papers ultimately rely on some such comparison. Shepherd (2002) does employ a number of procedures to control for confounding factors but we know from other areas in labor economics that such procedures are not always successful or compelling (Angrist and Krueger 1999).
A second virtue of our approach is that we clearly state our identification assumption—-criminals with two strikes are comparable to assumption—-criminals with one strike and two trials for strike-able offenses—and we develop a number of teststrike-able auxiliary hypotheses based upon this assumption. If our identification assumption is true, for example, we should find few differ-ences in observable characteristics between the two types of criminals. We also should find few outcome differences in states that do not have three-strikes laws—thus, in addition to Cal-ifornia we look at data from New York, Illinois, and Texas. Further tests are discussed below. Most papers on criminal deterrence cannot distinguish deterrence from incapacitation.2 The distinction is vital for policy because the same reduction in crime is cheaper if
produced by deterrence than if produced by incapacitation. (In addition, the existence and size of the deterrent effect is considerably more controversial than that of the in-capacitation effect.) The third virtue of our paper is that we estimate the effect of three-strikes laws not on an aggregate measure of crimes but on the behavior of a specific group of criminals—thus, we measure deterrence exclusively.
Our approach does have a significant limitation. As noted above, we estimate the deterrent effect by comparing the arrest profiles of criminals with two strikes to crim-inals with one strike (conditioning on the number of convictions). We think that this provides a more compelling estimate of the causal effect of three-strikes laws than other approaches. Reduction in bias usually comes at a price, however, and in this case the price is that we identify the marginal and not the total deterrent effect of the law. As Shepherd (2002) notes, ‘‘fear of the first strike’’ can deter potential crim-inals from ever launching a criminal career. Thus, stated differently, our procedure estimates the substitution effect rather than the income effect.
II. Data and Econometrics
The data for this study are derived from the United States Depart-ment of Justice Bureau of Justice Statistics’ Recidivism of Prisoners Released in 1994 (BJS 2002).3 The data are a random sample of 38,624 individuals who were released from prison in 1994 including 7,183 who were released in California. The data contain extensive information on the released prisoner’s entire criminal his-tory prior to release.4We have data, for example, on one released prisoner whose first arrest was in 1944. The criminal history data lets us precisely identify the number of potential strikes a criminal has upon release in 1994.5The three-strikes law became operative on March 4, 1994,6which is when we define the onset of risk.7The data also contains equally extensive information on the criminal history of each releasee in the three years following release.8
3. ICPSR number 3,355.
4. The history is derived from state and FBI ‘‘Records of Arrests and Prosecutions,’’ also known as RAP sheets. Records regarding petty offenses such as traffic violations are not generally included. Records for juveniles administered by the juvenile justice system are not generally included but records for juveniles who are transferred to adult court are included—we discuss juveniles at greater length below.
5. Prosecutors are required by law to allege and prove all strike convictions of which they are aware al-though some prosecutors are more lax than others in researching criminal histories. A prosecutor and, sub-sequent toPeople v. Superior Court (Romero)(1996) 13 Cal.4th 497, 529-30, a judge can dismiss a strike in the furtherance of justice. See further below for alternative definitions of strikes that attempt to control for this issue.
6. The three-strikes law was in effect passed twice, first in March of 1994 by the legislature (Ca. Stats. 1994, ch 12 (AB971), codified as Ca. Penal Code Section 667(f)(2) and again in November of 1994 by ref-erenda as Proposition 184 codified as Section 1170.12. The two statutes are almost identical.
7. The three-strikes law is likely to deter some crimes even before being implemented because a serious or violent crime committed before the law is passed is counted as a strike when computing penalties for future crimes. We thus also ran our models including January and February of 1994 as at-risk months. Results were virtually identical.
Further below, we discuss data limitations and several alternative definitions of strikes that we use to check for robustness.
III. Identification Procedure
Ideally, to identify the causal effect of a treatment we need to observe two outcomes: an outcome if the individual is treated, YT, and an outcome if the same individual is not treatedYNT. The treatment effect is thenYT2YNT. But a direct computation ofYT2YNT is impossible because we cannot observe an individual in the counterfactual state of the world where treatment did not occur (Rubin 1974). All methods of evaluation, therefore, must replace counterfactuals with ‘‘comparables.’’ An untreated group is a good comparable for a treated group if on average the treated and untreated group do not differ. Good comparables are statistical doppelgangers. The best case for comparability occurs when treatment is randomly assigned. In the absence of random assignment we must seek out a fortuitous source of random variation in treatment—a so called ‘‘quasi-experiment.’’
Criminals with one or two previous strikes face enhanced penalties if they commit an additional felony. Thus, the ‘‘treatment’’ in our application is an individual’s stock of strikes. The causal effect on deterrence of having two previous strikes, for example, is the difference between the actual number of crimes committed and the number of crimes that would have been committed if the same individuals had say one previous strike. Consider the naı¨ve procedure of comparing the criminal histories of criminals with two strikes with the criminal histories of those with one strike. Even if we were to control for other variables, the latter group is unlikely to be a good comparable for the former. Criminals with two strikes have more strikes than those with one strike for a reason—most probably because they engage in more criminal activity. Thus, we need a source of randomization that creates two similar individuals yet with differ-ent strike records.
Our strategy to identify the causal effect of two- and three-strikes laws on criminal activity is to make use of the fortuitous randomization of trial.9Consider two indi-viduals both of whom are tried for a strikeable offense but only one of whom is con-victed of that offense while the other is concon-victed of a lesser, nonstrikeable offense, perhaps due to a plea-bargain. The former individual is subject to the three-strikes law but the latter is not. Our identification assumption is that these individuals are comparable because the outcome of the trial is to a considerable degree stochastic. How strong is the evidence? Is there a good eyewitness to the crime? How good is the defense lawyer relative to the prosecutor? How lenient or strict is the judge or jury? How eager is the prosecutor to cut a deal? How overcrowded are the jails? All of these factors will help to determine trial outcome but can be considered ran-dom with respect to other variables that might affect criminal disposition—thus pro-viding us with a good quasi-experiment.
It is important to note that we exclude anyone who was acquitted of all charges and focus our attention on the set of criminals who were tried for a strikeable offense but were convicted of a nonstrikeable offense. Thus, virtually everyone in our sample was convicted of a serious, even if nonstrikeable, offense.
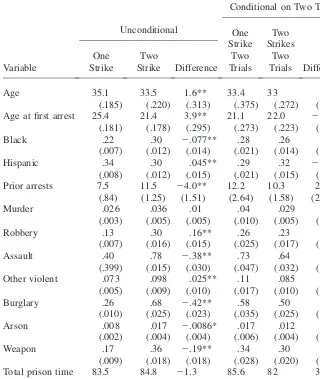
As a test of whether our identification assumption is plausible we examine differ-ences in predetermined variables across strikes unconditional and conditional on two trials. Table 1 indicates that there are large and statistically significant differences in a number of variables such asAge, Age at First Arrest, Black, Prior Arrests, number of arrests for Burglary, Assault,etc. when comparisons are made across individuals with one or two strikes but no large differences in such variables when we condition on two trials (and two convictions). Note, for example, that blacks make up a signif-icantly larger proportion of criminals with two strikes (30 percent) than those with one strike (22 percent). But when we restrict attention to criminals, all of whom have had two trials, there is no longer a statistically significant difference in the proportion of blacks with two strikes (26 percent) than with one strike (28 percent). Similarly, we look at the number of prior arrests for a variety of crime categories. The average criminal with one strike had previously been arrested for 0.26 burglaries while the average criminal released with two strikes had been arrested for 0.68 burglaries (reflecting the fact that burglary has a very high recidivism rate). When we condition on two trials, however, the difference virtually disappears (0.58 to 0.50).
It is also worth pointing out that we find no statistically significant differences in the total time served across the two criminal classes. This is because criminals not convicted of a strikeable offense are still convicted of a serious felony so while we might expect some differences these are not large. Since total prison time served is similar across the two classes of criminal, our results are not likely to be due to rehabilitation. After we condition on two trials, the only difference which remains statistically significant at the 5 percent level or higher is in age at first arrest but the difference declines from almost four years in the unconditional sample to less than one year in the conditional sample.10
The fact that our identification strategy appears to be identifying a randomized sample across observables increases our confidence that it will also do so across unobservables. Later we test the identification strategy in another way.
Even if our identification procedure produces fortuitous randomization across indi-viduals it may not do so across crimes if crime conviction rates and subsequent arrest hazards differ. We discuss and control for this issue further below.
IV. Methods
We estimate the survival function, the probability of not being arrested as of timet, using the nonparametric Kaplan-Meier model. The KM model produces an estimate of the survivor functionSðtÞ, defined as
Table 1
Distribution of Observables by Number of Strikes Unconditional and Conditional on Two Trials
(.185) (.220) (.313) (.375) (.272) (.469)
Age at first arrest 25.4 21.4 3.9** 21.1 22.0 2.84*
(.181) (.178) (.295) (.273) (.223) (.372)
Black .22 .30 2.077** .28 .26 .018
(.007) (.012) (.014) (.021) (.014) (.025)
Hispanic .34 .30 .045** .29 .32 2.02
(.008) (.012) (.015) (.021) (.015) (.026)
Prior arrests 7.5 11.5 24.0** 12.2 10.3 2.0
(.84) (1.25) (1.51) (2.64) (1.58) (2.92)
Murder .026 .036 .01 .04 .029 .011
(.003) (.005) (.005) (.010) (.005) (.103)
Robbery .13 .30 .16** .26 .23 .03
(.007) (.016) (.015) (.025) (.017) (.029)
Assault .40 .78 2.38** .73 .64 .08
(.399) (.015) (.030) (.047) (.032) (.057)
Other violent .073 .098 .025** .11 .085 .029
(.005) (.009) (.010) (.017) (.010) (.019)
Burglary .26 .68 2.42** .58 .50 .076
(.010) (.025) (.023) (.035) (.025) (.043)
Arson .008 .017 2.0086* .017 .012 .0046
(.002) (.004) (.004) (.006) (.004) (.007)
Weapon .17 .36 2.19** .34 .30 .033
(.009) (.018) (.018) (.028) (.020) (.035)
Total prison time 83.5 84.8 21.3 85.6 82 3.6
(months) (8.35) (2.17) (12.53) (25.4) (2.65) (18.1)
Observations 3,163 1,425 473 974
ˆ SðtÞ= Y
jjtj,t nj2dj
nj
ð1Þ
wherenjis the number of released prisoners at risk at timetjanddjis the number of arrests at timetj(j indexes the observation times).
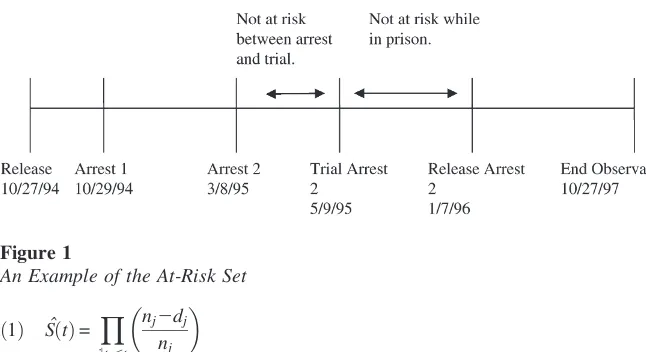
As the above equation makes clear there are two critical values in the computation. The first is the number of arrests (‘‘failures’’). The second is the number of released prisoners still at risk,nj. The construction of the latter is complicated by the fact that individuals can exit and reenter the risk set. Consider Individual 2,150 who was re-leased on October 27, 1994. Two days latter he is arrested on drug trafficking charges that are later dropped. He is arrested again on March 8, 1995, tried on May, 9 1995, and sentenced to prison. He is released from prison on January 7, 1996 and is not rearrested during the remainder of the three-year tracking period which ends on October 29, 1997. A graph of 2,150’s duration is found in Figure 1.
Entry and exit from the risk set raises two issues. Clearly, 2,150 is not at risk be-tween May 9, 1995 and January 7, 1996 when he is in prison. More problematic is whether 2,150 is at risk between March 8, 1995 when he was arrested and his trial on May 9, 1995. Most defendants are released before trial but substantial minorities are not and the data do not contain any information on pretrial release status.11In gen-eral, it is better to assume that the individual is not under observation during the questionable period because missing observations per se will not bias the results so long as we systematically exclude such individuals from both the risk set and the failure set. Thus, in the results below we have assumed that individuals are not under observation in the spell between arrest and trial dates. To check for robust-ness, however, we also have estimated the model by assuming that all such individ-uals remain at risk. The results, available upon request, are virtually identical.
V. Results
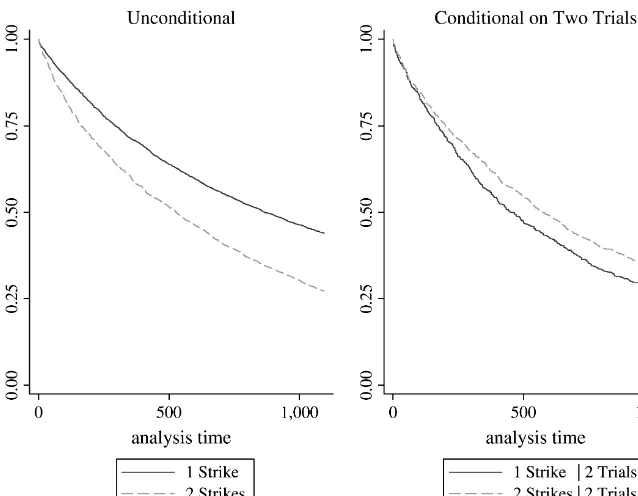
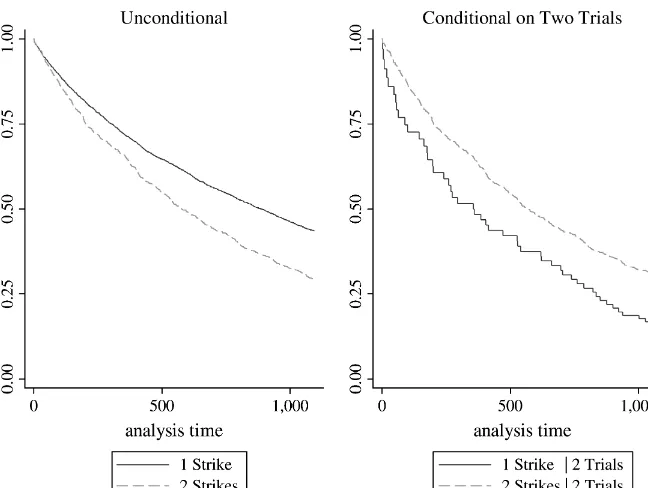
Panel A of Figure 2 presents theunconditionalsurvival functions of released prisoners with one and two strikes (where survival means not rearrested and
Figure 1
An Example of the At-Risk Set
a failure is an arrest for any crime). Releasees with two strikes, who are subject to a third strike for any new felony conviction, aremorelikely to be rearrested than those with one strike. The difference indicates a considerable selection effect and verifies the difficulty with the naı¨ve estimator discussed above. Panel B focuses attention on the subsequent arrest history of releasees with one or two strikes conditional on every releasee having faced two trials and having been convicted of two charges. In distinction to the results of Panel A, the survival functions now reverse—criminals with two strikes arelesslikely to be subsequently arrested.
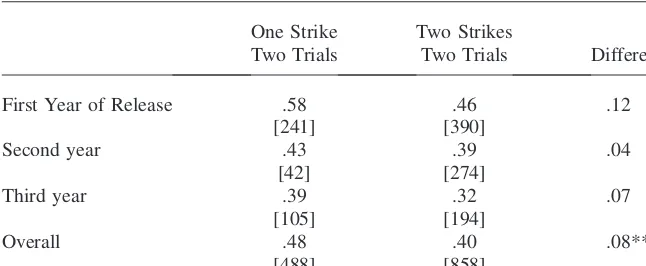
The difference in arrests rates is also of policy significance. Table 2 shows person-year arrest rates by person-year following release. Differences in arrest rates appear to be largest in the first year, 12 percentage points, declining to four and seven percentage points respectively in the second and third year. The individual year differences are not statistically significant but the overall difference is highly statistically significant. We estimate that the threat of a third strike reduces arrest rates by 8.3 percentage points or 17.2 percent (an arrest rate of 0.482 per person-year with one strike and 0.399 with two strikes). The difference is statistically significant at the greater than 1 percent level (p= .001) using a Peto-Peto test (Peto and Peto 1972).12
Figure 2
Time to Rearrest for Criminals with One or Two Strikes: California
VI. Data Issues and Testing Robustness
Our measure of strikes may over or underestimate strikes as defined in practice by a California prosecutor. We describe some of these potential differ-ences and to test the robustness of our estimates we employ two alternative defini-tions of a strike.
Some juvenile crimes can count as strikes and if the record is sealed we would not have data on the prior strike. In practice, however, this is not a problem in our data. First, crimes committed by juveniles under the age of 16 cannot count as strikes at all and not all strikeable crimes for adults are strikeable crimes for juveniles. In partic-ular, residential burglary, a common strike for adults, is not a strike for juveniles (Packel 2002). Second, during the time period our data covers, 1994–97, it was widely thought that juvenile crimes could not count as strikes because juveniles do not have the same protections afforded to adults in criminal law (for example the right to bail or a jury trial). For this reason, the Judicial Council of California recommended that trial judges not use juvenile adjudications as strikes (Packel 2002).13Third, and most importantly, very serious juvenile crimes, the ones most
likely to lead to strikes, will result in a transfer to the adult court where records arenotsealed even for juveniles. In fact, precisely for this reason, our data includes information on many crimes committed by juveniles.
A potentially more serious issue is that judges and prosecutors have con-siderably leeway to dismiss strikes.14Walsh (2004) estimates that in urban counties
Table 2
Person-Year Arrest Rates by Year
One Strike Two Strikes
Two Trials Two Trials Difference
First Year of Release .58 .46 .12
[241] [390]
Second year .43 .39 .04
[42] [274]
Third year .39 .32 .07
[105] [194]
Overall .48 .40 .08***
[488] [858]
Note: Number of failures in brackets.
*** Statistically significant at the greater than 1 percent level.
13. It was not until the end of our sample period that the California Supreme Court established that some juvenile crimes could be considered strikes in People v. Davis (938 P. 2d 938 (Cal. 1997)).
25–45 percent of eligible three-strike offenders will have a prior strike dismissed. The Los Angeles District Attorney’s Office indicates that strikes may be dismissed if they were remote in time, did not involve a weapon or victim injury, or involved mitigating factors such as unusual circumstances or provocation.15
In addition, the Bureau of Justice Statistics (BJS) definitions do not align exactly with the California definitions of a strike. Throwing acid, for example, is a strike but is not listed as such in the BJS data. More importantly, the California definitions sometimes depend on whether the victim was a minor. Continuous sexual abuse of a child, for example, is a strike. We have data on rape or other sexual assault but we do not have good data on whether the victim was a child or whether the assault was continuous. Drug trafficking of some drugs is a strike but only if the buyer was a minor and again, we do not have good data on the victim.
In our initial results we have erred on the side of inclusiveness, including offenses, for example, that might be dismissed by prosecutors or judges or that might be strikes only if they were committed against minors. To check for robustness we now restrict the sample in two ways. First, we restrict to crimes that are inherently violent and un-likely to be dismissed, such as murder, voluntary manslaughter, rape, kidnapping, sex-ual assault, robbery, and aggravated assault. The results are shown in Figure 3.
Using the more restricted definition of strikes we find a considerably larger deter-rent effect than found earlier. We estimate that the three-strikes sentence enhance-ment decreases arrest rates by those with two strikes by 22.3 percentage points or a decline of 35 percent, statistically significant at the greater than 1 percent level (p= .005). We caution, however, that this larger estimate is based upon just 51 obser-vations in the one-strike two-trials group (with a person-year arrest rate of 0.64) and 680 observations in the two-strikes, two-trials group (with a person-year arrest rate of 0.41).
It’s quite likely that in some respects we have better data than would be available to the typical California prosecutor. As noted we have data on one criminal going back to 1944—few prosecutors would comb the files to find this information. For this reason and because prosecutors or judges may dismiss prior strikes that are ‘‘remote in time’’ we return to the initial data but now count as a strike a qualifying offense only if it was committed in the ten years previous to the defendant’s release.
Using prior strikes from the previous ten years, we estimate an effect almost iden-tical to that found earlier, a decrease in arrest rates of those with two strikes of 8.0 percentage points or 15.1 percent (an arrest rate of 0.53 per person-year with one strike and 0.45 with two strikes). The difference is statistically significant at the greater than one percent level (p= .009).
VII. Comparing California with other States
Our tests for deterrence will estimate the effect of any systematically higher punishments for repeat offenders, not just the three-strikes law. Judges and juries, for example, are likely to mete out harsher punishments for repeat offenders
and we will capture any deterrence from this effect in our estimates. California’s three-strikes law, however, is the harshest recidivism statute in the country and it increases punishments sharply and discontinuously at the third strike. The disconti-nuity is striking: The average prisoner sentenced under California’s two-strikes law, which already doubles punishments and reduces the opportunity for parole, serves just 43 months but not a single prisoner sentenced under three-strikes has yet been released (Brown and Jolivette 2005).16Thus, we expect that absent the law we would not see as strong shifts in the survival function as are evident in Figures 2 and 3.
We can better estimate the effect of the three-strikes law as opposed to the ‘‘nor-mal’’ progression of punishments by comparing California with three other states, Illinois, New York, and Texas. We use these states because the sample size gets small when we condition on two trials and these are the three largest states in our data set without anofficially designatedthree-strikes law.17
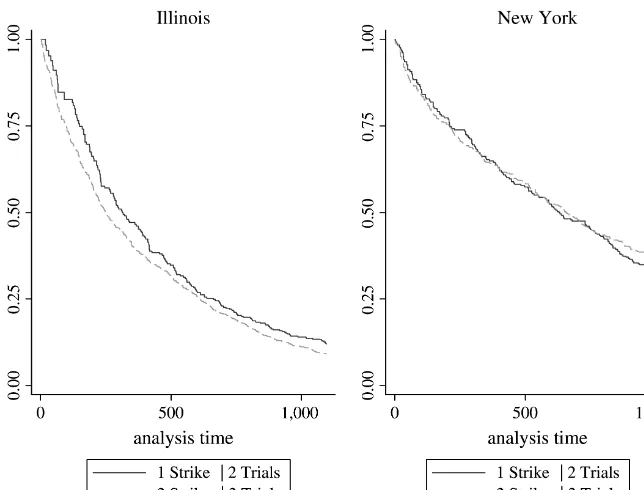
Figure 4 shows survival functions for criminals released in Illinois and New York, defined exactly analogously to those in Panel B of Figure 2. That is, we look, con-ditional on two trials, at the difference in arrest history of criminals released with one
Figure 3
Time to Rearrest for Criminals with One or Two Strikes: California: Violent Crimes Only
and two ‘‘strikes’’. (Strikes now in quotes since neither Illinois nor New York has a three-strikes law.) Once we condition on two trials, Illinois shows a small but statis-tically insignificant difference between criminals with one and two strikes. (More-over, the effect is in the ‘‘wrong’’ direction and suggest, if anything, that the three-strikes law is even more effective than we estimate based on California alone). In New York, once we condition on two trials, there are no evident differences be-tween criminals with one or two strikes.18
The failure to find systematic differences between the arrest histories of similar one and two strike criminals in New York and Illinois suggests that the ‘‘normal’’ progression of punishments is not large enough or sharp enough to generate signif-icant evidence of deterrence in our data. It’s plausible, therefore, that the effect we estimate in California, is due primarily to the three-strikes law and not the normal punishment progression found in many other states.
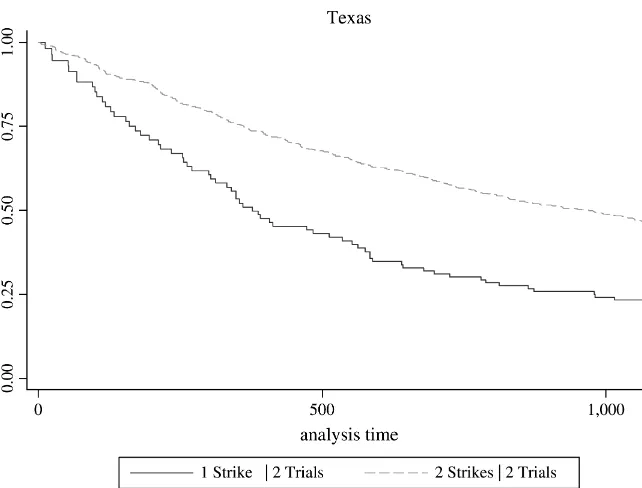
The results from Texas, however, shown in Figure 5 initially led us to question our last result. Contrary to what we found in New York and Illinois, Texas shows signif-icant deterrence. Yet, Texas is not conventionally listed as having a three-strikes law—for example, Austin et al. (1998) in a U.S. Department of Justice study list
Figure 4
Time to Rearrest for Criminals with One or Two Strikes: Conditional on Two Trials
Texas as not having a three-strikes law as do Marvell and Moody (2001); Schiraldi, Colburn, and Lotke (2004) and many others. The results from Texas gave us pause but it seemed peculiar that Texas, well-known as a tough-on-crime state, should not have a three-strikes law. Further investigation, however, revealed that not only does Texas have a three-strikes law, Texas, not California, pioneered these laws.
The Supreme Court case Lockyer v. Andrade 538 U.S. 63 (2003) is well-known, even infamous, because it upheld California’s three-strike law as it applied to Lean-dro Andrade, who was sentenced to 50 years to life for two petty theft shoplifting incidents involving a total of $153.54 of videotapes. Less well-known is an earlier case with similar facts that the Supreme Court cited in support of its decision in Lockyer v. Andrade. In Rummel v. Estelle (445 U.S. 263 (1980)) the Supreme Court upheld the sentence of William James Rummel who was given alife prison sentence
for three nonviolent felonies that occurred over a 15-year period (credit card fraud in the amount of $80, a forged check in the amount of $28.36, and obtaining $120.75 by false pretenses). Rummel had the unfortunate luck to have committed his crimes in Texas whose ‘‘Texas Recidivist Statute,’’ as indicated in Art. 63 of its Penal Code provided that ‘‘[w]hoever shall have been three times convicted of a felony less than capital shall on such third conviction be imprisoned for life in the penitentiary.’’19 Figure 5
Time to Rearrest for Criminals with One or Two Strikes Texas: Conditional on Two Trials
California is universally listed as pioneering three-strikes law but in fact what they pioneered was a catchy name. Previous studies that do not list Texas as a three-strikes state are misspecified.
In Texas we find that criminals with two strikes are 50 percent less likely to be rearrested than similar criminals with one strike (a 26 percentage point fall from 0.52 per year to 0.26 per year). The effect in Texas is much larger than that in Cal-ifornia but the estimate is based on only 63 failures in the one strike, two trials group (and 335 failures in the two strikes, two trials group for 398 observations overall). The fact that we find large effects of three-strikes in California and Texas but not in New York and Illinois, however, is reassuring.
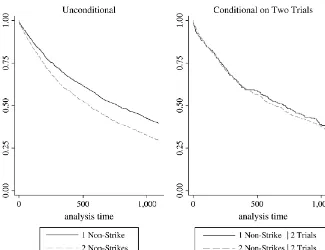
Rather than testing the identification assumption by looking at the same crimes in different states we can look at crimes not subject to three-strike laws in the same state. In Figure 6 we examine the time to rearrest of criminals with nonstrikeable convictions in California. Panel A shows the unconditional survival functions. As be-fore criminals with two (nonstrikeable) convictions are more likely to be rearrested. Conditional on having had two trials (Panel B), however, the survival functions of criminals with one and two nonstrikeable convictions are statistically identical (p= .5). Thus, in the tradition of Koch’s postulates, our identification procedure finds a deterrence effect when deterrence is expected to operate and no effect is found when deterrence is not expected to operate.
VIII. Robustness using a Proportional Hazards Model
Although our identification procedure will randomize within crimes, differing conviction rates across crimes will lead to a different mix of crimes in the two categories. If the hazard rates for further felony arrests differ significantly across crime histories, this could be a source of bias. (Note, however, that previous strikes re-sult in penalty enhancements foranynew felony conviction so the issue is not the re-cidivism rate for the same crime but the rere-cidivism rate for any new felony and the latter is likely to differ by less than the former by crime history). To control for this possibility and the possibility that other demographic factors may differ even after conditioning by trial we ran a semiparametric Cox proportional hazards model. We include data from California, Texas, and the two non three-strikes states, Illinois and New York.
The Cox model assumes that the hazard rate for releaseejis
hðtjxjÞ=h0ðtÞexpðxjbÞ;
ð2Þ
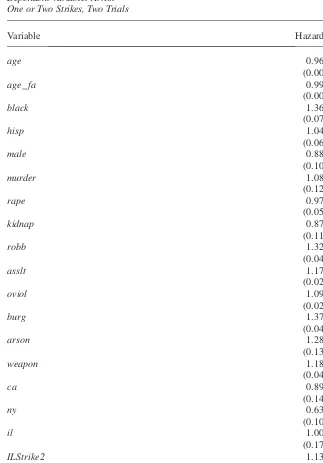
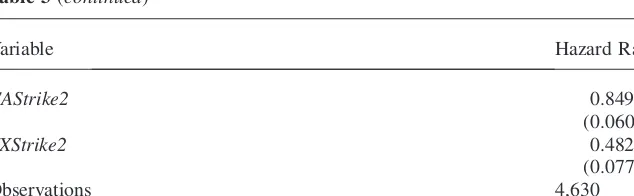
wherexjare the independent variables andbare the coefficients to be estimated. The principle advantage of the Cox model is that it does not require any assumptions about the shape of the baseline hazard rate (which is not even estimated). Instead, the Cox model estimates the proportional change in the hazard rate with respect to the indepen-dent variables. Note that the coefficients reported in Table 3 are exponentiated and so can be interpreted directly as the proportional shift in the hazard rate (probability of arrest).
indicate the number of arrests for each type of crime that the individual received prior to release in 1994. Thus the crime variables control for a criminal’s history. We focus on the main strikeable crimes. As before, we control for the number of tri-als resulting in convictions so the regression is run on crimintri-als all of whom have two convictions but either one or two strikes. We include state fixed effects and an interaction term for two strikes in California—thus, the coefficient on the interac-tion is the difference-in-difference estimator.
The basic results on the control variables can be quickly summarized. The prob-ability of rearrest declines in age and is higher for blacks than nonblacks. Rearrest is also higher among crimes of income such as robbery and burglary, more surprisingly rearrest rates are considerably higher for those with previous arson arrests even though vandalism and revenge are more often motives for arson than financial gain.20 The results of most interest are that in New York and Illinois the coefficients on ‘‘Two Strikeable Convictions’’ are close to one (no shift in the hazard rate) and sta-tistically insignificant. In Texas, the coefficient is 0.48 indicating a drop in the hazard rate of rearrest of just over 50 percent—this is very similar to what we found in the nonparametric estimation. Similarly, in California criminals with two strikes have an
Figure 6
Time to Rearrest for Criminals with One or Two Non-Strikeable Convictions: California
Table 3
Proportional Hazards Model Dependent Variable: Arrest One or Two Strikes, Two Trials
arrest rate approximately 15 percent lower than similar criminals with one strike. This is very similar to the 17.2 percent reduction we found using the nonparametric estimation (recall that this is conditioning on two trials and now also controlling for demographics and crime histories, the similarity in results again bolsters our hypoth-esis of randomization in trial outcome.)
IX. Heterogeneity
We have estimated deterrence assuming that all criminals are equally deterred by the prospect of a third strike sentence enhancement. We now ask whether there is evidence of heterogeneity in criminal response. Figure 7 looks at young versus old criminals where we define old (with apologies to our audience and regrets for our-selves) as anyone 30 years of age or older. The old are less likely to commit crimes than the young, so the top two survival functions in Figure 7 are for the old with the solid lines representing two strikers and the dashed lines one-strikers (conditional on two tri-als in both cases). The old two-strikers have a person-year failure rate of 0.309 and the old one-strikers a person-year failure rate of 0.395 for a difference of 8.6 percentage points or a decrease in arrest rates of 21.7 percent (p= 0.007). For the young the rates are 0.575 for two-strikers and 0.684 for one-strikers for a difference of 10.9 percentage points or a decrease in arrest rates of 15.9 percent (p= 0.034). Although the old commit fewer crimes than the young, the evidence for an interaction effect between age and strikes is weak; we cannot reject the null hypothesis of no difference.21
We also examine hard-core criminals versus soft criminals. We regress log prior arrests on age, black, age*black, age-squared, and age-cubed and then define a hard-core criminal as one who has more than one standard deviation from the mean age-race-controlled prior arrests.22Figure 8 presents the results. As expected, soft criminals
are less likely to be rearrested (the top two lines in Figure 8) but within both categories
Table 3(continued)
Note that coefficients are exponentiated (standard errors in parentheses are for the exponentiated coefficient). Standard errors are clustered by defendant.
* significant at 5 percent ** significant at 1 percent
21. To conduct the test we use a Cox proportional hazards model withold,two strikes, and an interaction as independent variables.Oldandtwo strikesare statistically significant and of the expected sizes but the in-teraction is not close to statistically significant.
two-strikers are less likely to be rearrested than one-strikers. For soft criminals the person-year arrest rates are 0.379 for one-strikers and 0.460 for two strikers for a dif-ference of 8.1 percentage points or a decrease of 17.6 percent (p= 0.001). For hard-core criminals the arrest rates are 0.59 for two-strikers and 0.679 for one-strikers for a dif-ference of 8.9 percentage points or a decrease in the person-year arrest rate of 13 per-cent (this difference comes from a small sample and is not statistically significant). Hard-core criminals are significantly more likely to be rearrested but we cannot reject the null hypothesis of no interaction between hard-core/soft-core and strikes.
X. Total Crime Deterrence
We find that California’s three-strike legislation reduces felony arrests rates among the class of criminals with two strikes by 15–20 percent per year with some estimates as high as 30 percent depending on sample and specification. Using a figure of 17.5 percent as our best estimate of the decrease in crime among those with two or more strikes we can do some back-of-the-envelope calculations concerning reductions in total crime. Using samples from three large California cities in 1993, Zimring, Hawkins, and Kamin (2001) estimated that just 4.3 percent of crime is committed by criminals with two or more strikes. Assuming that crimes
Figure 7
Deterrence ofÔYoungÕversusÔOldÕ
are deterred in the same ratio as arrests and using the 2002 figure on FBI Index crimes for California of 1,393,649 (the FBI index approximates the three-strikes law’s definition of violent and serious crimes) we find that the two-strike provision of the law deters on the order of 1,393,649*0.043.*0.175/(120.175) = 12,712 crimes per year.23The FBI index is based on reported crimes but victimization surveys con-sistently find that a majority of crimes are not reported to the police (BJS 2001). Crime estimates based on victimization surveys suggest that total crime, and thus also total deterrence, should be inflated by a factor of approximately 2.08 for violent crimes and 2.8 for property crimes (see BJS 2001, p.10) so total crime deterrence is in the realm of at least 31,000 (2.5*12, 712) crimes per year.
Deterrence in the realm of 31,000 crimes a year is not without importance but the three-strikes law also requires that considerable resources be spent on long-term, expensive imprisonment. Three-strikes prisoners must serve at least a 20-year sen-tence before they are eveneligiblefor parole and some will never be released. As-sume a 22-year or 264-month average sentence. The average prisoner sentenced
Figure 8
Deterrence of Hard-Core and Soft Criminals California: Conditional on Two Trials
undertwo-strikesserves 43 months (Brown and Jolivette 2005), if we take that as the counterfactual sentencing scheme but assume a 64-month average sentence to ac-count for a worse mix of crimes among the three-strikers then the increase in prison time is 200 months or 16.6 years per prisoner.24In California it costs $35,000 to
in-carcerate the typical inmate and more for elderly inmates so extra prison costs amount to at least $583,333 per prisoner. It’s difficult to estimate the equilibrium number of prisoners under three-strikes since the number is still increasing and none can be paroled until at least 2014. The rate has stabilized in recent years around 7,500, however, and is now increasing only slowly. If we use 8,000 as an equilibrium estimate the total imprisonment cost for third strikers is $4.6 billion ($0.58 million * 8,000 prisoners) or $148,000 per crime avoided.25This is a large number given es-timated costs per average crime are in the ball park of $34,000.26
Calculations of this sort are inherently open to question. It may be better, there-fore, to ask not whether the three-strikes law is cost-effective relative to the cost of crime but whether it is cost-effective relative to other ways of reducing crime. Us-ing elasticities of police on crime from the literature, Donohue (2005) and Tabarrok and Klick (2006) estimate that $4.6 billion of new police hiring could reduce national crime by around one million crimes, far in excess of the crime reduction caused by three-strikes.
Alternatively we could imagine holding prison costs constant but reallocating from old to young prisoners. Since crime rates decline with age, imprisoning two 20-year-olds for ten years each may create more crime reduction than imprisoning one 40-year-old for 20 years. The public also may be better protected by imprisoning for life a first-time rapist rather than a two-time thief.
We do not resolve all of these issues here. Nevertheless, with the improved esti-mates of deterrence that we have presented these questions can be better evaluated.
XI. Conclusion
We take advantage of the fortuitous randomization of trial outcome to provide a novel strategy to identify the deterrent effect exclusive of incapacitation. The identification strategy allows us to estimate the deterrent effect nonparametri-cally using data solely from the three-strikes era. We find that the third-strike provi-sion of California’s three-strike legislation significantly reduces felony arrests rates among the class of criminals with two strikes by 17 to 20 percent.
24. Our identification procedure estimates the marginal or substitution effect of the third strike of the three-strikes law. There is also an inframarginal or income effect, greater punishments for the third strike may make a ‘‘life of crime’’ less desirable thereby decreasing crime among those with no strikes. Estimating the total effect of the three-strikes law, however, requires, in our judgment, a less credible research design and estimates range widely. For example, compare Shepherd (2002) with Stolzenberg and D’Alessio (1997), or Zimring, Hawkins, and Kamin (2001). By focusing on just the third-strike element of the three-strikes law, and assuming that the counterfactual sentencing scheme is the two-strikes scheme, we avoid some of these problems because the income effect from the two-strikes scheme will still be in place. 25. Future spending should be discounted but so should future crimes. For our back of the envelope cal-culation we assume the same discount rate and so can ignore this complication.
References
Austin, James, John Clark, Patricia Hardyman, and D. Alan Henry. 1998. ‘‘Three-strikes and You’re out: The Implementation and Impact of Strike Laws.’’ Washington D.C.: National Institute of Justice—U.S. Department of Justice.
Angrist, Joshua D., and Alan B. Krueger. 1999. ‘‘Empirical Strategies in Labor Economics.’’ InHandbook of Labor Economics, Vol. III, ed. Orley Ashenfelter and David Card, 1281–1366. Amsterdam: North-Holland.
Brown, Brian, and Greg Jolivette. 2005.A Primer: Three-strikes—The Impact After More Than a Decade.California Legislative Analyst’s Office (LAO). http://www.lao.ca.gov/ 2005/3_Strikes/3_strikes_102005.htm.
Bureau of Justice Statistics (U.S. Department of Justice). 2001.Criminal Victimization 2000: Changes 1999-2000 with Trends 1993-2000.Report NCJ 187007. http://www.ojp. usdoj.gov/bjs/pub/pdf/cv00.pdf.
Cameron, Samuel. 1988. ‘‘The Economics of Crime Deterrence: A Survey of Theory and Evidence.’’Kyklos41(2):301–23.
Donohue, John J. 2005. ‘‘Fighting Crime: An Economist’s View.’’Milken Institute Review
Quarter 1:47–58.
Greenwood, Peter W., and Angela Hawken. 2002. ‘‘An Assessment of the Effects of California’s Three-strikes Law.’’ Greenwood and Associates Working Paper.
Helland, Eric, and Alexander Tabarrok. 2004. ‘‘The Fugitive: Evidence on Public Versus Private Law Enforcement from Bail Jumping.’’Journal of Law and Economics47(1): 83–122.
Kessler, Daniel, and Steven D. Levitt. 1999. ‘‘Using Sentence Enhancements to Distinguish Between Deterrence and Incapacitation.’’Journal of Law and Economics42(1): 343–63.
Lungren, Daniel. 1998.California Attorney General Report on Three-strikes.http:// www.threestrikes.org/cag98_pgone.html
Marvell, Thomas B., and Carlisle E. Moody. 2001. ‘‘The Lethal Effects of Three-Strikes Laws.’’Journal of Legal Studies30(1):89–106.
Miller, Ted R., Mark A. Cohen, and Brian Wiersema. 1996. ‘‘Victim costs and consequences: A new look.’’ Report NCJ 155282. Washington, D.C.: National Institute of
Justice—U.S. Department of Justice.
Nagin, Daniel S. 1998. ‘‘Criminal Deterrence Research at the Outset of the Twenty-First Century.’’Crime and Justice: A Review of Research23:1–42.
Packel, Amanda. 2002. ‘‘Juvenile Justice and the Punishment of Recidivists under California’s Three-strikes Law.’’California Law Review90:1157–1202.
Peto, Richard and Julian Peto. 1972. ‘‘Asymptotically efficient rank invariant test procedures (with discussion).’’Journal of the Royal Statistical Society135(2):185–207.
Rubin, Donald B. 1974. ‘‘Estimating Causal Effects of Treatments in Randomized and Nonrandomized Studies.’’Journal of Educational Psychology66:688–701.
Schiraldi, Vincent, Jason Colburn, and Erick Lotke. 2004.Three-strikes and You’re Out: An Examination of the Impact of 3-Strike Laws, 10 Years After their Enactment.Justice Police Institute. http://nicic.org/Library/019985.
Shepherd, Joanna M. 2002. ‘‘Fear of the First Strike: The Full Deterrent Effect of California’s Two and Three-Strikes Legislation.’’Journal of Legal Studies31(1):159–201.
Stolzenberg, Lisa, and Stewart D’Alessio. 1997. ‘‘ÔThree-strikes and You’re OutÕ: The Impact of California’s New Mandatory Sentencing Law on Serious Crime Rates.’’Crime & Delinquency43(4):457–69.
Walsh, Jennifer E. 2004.Tough for Whom? How Prosecutors and Judges use their Discretion to Promote Justice under the Three-Strikes Law.Henry Salvatori Center Monograph. New Series, No. 4. http://salvatori.claremontmckenna.edu/publications/pdf/
Walshmonograph.pdf.