STATISTIK
Minyak dan Gas Bumi
STATISTICS
O i l a n d G a s
Ministry of Energy and Mineral Resources
Direktorat Jenderal Minyak dan Gas Bumi
Kementerian Energi dan Sumber Daya Mineral
Buku Statistik Minyak dan Gas Bumi Tahun 2015 merupakan salah satu instrumen penyampaian data dan informasi secara berkala mengenai perkembangan kegiatanpengusahaan minyak dan gas bumi di Indonesia. Publikasi ini memuat gambaran umum tentang kegiatan pengusahaan migas dari hulu, hilir, hingga penunjang.
Beberapa data juga ditampilkan dalam bentuk peta-peta untuk memperkaya visual dan pemahaman terhadap kegiatan pengusahaan migas. Seiring dengan meningkatnya kebutuhan konsumen data, buku statistik minyak dan gas bumi akan terus mengalami penyempurnaan baik struktur maupun muatannya.
Buku statistik minyak dan gas bumi ini diharapkan dapat memberikan manfaat bagi banyak pihak untuk berbagai keperluan. Publikasi ini dapat terwujud berkat kerja sama dan partisipasi dari berbagai pihak.
Dalam kesempatan ini, kami menyampaikan penghargaan dan terima kasih kepada semua pihak yang telah memberikan kontribusi secara nyata, serta memberikan masukan-masukanyang berarti sehingga buku ini dapat tersusun.
Buku ini dapat dilihat dalam website Direktorat Jenderal Minyak dan Gas Bumi melalui, http://www. migas.esdm.go.id/. Saran dan kritik membangun untuk penerbitan selanjutnya dapat disampaikan melalui e-mail: http://mail.migas.esdm.go.id.
Oil and Gas Statistics 2015 book serves as an instrument to convey data and information on a regular basis about yearly progress of oil and gas exploitation in Indonesia. This publication consists of general overview on oil and gas exploitation activities, from upstream, downstream, to supporting sector.
Some data are displayed in maps form to enrich visuals and understanding on oil and gas exploitation activities. Along with incremental needs of data users, this book of Oil & Gas Statistics will be continuously improved both in structure, content and also presentation.
Through this publication, we aim to provide benefits for various parties in broadest possible utilization. This publication can be realized thanks to cooperation and participation of various parties.
Hereby, we’d like to express our highest appreciation and gratitude to all parties who have contributed since the beginning of the project, as well as providing valuable inputs for composing this book.
This book is also available for download on website of General Directorate of Oil and Gas
http: //www.migas.esdm.go.id/.Suggestion and inputs for upcoming publication can be addressed to http: //mail.migas.esdm.go.id.
KATA PENGANTAR |
IntroductionPENGARAH | Supervisor Sekretaris Direktorat Jenderal
Minyak dan Gas Bumi Secretary of Directorate General of Oil and Gas
PENANGGUNG JAWAB Editor In Chief Kepala Bagian Rencana dan Laporan Head of Planning and Report Division
EDITOR | Editor Kepala Sub Bagian Evaluasi dan
Laporan Sub-Division Head of Evaluation and Report
TIM PENYUSUN | Writer r4JOUB"HVTUJOBr8VMBO4JUBSBINJ
PENTERJEMAH | Translator Sularsih
Jakarta, 2016 Direktur Jenderal Migas
IGN Wiratmaja
Direktorat Jenderal Minyak dan Gas Bumi
KATA PENGANTAR
|
INTRODUCTION
RINGKASAN DATA
|
DATA SUMMARY
IKHTISAR
|
OVERVIEW
HULU
|
UPSTREAM
PENANDATANGANAN WILAYAH KERJA KONVENSIONAL MIGAS 2011-2015
Signing of Oil and Gas Conventional Working Areas 2011-2015
PENANDATANGANAN WILAYAH KERJA NON KONVENSIONAL MIGAS 2011-2015
Signing of Oil and Gas Unconventional Working Area 2011-2015
INVESTASI HULU MIGAS 2011-2015
Oil and Gas Upstream Investment 2011-2015
CADANGAN MINYAK BUMI INDONESIA 2011-2015
Indonesian Crude Oil Reserve 2011-2015
CADANGAN GAS BUMI INDONESIA 2011-2015
ndonesian Gas Reserve 2011-2015
GRAFIK SURVEI SEISMIK 2D (km) 2011-2015
Chart of 2D (km) Seismic Survey 2011-2015
GRAFIK SURVEI SEISMIK 3D (km2) 2011-2015 Chart of 3D (km2) Seismic Survey 2011-2015
GRAFIK PEMBORAN SUMUR EKSPLORASI 2011-2015
Chart of Drilling of Exploratory Wells 2011-2015
PRODUKSI DAN PEMANFAATAN GAS BUMI 2015
Production and Utilization of Natural Gas 2015
GRAFIK PRODUKSI DAN PEMANFAATAN GAS BUMI 2011-2015
Chart of Production and Utilization of Natural Gas 2011-2015
3
PRODUKSI MINYAK MENTAH DAN KONDENSAT 2015
Production of Crude Oil and Condensate 2015
GRAFIK PRODUKSI MINYAK MENTAH DAN KONDENSAT 2011-2015
Chart of Production of Crude Oil and Condensate 2011-2015
HARGA MINYAK MENTAH INDONESIA 2015
Indonesian Crude Oil Price 2015
PERKEMBANGAN HARGA MINYAK INDONESIA & MINYAK UTAMA DUNIA (JANUARI 2015 – DESEMBER 2015/ HARIAN)
Price Developments of Indonesian Crude Oil & World Major Crude Oil (December 2015 - December 2015 / Daily)
HILIR
|
DOWNSTREAM
INVESTASI HILIR MIGAS 2011-2015
Oil and Gas Downstream Investment 2011-2015
GRAFIK INVESTASI HILIR MIGAS 2011-2015
Chart of Oil and Gas Downstream Investment 2011-2015
PENGOLAHAN MINYAK MENTAH INDONESIA 2011-2015
Indonesian Crude Oil Processing 2011-2015
GRAFIK PENGOLAHAN MINYAK MENTAH INDONESIA 2011-2015
Chart of Indonesian Crude Oil Processing 2011-2015
HASIL PENGOLAHAN MINYAK INDONESIA 2011-2015
Indonesian Refined Products 2011-2015
GRAFIK HASIL PENGOLAHAN MINYAK 2011-2015
Chart of Refined Products 2011-2015
PRODUKSI LPG TAHUN 2011-2015
Production of LPG 2011-2015
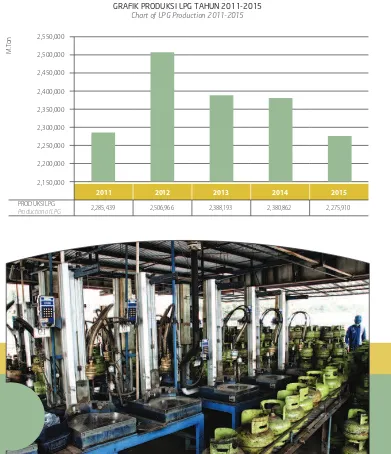
GRAFIK PRODUKSI LPG TAHUN 2011-2015
Chart of LPG Production 2011-2015
26
PRODUKSI LNG TAHUN 2011-2015
Production of LNG 2011-2015
GRAFIK PRODUKSI LNG TAHUN 2011-2015
Chart of LPG Production 2011-2015
EKSPOR MINYAK MENTAH DAN KONDENSAT INDONESIA 2011-2015
Indonesian Export of Crude Oil and Condensate 2011-2015
GRAFIK EKSPOR MINYAK MENTAH DAN KONDENSAT INDONESIA 2015
Chart of Indonesian Export of Crude Oil and Condensate 2015
IMPOR MINYAK MENTAH PER NEGARA ASAL 2011-2015
Crude Oil Imports by Country 2011-2015
EKSPOR BAHAN BAKAR MINYAK INDONESIA 2011-2015
Indonesian Export of Fuel 2011-2015
IMPOR BAHAN BAKAR MINYAK INDONESIA 2011-2015
Indonesian Import of Fuels 2011-2015
IMPOR LPG INDONESIA 2011-2015
Indonesian Import of LPG 2011-2015
EKSPOR LPG INDONESIA 2011-2015
Indonesian Export of LPG 2011-2015
EKSPOR PRODUK KILANG 2011-2015
Indonesian Exports of Refinery Products 2011-2015
EKSPOR LNG PER NEGARA TUJUAN 2011-2015
Export of LNG by Destination Country 2011-2015
REALISASI PENJUALAN BBM DI SELURUH INDONESIA 2011-2015
Indonesian Sales of Fuel Realization 2011-2015
PENJUALAN LPG INDONESIA 2011-2015
PENJUALAN LPG INDONESIA 2011-2015 Indonesian Sales of LPG 2011-2015
41
CAPAIAN TKDN PADA KEGIATAN USAHA HULU MIGAS 2010-2015
Chart of Local Content Usage in Upstream Oil and Gas Activities 2010-2015
DATA STATISTIK SURAT KETERANGAN TERDAFTAR 2011-2015
Statistic Of Registered Certificate 2011-2015
DATA TUMPAHAN MINYAK 2011-2015
Statistic of Oil Spill 2011-2015
DATA KECELAKAAN KERJA KEGIATAN HULU MIGAS 2011-2015
Statistic of Accident in Upstream Oil and Gas Activities 2011-2015
DATA KECELAKAAN KERJA KEGIATAN HILIR MIGAS 2011-2015
Statistic of Accident in Downstream Oil And Gas Activities 2011-2015
RANCANGAN STANDAR KOMPETENSI KERJA NASIONAL INDONESIA BIDANG MIGAS
TAHUN 2015
Draft of Indonesian National Work Competency Standard 2015
RANCANGAN STANDAR NASIONAL INDONESIA BIDANG MIGAS TAHUN 2015
Draft of Indonesian National Standard 2015
PETA TEMATIK
|
THEMATIC MAP
PETA CADANGAN MINYAK BUMI INDONESIA (STATUS 1 JANUARI 2015)
Map of Indonesia Crude Oil Reserve (Status in 1 Januari 2015)
PETA CADANGAN GAS BUMI INDONESIA (STATUS 1 JANUARI 2015)
Map of Indonesia Gas Reserves (Status in 1 Januari 2015)
PETA POTENSI GAS METHANA BATUBARA
CBM Resources & Shale Gas Potential
PETA CEKUNGAN HIDRO KARBON INDONESIA
Map of Hydrocarbons Basin Indonesia
PETA INFRASTRUKTUR GAS BUMI 2015-2030
Map of Gas Infrastructure 2015-2030
PETA KILANG MINYAK DI INDONESIA
Map of Oil Refinery in Indonesia
PETA KILANG LPG DAN LNG DI INDONESIA
Map of LPG and LNG Refinery in Indonesia
No. Kategori | Category Nilai | Amount Satuan | Unit 1 Investasi Hulu Migas | Upstream Oil and Gas Investments 15,312.68 Juta US$ 2 Cadangan Minyak Bumi | Crude Oil Reserve 7,305.02 MMSTB
3 Cadangan Gas Bumi | GasReserve 151.33 54$'
4 Survei Seismik 2D (km) | 2D Seismic Survey (km) 3,934.00 km
5 Survei Seismik 3D (km2) | 3D Seismic Survey (km2) 3,347.00 km2
6 Pemboran Sumur Eksplorasi | Drilling of Exploratory Wells 67 sumur
7 Produksi Gas Bumi | Natural Gas Production 8,077.71 ..4$'%
8 Pemanfaatan Gas Bumi | Utilization of Natural Gas 7,329.14 ..4$'% 9 Produksi Minyak dan Kondensat | Production of Crude Oil and
Condensate
785,792 BOPD
10 ICP Rata-rata (Januari '15 s/d Desember '15) |
Average of Indonesian Crude Oil Price (January 2015 until December 2015)
49.21 US$/Barel
11 *OWFTUBTJ)JMJS.JHBT]Oil and Gas Downstream Investment 2,617.77 Juta US$
12 )BTJM1FOHPMBIBO.JOZBL.FOUBI ##./PO##. Crude Oil Processing Results (fuel + Non-Fuel)
329,535.90 Ribu Barel
13 Produksi LPG | Production of LPG 2,275,910 M.Ton
14 1SPEVLTJ-/(]Production of LNG 19,071,196 M.Ton
15 Ekspor Minyak Mentah | Export of Crude Oil 115,017,446 Barel
16 Impor Minyak Mentah | Import of Crude Oil 136,665,881 Barel
17 Ekspor BBM | Export of Fuel 317,480 Kiloliter
18 Impor BBM | Import of Fuel 27,898,244 Kiloliter
19 Penjualan BBM | Sales of Fuel 67,509,826 Kiloliter
20 Ekspor LPG | Export of LPG 392 M.Ton
21 Impor LPG | Import of LPG 4,025,600 M.Ton
22 Penjualan LPG | Sales of LPG 6,376,990 M.Ton
23 Ekspor Produk Kilang | Exports of Refinery Products 3,459,642 Kiloliter
24 <QPS-/(]Export of LNG 811,043,009 MMBTU
25 Data Tumpahan Minyak | Statistic of Oil Spill 875 Barel 26 %BUB,FDFMBLBBO)VMV]Statistic of Accident in Upstream
Oil and Gas Activities
273 Kejadian
27 %BUB,FDFMBLBBO)JMJS]Statistic of Accident in Downstream Oil and Gas Activities
11 Kejadian
Tahun 2015 menjadi tahun kebimbangan bagi industri NJHBTOBTJPOBM)BSHBNJOZBLEVOJBTFCBHBJJTVVUBNB yang menunjukkan gejala penurunan di akhir tahun 2014, berdampak terhadap trend pergerakan harga minyak Indonesia pada kurun waktu Januari hingga Desember 2015, yang pada akhirnya berdampak pula terhadap hampir seluruh kegiatan pengusahaan minyak dan gas bumi di Indonesia.
Pergerakan ICP (Indonesia Crude Price) selama kurun waktu Januari-Desember 2015 menunjukkan luktuasi yang tidak terduga. ICP sempat menunjukkan trend positif pada kurun waktu Januari s.d. Mei hingga menyentuh angka rata-rata ICP US$ 61,86 per barel, namun pada akhirnya menurun secara perlahan dan terpuruk pada Desember 2015 dengan angka rata-rata ICP sebesar US$ 35,47 per barel.
The movement of ICP (Indonesia Crude Price) in January to December 2015 period showed unexpected fluctuations. ICP had shown a positive trend in from January to May period and reached of the average ICP figure of US$61.86 per barrel. However, at the end has been steadily declining and in December 2015 dropped at average ICP at US$35.47 per barrel.
The year 2015 was known as year full of uncertainties for national oil and gas industry. The downward trend of world oil prices in the end of 2014 became one of the main issues that had an impact on oil price movement in Indonesia between January to December 2015. At the end, the trend impacted almost all of oil and gas exploitation activities in Indonesia.
Direktorat Jenderal Minyak dan Gas Bumi
Trend penurunan harga tersebut antara lain disebabkan oleh hal-hal sebagai berikut:
1. Perlambatan pertumbuhan perekonomian global terutama Tiongkok yang merupakan negara konsumen minyak mentah utama.
2. Terus meningkatnya produksi minyak mentah "NFSJLB4FSJLBUEBOOFHBSBOFHBSBOPO01&$ 3. Kelebihan pasokan minyak mentah global, salah
satunya akibat peningkatan pasokan Iran sejak dicabutnya embargo terhadap Iran. 4. Masih rendahnya permintaan minyak mentah
EJLBXBTBO&SPQBEBO"TJBLIVTVTOZB*OEJBEBO Tiongkok.
Rendahnya nilai rata-rata ICP tentunya berdampak terhadap kegiatan pengusahaan minyak dan gas bumi terutama di sektor hulu. Beberapa Kontraktor Kontrak Kerja Sama (KKKS) bereaksi dengan merevisi rencana kerja (work plan & budget) yang berdampak terhadap menurunnya nilai investasi kegiatan hulu dan kegiatan eksplorasi.
Bila dibandingkan dengan tahun-tahun sebelumnya, nilai investasi tahun 2015 sebesar US$ 15.312,68 juta mengalami penurunan sebanyak 24,87% dibandingkan tahun 2014, terbesar selama kurun waktu lima tahun terakhir. Kegiatan eksplorasi tahun 2015 menunjukkan potret yang sama di mana kegiatan seismik 2D (km) menunjukkan penurunan sebanyak 33,02%, kegiatan seismik 3D (km2) menunjukkan penurunan sebanyak 60,81%, dan realisasi pemboran sumur eksporasi menunjukkan penurunan sebanyak 19,27% dibandingkan tahun 2014. Penurunan kegiatan eksplorasi tentunya berdampak kepada sulitnya penemuan cadangan baru. Tercatat pada tahun 2015 terjadi penurunan cadangan terbukti minyak bumi sebesar 21,97 MMSTB (-0,61%) dan penurunan cadangan terbukti gas bumi TFCFTBS54$'
Sementara itu, produksi migas pada dasarnya mendapatkan efek yang relatif kecil dikarenakan penurunan alami yang telah terjadi bertahun-tahun yang lalu, di samping upaya-upaya yang telah
The declining trend in prices partly due to the following matters:
1. Slowing global economic growth, especially China as the main consumer of crude oil.
2. Continued increase of crude oil production of United States and non-OPEC countries. 3. Excess global supply of crude oil, due to increasing
supply from Iran since the lifting of embargo against Iran.
4. Low crude oil demand in Europe and Asia, particularly from India and China.
The low value of the average ICP obviously had an impact on oil and gas exploitation activities, especially in the upstream sector. Some of the Contractors of Cooperation Contract (PSC) reacted by revising the work plan and budget. Such actions had affected on the declining value of investments in upstream sector especially exploration activities.
Compared to previous years, the value of investments in 2015 amounted to US$15,312.68 million decreased by 24.87% compared to 2014. It was the largest decrease in last five years period. Exploration activity in 2015 reflected the same picture. The activity of 2D seismic (km) decreased by 33.02%, while 3D seismic activities (km2) decrease by 60.81%. Realization of drilling exploration wells showed a decrease of 19.27% compared to 2014. The decline in exploration activities would make discovery of new reserves more difficult. Recorded in 2015, the decline in the proven reserves of oil amounted to 21.97 MMSTB (-0.61%) and a reduction in proven natural gas reserves of 2.31 TSCF (-2.30%).
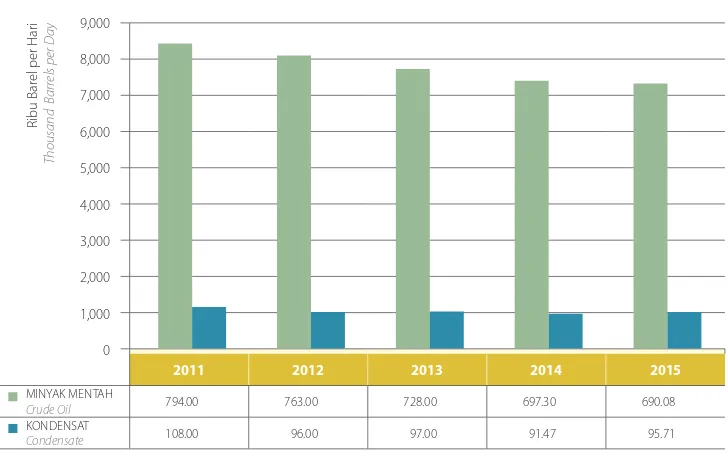
Meanwhile, oil and gas production basically get a relatively small effect due to the natural decline that has occurred many years ago, despite the efforts made by the government to pursue oil and gas
dilakukan oleh pemerintah untuk mengejar target produksi migas. Tercatat produksi minyak mentah dan kondensat tahun 2015 mengalami penurunan sebesar 2,98 ribu barel per hari (-0,38%) dibandingkan produksi tahun 2014. Sedangkan produksi gas bumi tahun 2015 mengalami penurunan sebesar 140,16 ..4$'% EJCBOEJOHLBOQSPEVLTJUBIVO
Sektor hilir migas memiliki pendekatan yang berbeda dengan sektor hulu, di mana pergerakan data biasanya dipengaruhi oleh tingkat konsumsi atau penjualan bahan bakar minyak (BBM) dan LPG. Secara agregat,
production target. Recorded production of crude oil and condensate in 2015 decreased by 2.98 thousand barrels per day (-0.38%) compared to production in 2014. Meanwhile, natural gas production in 2015 decreased by 140.16 MMSCFD (-1.71%) compared to production in 2014.
data penjualan BBM tahun 2015 sebesar 67.509.826 Kiloliter menurun 4,57% dari tahun sebelumnya yaitu sebesar 70.744.978 Kiloliter, hal ini dikarenakan perlambatan ekonomi yang terjadi pada tahun /BNVOEFNJLJBOTFJSJOHQFODBCVUBOTVCTJEJ #FOTJOKFOJT30/UFSKBEJQFOJOHLBUBOLPOTVNTJ #FOTJOKFOJT30/EBO30/TFDBSBTJHOJñLBO)BM tersebut berbanding lurus dengan trend angka yang EJUVOKVLLBOPMFI)BTJM1SPEVL,JMBOHEBOLFHJBUBO *NQPS##.QBEB#FOTJOKFOJT30/EBO30/ 1FOKVBMBO#FOTJOKFOJT30/QBEBUBIVO membukukan catatan kenaikan sebesar 1.699.035 Kiloliter atau 159,85% dari tahun sebelumnya. 4FEBOHLBOQFOKVBMBO#FOTJOKFOJT30/QBEBUBIVO 2015 membukukan catatan kenaikan sebesar 123.870 Kiloliter atau 79,97% dari tahun sebelumnya.
Sejak dilaksanakannya program konversi Minyak Tanah ke LPG yang dimulai pada tahun 2009, penjualan LPG nasional mengalami trend yang terus meningkat. Tercatat pada tahun 2015, penjualan LPG meningkat sebesar 4,66% dari 6.093.138 Mton di tahun 2014 menjadi 6.376.990 Mton di tahun 2015. Peningkatan tersebut disertai dengan peningkatan impor LPG pada tahun 2015 sebesar 11,69% dibandingkan tahun sebelumnya. Peningkatan persentase angka impor LPG lebih besar dari peningkatan angka persentase penjualan LPG dikarenakan produksi LPG tahun 2015 mengalami penurunan dibandingkan produksi LPG tahun 2014 sebesar 104.952 Mton.
Di sisi lain, perkembangan data ekspor minyak NFOUBIEBO-/(DFOEFSVOHTUBCJMEJLBSFOBLBO LFHJBUBOFLTQPSNJOZBLNFOUBIEBO-/(NFOHJLVUJ skema kontrak jangka panjang. Kendati harga ICP terpuruk sepanjang tahun 2015, ekspor minyak mentah tahun 2015 mengalami peningkatan yg DVLVQTJHOJñLBOZBJUVTFCBOZBLBUBVTFCFTBS 21,93 juta barel dibandingkan tahun sebelumnya. 4FNFOUBSBJUVFLTQPS-/(UBIVONFOVSVOUJQJT 2,78% dibandingkan tahun sebelumnya meskipun QSPEVLTJ-/(NFOHBMBNJLFOBJLBO)BMJOJEJTFCBCLBO oleh kebijakan pemerintah yang memprioritaskan QFOHHVOBBO-/(VOUVLEPNFTUJL
amounted to 67,509,826 kiloliters decreased 4.57% from the previous year which amounted to 70,744,978 kiloliters. This is due to the economic slowdown that occurred in 2015. However, as the removal of subsidies on gasoline type RON 88, the consumption of RON 92 and RON 95 gasoline types has significantly increased. It is directly proportional to the trend of Refinery Products as well as import activity for RON 92 and RON 95 fuel types. Sales number of gasoline types of RON 92 in 2015 recorded incremental of 1,699,035 kiloliters, or 159.85% from the previous year, while sales of RON 95 gasoline types in 2015 recorded incremental of 123 870 kiloliters, or 79.97% from the previous year.
Since the implementation Conversion Program of kerosene to LPG which has started in 2009, sales of LPG nationwide experience an increasing trend. Recorded in 2015, LPG sales increased by 4.66% from 6,093,138 metric ton in 2014 to 6.37699 million metric tons in 2015. The increase was concurrent with increase of LPG imports in 2015 amounted to 11.69% compared to the previous year. The percentage of increase in imported LPG was greater than the percentage of increase in LPG sales, because LPG production in 2015 decreased compared to the production of LPG in 2014 amounted to 104 952 metric ton.
On the other hand, crude oil and LNG export development tends to be stable due to the export scheme of long-term contracts for them. Although ICP dropped throughout 2015, crude oil exports in 2015 increased significantly by 23.56% or 21.93 million barrels compared to the previous year. Meanwhile LNG exports in 2015 slightly decreased 2.78% than the previous year despite the increase of LNG production. This is due to government policies that prioritize the use of LNG for domestic usage.
STATISTIK
Minyak dan Gas Bumi
STATISTICS
O i l a n d G a s2015
Direktorat Jenderal Minyak dan Gas Bumi
Kementerian Energi dan Sumber Daya Mineral
Directorate General of Oil And Gas
Ministry of Energy and Mineral Resources
HULU
UPSTREAM
PENANDATANGANAN WILAYAH KERJA KONVENSIONAL MIGAS 2011-2015
Signing of Oil and Gas Conventional Working Areas 2011-2015
2011 2012 2013 2014 2015
1&/"/%"5"/("/"/ ,0/53",#"36 New Contract Signed
27 13 13 7 8
#0/64]Sign Bonus 72,530,152 16,200,076 14,500,000 8,000,000 9,000,000 30
25
20
15
10
5
0
80,000,000
70,000,000
60,000,000
50,000,000
40,000,000
30,000,000
20,000,000
10,000,000
0
US$
Jumlah K
ontrak
Number of C
ontr
acts
PENANDATANGANAN WILAYAH KERJA NON KONVENSIONAL MIGAS 2011-2015
Signing of Oil and Gas Unconventional Working Area 2011-2015
2011 2012 2013 2014 2015
1&/"/%"5"/("/"/ ,0/53",#"36 New Contract Signed
19 12 1 0 4
#0/64]Sign Bonus 23,060,000 13,000,000 1,000,000 0 4,000,000 20
18
16
14
12
10
8
6
4
2
0
Jumlah K
ontrak
Number of C
ontr
acts
25,000,000
20,000,000
15,000,000
10,000,000
5,000,000
0
URAIAN | Description 2011 2012 2013 2014 2015
HULU I UPSTREAM 16,106.00 17,872.00 20,384.00 20,380.78 15,312.68
a. Eksplorasi I Exploration 2,570.00 2,758.00 3,049.00 2,618.91 951.83
b. Pengembangan I Development 3,140.00 3,297.00 4,122.00 4,087.43 3,055.42
c. Produksi I Production 9,194.00 10,639.00 11,859.00 12,256.63 10,113.63
E"ENJOJTUSBTJ*Administration 1,202.00 1,178.00 1,354.00 1,417.82 1,191.80 INVESTASI HULU MIGAS 2011-2015
Oil and Gas Upstream Investment 2011-2015
2011 2012 2013 2014 2015
25,000.00
20,000.00
15,000.00
10,000.00
5,000.00
0.00
Jumlah K
ontrak
Number of C
ontr
acts
"ENJOJTUSBTJ Administration
Pengembangan
Development
Produksi
Production
Eksplorasi
Exploration
URAIAN |Description 2011 2012 2013 2014 2015
Terbukti | Proven 4,039.60 3,741.30 3,692.50 3,624.50 3,602.53
Potensial | Potential 3,692.70 3,666.90 3,857.30 3,750.30 3,702.49
TOTAL 7,732.30 7,408.20 7,549.80 7,375.10 7,305.02
CADANGAN MINYAK BUMI INDONESIA 2011-2015
Indonesian Crude Oil Reserve 2011-2015
2011 2012 2013 2014 2015
4,100.00
4,000.00
3,900.00
3,800.00
3,700.00
3,600.00
3,500.00
3,400.00
3,300.00
MMSTB
Terbukti | Proven Potensial |Potential
Direktorat Jenderal Minyak dan Gas Bumi
URAIAN |Description 2011 2012 2013 2014 2015
Terbukti | Proven 104.70 103.30 101.50 100.30 97.99
Potensial | Potential 48.20 47.40 48.90 49.00 53.34
TOTAL 152.90 150.70 150.40 149.30 151.33
CADANGAN GAS BUMI INDONESIA 2011-2015
Indonesian Gas Reserve 2011-2015
2011 2012 2013 2014 2015
120.00
100.00
80.00
60.00
40.00
20.00
0.00
54$'
Terbukti | Proven Potensial |Potential
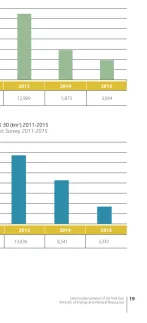
GRAFIK SURVEI SEISMIK 2D (km) 2011-2015
Chart of 2D (km) Seismic Survey 2011-2015
2011 2012 2013 2014 2015
SURVEI SEISMIK 2D
2D Seismic Survey 12,549 13,995 12,989 5,873 3,934
16,000
14,000
12,000
10,000
8,000
6,000
4,000
2,000
0
KM
GRAFIK SURVEI SEISMIK 3D (km2) 2011-2015
Chart of 3D (km2)Seismic Survey 2011-2015
2011 2012 2013 2014 2015
SURVEI SEISMIK 3D
3D Seismic Survey 8,147 6,165 13,436 8,541 3,347
16,000
14,000
12,000
10,000
8,000
6,000
4,000
2,000
0
KM
GRAFIK PEMBORAN SUMUR EKSPLORASI 2011-2015
Chart of Drilling of Exploratory Wells 2011-2015
2011 2012 2013 2014 2015
3&"-*4"4*
Realization 107 106 101 83 67
1&/&.6"/
Discovery 34 39 20 25 15
3"4*0,&46,4&4"/
Success Ratio (%) 32 37 20 30 29
120
100
80
60
40
20
0 Jumlah Sumur Number of w
ells
Direktorat Jenderal Minyak dan Gas Bumi
PRODUKSI DAN PEMANFAATAN GAS BUMI 2015
Production and Utilization of Natural Gas 2015PRODUKSI DAN PEMANFAATAN GAS BUMI 2015
Production and Utilization of Natural Gas 2015PERUSAHAAN
IV. Production Sharing Contracts
Onshore
Direktorat Jenderal Minyak dan Gas Bumi
PERUSAHAAN Company
JUMLAH PRODUKSI DALAM SETAHUN Total Production in a Year
PRODUKSI HARIAN RATA-RATA Average Daily Production
MINYAK Crude Oil
KONDENSAT
Condensate TOTAL
MINYAK
Crude Oil
KONDENSAT
Condensate TOTAL
I. PT. Pertamina EP & Mitra 36,679,476 0 36,679,476 100,492 0 100,492
II. JOB PSC "+PC14$ Onshore)
1 +0#1&35".*/"(0-%&/41*,& 186,838 0 186,838 512 0 512 2 +0#1&35".*/".&%$050.03*-5% 292,605 1,224,556 1,517,161 802 3,355 4,157 3 +0#1&35".*/"1&530$)*/"&"45+"7" 1,791,016 0 1,791,016 4,907 0 4,907 4 +0#1&35".*/"1&530$)*/"4"-"8"5* 647,093 0 647,093 1,773 0 1,773 5 +0#1&35".*/"5"-*4."/ +.-5% 0 1,612,104 1,612,104 0 4,417 4,417 6 +0#1&35".*/"5"-*4."/ 0,-5% 856,973 50,080 907,053 2,348 137 2,485
Sub Total JOB PSC Onshore 3,774,525 2,886,740 6,661,265 10,341 7,909 18,250
B. JOB PSC (Offshore)
1 JOB Pertamina - EMP Gebang 0 0 0 0 0 0
Sub Total JOB PSC Ofshore 0 0 0 0 0 0
Sub Total JOB PSC Onshore & Ofshore 3,774,525 2,886,740 6,661,265 10,341 7,909 18,250
III. KKKS / PSC A. KKKS / PSC(Onshore)
1 #0#1&35".*/"#6.*4*",164",0 4,782,156 0 4,782,156 13,102 0 13,102 2 $*5*$4&3".&/&3(:-.% 1,211,191 0 1,211,191 3,318 0 3,318 3 15$)&730/1"$*'*$*/%0/&4*" 99,889,838 2,180,011 102,069,849 273,671 5,973 279,643 4 15$)&730/1"$*'*$*/%0/&4*"$5 4*", 0 0 0 0 0 0 5 $0/0$01)*-*14 (3*44*,-5% 176,657 2,659,744 2,836,401 484 7,287 7,771
6 $0/0$01)*--*144065)+".#* 0 0 0 0 0 0
7 &990/.0#*-0*-*/%0/&4*"1)&/4#/40 0 561,170 561,170 0 1,537 1,537 8 ,"-3&;1&530-&6. 4&3".-5% 130,224 0 130,224 357 0 357 9 ,"/(&"/&/&3(:*/%0/&4*"-5% 0 28,849 28,849 0 79 79
10 -"1*/%0#3"/5"4*/$ 0 0 0 0 0 0
11 15.&%$0-&."5"/( 0 0 0 0 0 0
12 15.&%$0&1*/%0/&4*" 4,043,184 0 4,043,184 11,077 0 11,077 13 15.&%$0&1*/%0/&4*" 1,877,261 0 1,877,261 5,143 0 5,143
14 .&%$0,".1"3 503,658 0 503,658 1,380 0 1,380
15 15.&%$0&15"3","/ 666,260 0 666,260 1,825 0 1,825 16 &990/.0#*-$&16-5% 26,094,070 0 26,094,070 71,491 0 71,491 17 .0/5%h031&"3-0*- 56/(,"--5% 503,406 0 503,406 1,379 0 1,379
18 1&530$)*/"#"/(,0-5% 2,921 0 2,921 8 0 8
19 1&530$)*/"*/5&3/"5*0/"-#&3.6%"-5% 1,459,747 304,503 1,764,250 3,999 834 4,834 20 1&530$)*/"*/5&3/"5*0/"-+"#6/(-5% 1,918,638 3,275,382 5,194,020 5,257 8,974 14,230
21 1&5304&-"5 92,062 0 92,062 252 0 252
PRODUKSI MINYAK MENTAH DAN KONDENSAT 2015
Production of Crude Oil and Condensate 2015
GRAFIK PRODUKSI DAN PEMANFAATAN GAS BUMI 2011-2015
Chart of Production and Utilization of Natural Gas 2011-2015
2011 2012 2013 2014 2015
PRODUKSI
Production 8,415.00 8,149.00 8,130.00 8,217.87 8,077.71
1&."/'""5"/
Utilization 7,923.00 7,451.00 7,480.00 7,364.13 7,329.15
%*#","3
Losses 492.00 698.00 650.00 853.74 749.05
9,000
8,000
7,000
6,000
5,000
4,000
3,000
2,000
1,000
0
PERUSAHAAN Company
JUMLAH PRODUKSI DALAM SETAHUN Total Production in a Year
PRODUKSI HARIAN RATA-RATA Average Daily Production
MINYAK Crude Oil
KONDENSAT
Condensate TOTAL
MINYAK
Crude Oil
KONDENSAT
Condensate TOTAL 22 154"3"/"1&.#"/(6/"/3*"6 142,139 0 142,139 389 0 389 23 4&-&3":" 382,995 0 382,995 1,049 0 1,049
24 53*"/(-& 1"4& 0 0 0 0 0 0
25 157*$0*/%0/&4*" 3,948,606 1,736,738 5,685,344 10,818 4,758 15,576 26 1546."5&3"1&34"%"&/&3(* 118,189 0 118,189 324 0 324 27 &.150/(" &Y.04&4"1&530-&6. 3,733 0 3,733 10 0 10 28 &/&3(:&26*5:&1*$ 4&/(,"/(15:
LTD.
0 140 140 0 0 0
29 5"5&-:/7 341,277 0 341,277 935 0 935
30 1)&4*", 628,478 0 628,478 1,722 0 1,722
31 5*"3"#6.* 150,858 0 150,858 413 0 413
Sub Total KKKS / PSC (Onshore) 149,067,548 10,746,537 159,814,085 408,404 29,443 437,847
B. KKKS / PSC (Ofshore)
1. #15"/((6) 0 2,107,480 2,107,480 0 5,774 5,774
2. $/00$4&4-5% 12,078,879 0 12,078,879 33,093 0 33,093 3. $"."33&4063$&4$"/"%" 170,308 0 170,308 467 0 467 4. $)&730/*/%0/&4*"$0.1"/: 6,904,683 390,375 7,295,058 18,917 1,070 19,986 5. $)&730/.","44"3-5% 1,213,745 14,350 1,228,095 3,325 39 3,365 6. $0/0$01)*--*14*/%0/&4*"-5% 8,338,262 0 8,338,262 22,845 0 22,845 7. 4","*/%0/&4*"1"/(,")-5% 1,826,848 0 1,826,848 5,005 0 5,005 8. 1)&8.0,0%&$0&/&3(:$0-5% 4,907,188 3,082 4,910,270 13,444 8 13,453 9. &.1."-"$$"453"*54" &Y,0/%63 1,414,295 0 1,414,295 3,875 0 3,875 10. 1&35".*/")6-6&/&3(:8&45+"7"-5% 14,554,141 57,259 14,611,400 39,874 157 40,031 11. 13&.*&30*-/"56/"4&"#7 227,778 297,391 525,169 624 815 1,439 12. 4"/504 4".1"/(15:-5% 413,828 16,311 430,139 1,134 45 1,178 13. 45"3&/&3(: ,","1-5% 1,142,343 126,490 1,268,833 3,130 347 3,476 14. 505"-&1*/%0/&4*& 7,300,833 18,256,254 25,557,087 20,002 50,017 70,019 15. 1&"3-0*- 4,6-UE 0 32,242 32,242 0 88 88 16. ."/)"55"/,"-*."/5"/*/7&45.&/5 0 1,014 1,014 0 3 3 17. 1&530/"4$"3*("-*,&5"1"/(** 1,864,015 0 1,864,015 5,107 0 5,107
Sub Total KKKS / PSC(Ofshore) 62,357,146 21,302,248 83,659,394 170,841 58,362 229,204
Sub Total KKKS / PSC (Onshore + Ofshore) 211,424,694 32,048,785 243,473,479 579,246 87,805 667,051
Total Indonesia 251,878,695 34,935,525 286,814,220 690,079 95,714 785,792
PRODUKSI MINYAK MENTAH DAN KONDENSAT 2015
Production of Crude Oil and Condensate 2015
Lanjutan I Continued
Barrels
GRAFIK PRODUKSI MINYAK MENTAH DAN KONDENSAT 2011-2015
Chart of Production of Crude Oil and Condensate 2011-2015
2011 2012 2013 2014 2015
.*/:",.&/5")
Crude Oil 794.00 763.00 728.00 697.30 690.08
,0/%&/4"5
Condensate 108.00 96.00 97.00 91.47 95.71
9,000
8,000
7,000
6,000
5,000
4,000
3,000
2,000
1,000
0
3JCV#BS
FMQFS)BS
J
Thousand Barr
els per D
ay
Direktorat Jenderal Minyak dan Gas Bumi
HARGA MINYAK MENTAH INDONESIA 2015
Indonesian Crude Oil Price 2015
PERKEMBANGAN HARGA MINYAK MENTAH INDONESIA (ICP) (US$/BBL) Crude Oil Price Development in Indonesia (ICP) (US$/BBL)
MINYAK MENTAH
1 S L C 45.56 54.11 54.19 59.92 62.70 59.54 51.91 43.21 42.96 42.92 41.03 34.61 49.39
2 "SKVOB 44.79 53.69 52.63 55.86 60.93 58.67 50.86 41.84 42.76 43.72 41.33 35.45 48.54
3 "UUBLB 47.38 56.36 55.21 58.47 63.66 61.55 53.98 44.75 45.54 46.49 43.72 37.27 51.20
4 Cinta 45.82 53.69 52.41 55.49 61.02 58.60 51.20 41.78 42.46 42.77 39.87 33.50 48.22
5 D u r i 44.75 55.10 52.53 54.64 60.75 58.49 51.47 42.11 41.04 40.55 37.42 32.34 47.60
6 8JEVSJ 45.37 53.91 53.56 55.99 61.15 58.76 51.37 41.97 42.61 42.92 40.02 33.63 48.44
7 Belida 48.85 57.57 56.49 59.74 65.35 63.09 55.38 46.04 46.84 47.83 45.43 38.81 52.62
8 Senipah Condensate 48.09 57.33 57.41 60.17 64.86 63.23 56.00 46.06 46.75 48.08 45.94 41.09 52.92
9 "OPB 47.78 56.76 55.61 58.87 64.06 61.95 54.38 45.15 45.94 46.89 44.12 37.67 51.60
10 "SVO$POEFOTBUF 48.09 57.33 57.41 60.17 64.86 63.23 56.00 46.06 46.75 48.08 45.94 41.09 52.92
11 Badak 47.38 56.36 55.21 58.47 63.66 61.55 53.98 44.75 45.54 46.49 43.72 37.27 51.20
12 Bekapai 47.38 56.36 55.21 58.47 63.66 61.55 53.98 44.75 45.54 46.49 43.72 37.27 51.20
13 Belanak 39.83 48.73 47.67 50.90 55.97 53.71 45.90 36.88 37.80 38.76 36.37 30.49 43.58
14 Bentayan 43.60 52.15 52.23 57.96 60.74 57.58 49.95 41.25 41.00 40.96 39.07 32.65 47.43
15 Bontang Return
Condensate (BRC) 43.23 55.39 55.38 57.56 60.04 58.89 51.15 43.76 44.81 46.92 46.95 43.68 50.65
16 B u l a 44.25 54.60 52.03 54.14 60.25 57.99 50.97 41.61 40.54 40.05 36.92 31.84 47.10
17 Bunyu 45.56 54.11 54.19 59.92 62.70 59.54 51.91 43.21 42.96 42.92 41.03 34.61 49.39
18 Camar 45.17 54.07 53.01 56.24 61.31 59.05 51.24 42.22 43.14 44.10 41.71 35.83 48.92
19 Cepu 40.15 49.05 47.99 51.22 56.29 54.03 46.22 37.20 38.12 39.08 36.69 30.81 43.90
20 Geragai/Makmur 45.75 54.30 54.38 60.11 62.89 59.73 52.10 43.40 43.15 43.11 41.22 34.80 49.58
21 Geragai Condensate/ Makmur Condensate
42.97 55.13 55.12 57.30 59.78 58.63 50.89 43.50 44.55 46.66 46.69 43.42 50.39
22 )BOEJM.JY 44.94 53.84 52.78 56.01 61.08 58.82 51.01 41.99 42.91 43.87 41.48 35.60 48.69
23 Jambi 45.75 54.30 54.38 60.11 62.89 59.73 52.10 43.40 43.15 43.11 41.22 34.80 49.58
24 Jatibarang 45.56 54.11 54.19 59.92 62.70 59.54 51.91 43.21 42.96 42.92 41.03 34.61 49.39
25 Jene/Pendopo 45.56 54.11 54.19 59.92 62.70 59.54 51.91 43.21 42.96 42.92 41.03 34.61 49.39
26 Kaji/Matra 45.96 54.51 54.59 60.32 63.10 59.94 52.31 43.61 43.36 43.32 41.43 35.01 49.79
27 Kerapu 48.51 57.23 56.15 59.40 65.01 62.75 55.04 45.70 46.50 47.49 45.09 38.47 52.28
28 Klamono 44.25 54.60 52.03 54.14 60.25 57.99 50.97 41.61 40.54 40.05 36.92 31.84 47.10 (ICP) (US$/Bbl)
PERKEMBANGAN HARGA MINYAK MENTAH INDONESIA (ICP) (US$/BBL) Crude Oil Price Development in Indonesia (ICP) (US$/BBL)
MINYAK MENTAH
29 Komplek Palembang 4FMBUBO ,14"JS Serdang/Guruh
43.05 51.95 50.89 54.12 59.19 56.93 49.12 40.10 41.02 41.98 39.59 33.71 46.80
30 Lalang 45.61 54.16 54.24 59.97 62.75 59.59 51.96 43.26 43.01 42.97 41.08 34.66 49.44
31 Langsa 46.98 55.96 54.81 58.07 63.26 61.15 53.58 44.35 45.14 46.09 43.32 36.87 50.80
32 Lirik 45.45 54.00 54.08 59.81 62.59 59.43 51.80 43.10 42.85 42.81 40.92 34.50 49.28
33 Madura/Poleng 44.92 53.82 52.76 55.99 61.06 58.80 50.99 41.97 42.89 43.85 41.46 35.58 48.67
34 Mengoepeh 45.75 54.30 54.38 60.11 62.89 59.73 52.10 43.40 43.15 43.11 41.22 34.80 49.58
35 Meslu 44.21 53.19 52.04 55.30 60.49 58.38 50.81 41.58 42.37 43.32 40.55 34.10 48.03
36 Mudi Mix 44.49 53.39 52.33 55.56 60.63 58.37 50.56 41.54 42.46 43.42 41.03 35.15 48.24
37 /4$,BUBQB"SCFJ 47.27 56.25 55.10 58.36 63.55 61.44 53.87 44.64 45.43 46.38 43.61 37.16 51.09
38 Pagerungan Condensate
47.34 56.58 56.66 59.42 64.11 62.48 55.25 45.31 46.00 47.33 45.19 40.34 52.17
39 Pam. Juata/Sanga2
Mix/Mamburungan 45.66 54.21 54.29 60.02 62.80 59.64 52.01 43.31 43.06 43.02 41.13 34.71 49.49
40 Pangkah 43.49 52.39 51.33 54.56 59.63 57.37 49.56 40.54 41.46 42.42 40.03 34.15 47.24
41 Ramba/Tempino 45.75 54.30 54.38 60.11 62.89 59.73 52.10 43.40 43.15 43.11 41.22 34.80 49.58
42 Rimau/Tabuhan 45.46 54.01 54.09 59.82 62.60 59.44 51.81 43.11 42.86 42.82 40.93 34.51 49.29
43 Sangatta 45.56 54.11 54.19 59.92 62.70 59.54 51.91 43.21 42.96 42.92 41.03 34.61 49.39
44 Selat Panjang 45.56 54.11 54.19 59.92 62.70 59.54 51.91 43.21 42.96 42.92 41.03 34.61 49.39
45 4FQJOHHBO:BLJO.JY 44.79 53.69 52.63 55.86 60.93 58.67 50.86 41.84 42.76 43.72 41.33 35.45 48.54
46 South Jambi
Condensate 46.15 55.39 55.47 58.23 62.92 61.29 54.06 44.12 44.81 46.14 44.00 39.15 50.98
47 Tanjung 45.75 54.30 54.38 60.11 62.89 59.73 52.10 43.40 43.15 43.11 41.22 34.80 49.58
48 5BMBOH"LBS1FOEPQP
5"1"JS)JUBN 43.26 52.16 51.10 54.33 59.40 57.14 49.33 40.31 41.23 42.19 39.80 33.92 47.01 49 Tiaka 41.75 52.10 49.53 51.64 57.75 55.49 48.47 39.11 38.04 37.55 34.42 29.34 44.60
50 Udang 45.64 54.19 54.27 60.00 62.78 59.62 51.99 43.29 43.04 43.00 41.11 34.69 49.47
51 8BMJP.JY 42.74 51.64 50.58 53.81 58.88 56.62 48.81 39.79 40.71 41.67 39.28 33.40 46.49
52 8FTU4FOP 46.73 55.71 54.56 57.82 63.01 60.90 53.33 44.10 44.89 45.84 43.07 36.62 50.55
Rata - Rata Terhitung 45.30 54.32 53.66 57.58 61.86 59.40 51.81 42.81 43.13 43.68 41.44 35.47 49.21
POLA PERGERAKAN HARGA MINYAK MENTAH TAHUN 2015
PERKEMBANGAN HARGA MINYAK INDONESIA & MINYAK UTAMA DUNIA (JANUARI 2015 – DESEMBER 2015/ HARIAN)
Price Developments of Indonesian Crude Oil & World Major Crude Oil
(January 2015 - December 2015 / Daily)
Direktorat Jenderal Minyak dan Gas Bumi
STATISTIK
Minyak dan Gas Bumi
STATISTICS
O i l a n d G a s2015
Direktorat Jenderal Minyak dan Gas Bumi
Kementerian Energi dan Sumber Daya Mineral
Directorate General of Oil And Gas
Ministry of Energy and Mineral Resources
HILIR
DOWNSTREAM
Juta US$ | Million US $
URAIAN |Description 2011 2012 2013 2014 2015
HILIR I Downstrean 2,382.05 1,608.36 1,994.73 2,613.84 2,617.77
B1&/(0-")"/*Processing 598.88 296.13 363.84 0.00 615.15
C1&/("/(,65"/*Transportation 545.90 195.58 203.62 328.30 1,751.89
D1&/:*.1"/"/*Storage 394.30 297.11 403.14 830.29 238.99
E/*"("*Commercial 11.41 167.61 24.13 187.92 11.74
F1&35".*/" )*-*3I Pertamina (Downstrean) 831.56 651.93 1,000.00 1,267.33 0.00 INVESTASI HILIR MIGAS 2011-2015
Oil and Gas Downstream Investment 2011-2015
GRAFIK INVESTASI HILIR MIGAS 2011-2015
Chart of Oil and Gas Downstream Investment 2011-2015
2011 2012 2013 2014 2015
3,000.00
2,500.00
2,000.00
1,500.00
1,000.00
500.00
0.00
Juta US$ |
M
illion U
S $
1&35".*/" )*-*3 Pertamina (Downstrean) /*"("
Commercial 1&/:*.1"/"/
Storage 1&/("/(,65"/
Transportation 1&/(0-")"/
dalam Ribu Barel | in Thousand Barrels
PRODUK |Products 2011 2012 2013 2014 2015
.*/:",.&/5")]Crude Oil 218,626.03 275,050.52 208,074.71 192,156.74 231,192.72 ,0/%&/4"5]Condensate 24,099.02 2,489.83 3,067.31 6,531.21 - *.103.*/:",.&/5")
Imported Crude Oil
78,276.47 21,718.73 88,993.66 110,757.37 136,598.86
/0/.*/:",.&/5") Non-Crude
44,810.24 48,596.32 52,304.80 60,346.89 47,018.80
Total 365,811.75 347,855.41 352,440.48 369,792.21 414,810.38
Data Unaudited
PENGOLAHAN MINYAK MENTAH INDONESIA 2011-2015
Indonesian Crude Oil Processing 2011-2015
GRAFIK PENGOLAHAN MINYAK MENTAH INDONESIA 2011-2015
Chart of Indonesian Crude Oil Processing 2011-2015
2011 2012 2013 2014 2015
450,000,000
400,000,000
350,000,000
300,000,000
250,000,000
200,000,000
150,000,000
100,000,000
50,000,000
0
dalam R
ibu Bar
el |
in T
housand Barr
els
.*/:",.&/5") Crude Oil
,0/%&/4"5 Condensate
*.103.*/:",.&/5") Imported Crude Oil
/0/.*/:",.&/5") Non-Crude
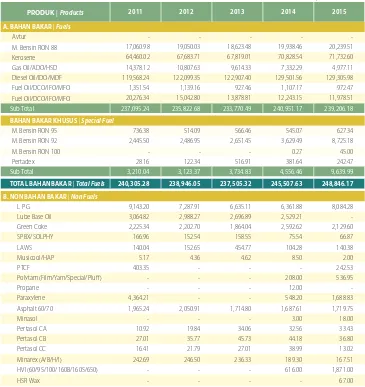
dalam Ribu Barel | in Thousand Barrels
PRODUK | Products 2011 2012 2013 2014 2015
A. BAHAN BAKAR | Fuels
"WUVS - - - - -
.#FOTJO30/ 17,060.98 19,050.03 18,623.48 19,938.46 20,239.51
Kerosene 64,460.02 67,683.71 67,819.01 70,828.54 71,732.60
(BT0JM"%0)4% 14,378.12 10,807.63 9,614.33 7,332.29 4,977.11
%JFTFM0JM*%0.%' 119,568.24 122,099.35 122,907.40 129,501.56 129,305.98
'VFM0JM%$0*'0.'0 1,351.54 1,139.16 927.46 1,107.17 972.47
'VFM0JM%$0*'0.'0 20,276.34 15,042.80 13,878.81 12,243.15 11,978.51
Sub Total 237,095.24 235,822.68 233,770.49 240,951.17 239,206.18
BAHAN BAKAR KHUSUS | Special Fuel
.#FOTJO30/ 736.38 514.09 566.46 545.07 627.34
.#FOTJO30/ 2,445.50 2,486.95 2,651.45 3,629.49 8,725.18
.#FOTJO30/ - - - 0.27 45.00
Pertadex 28.16 122.34 516.91 381.64 242.47
Sub Total 3,210.04 3,123.37 3,734.83 4,556.46 9,639.99
TOTAL BAHAN BAKAR | Total Fuels 240,305.28 238,946.05 237,505.32 245,507.63 248,846.17
B. NON BAHAN BAKAR | Non Fuels
L P G 9,143.20 7,287.91 6,635.11 6,361.88 8,084.28
Lube Base Oil 3,064.82 2,988.27 2,696.89 2,529.21 -
Green Coke 2,225.34 2,202.70 1,864.04 2,592.62 2,129.60
41#940-1): 166.96 152.54 158.55 75.54 66.87
-"84 140.04 152.65 454.77 104.28 140.38
.VTJDPPM)"1 5.17 4.36 4.62 8.50 2.00
15$' 403.35 - - - 242.53
1PMZUBN 'JMN:BSO4QFDJBM1MVí - - - 208.00 536.95
Propane - - - 12.00 -
Paraxylene 4,364.21 - - 548.20 1,688.83
"TQIBMU 1,965.24 2,050.91 1,714.80 1,687.61 1,719.75
Minasol - - - 3.00 18.00
1FSUBTPM$" 10.92 19.84 34.06 32.56 33.43
Pertasol CB 27.01 35.77 45.73 44.18 36.80
Pertasol CC 16.41 21.79 27.01 38.99 13.02
.JOBSFY "#)* 242.69 246.50 236.33 189.30 167.51
)7* #4 - - - 616.00 1,871.00
)438BY - - - - 67.00
HASIL PENGOLAHAN MINYAK INDONESIA 2011-2015 Indonesian Refined Products 2011-2015
Direktorat Jenderal Minyak dan Gas Bumi
dalam Ribu Barel | in Thousand Barrel
PRODUK | Products 2011 2012 2013 2014 2015
0#.4NPPUI'MVJE 18.06 25.90 18.39 51.98 28.00
Parainic (95/60/650) 188.57 197.43 128.35 175.94 144.00
#FO[FOF 2,192.17 - - 256.81 546.92
Orthoxylene 10.82 - - 23.29 0.61
4MBDL8BY 155.67 98.99 101.95 152.32 92.00
Sulphur 37.38 50.91 35.16 21.30 22.00
)4'0 - - - 3,009.64 1,448.00
Propylene 1,855.49 1,555.19 1,688.73 2,924.79 2,133.00
3FGPSNBUF)FBWZ3FGPSNBUF - - - 261.79 1,019.36
-1-"5)1-"5 - - - 24.00 13.00
-JHIU/BQIUB - - - 630.56 312.73
43/BQIUB - - - - 56.00
4XFFU/BQIUB - - - - 42.15
Bitument Paint - 0.22 0.85 0.13 -
Long Residue - - - 430.00 5,683.00
Short Residue - - - 76.00
)7(0-0.$10%)4%$ - 170.57 - 825.12 3,131.09
-483 .JY77 24,020.88 26,308.07 23,742.95 26,946.33 9,572.00
43-483-4833FTJEVF-4'0
RU III/VTB 4,621.45 5,541.87 9,346.67 7,330.82 5,437.77
'MVTIJOH0JM - - - 8.00 131.00
'MVY - - - 69.00 124.00
Long Residue RU VII - - - 313.00 423.00
$POEFOTBUF3'( - - 11.69 8.00 6.00
3'0LF-#0 - - - - 36.00
Intermedia - - - 106.00 747.00
Slops 0.23 - - 218.00 174.00
6$0/#' - - - - 1,995.00
"%0'FFE - - - 155.00 1.00
Clay Treater Charge - - - - 0.47
)FBWZ"SPNBUF 234.84 - - 14.74 43.00
"UN3FTJEVF - - - 43.69 109.68
Treated Gasoil - - - 90.66 123.00
/BQIUB<QPS - - - - 2,065.00
-483 43.JY - - - - 9,703.00
dalam Ribu Barel | in Thousand Barrel
PRODUK | Products 2011 2012 2013 2014 2015
Decant Oil 4,055.14 3,461.17 3,154.63 3,536.66 2,631.00
)0.$ 11,908.33 10,405.28 6,563.74 8,544.23 4,498.00
/BQIUBLF,-## 28,612.86 23,180.12 23,793.38 21,354.35 11,024.00
)4%$FY36*7 - - 318.00 1,122.74 -
Lain-lain Intermedia - - - - 280.00
)483 - - - 1.00 -
Special Boiling Point - - - 20.75 -
LOMC - - - 243.00 -
Unconverted Oil 2,389.57 2,528.41 2,286.59 2,462.30 -
SRG - - - 98.66 -
Marine Gas Oil 69.43 61.26 82.44 106.78 -
Toluene - - - 9.28 -
Solvent Solphy II 0.20 - 0.26 0.10 -
/FU#PUUPN'SBDUJPOBUPS 359.66 414.41 6.08 412.30 -
Exdo-4 - - - 11.56 -
:FMMPX#BUJL8BY 3.40 5.30 6.49 3.54 -
)4FNJ3FñOFE #4 8.20 0.36 0.16 - -
Light Cycle Oil - 0.20 - - -
Sub Total 102,517.72 89,168.89 85,158.42 97,070.03 80,689.73
C. TOTAL PRODUK | Total Products 342,823.00 328,114.94 322,663.74 342,577.66 329,535.90
D. BALANCE 22,988.74 19,740.46 29,776.75 27,214.55 85,274.48
Chart of Reined Products 2011-2015
2011 2012 2013 2014 2015
#")"/#","3
Fuels 240,305.28 238,946.05 237,505.32 245,507.63 248,846.17
#6,"/#")"/
#","3Non-Fuels 102,517.72 89,168.89 85,158.42 97,070.03 80,689.73
TOTAL 342,823.00 328,114.94 322,663.74 342,577.66 329,535.90
400,000,000
350,000,000
300,000,000
250,000,000
200,000,000
150,000,000
100,000,000
50,000,000
0
dalam R
ibu Bar
el
in Thousa
nd Ba
rrels
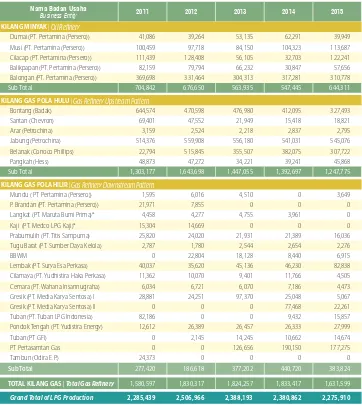
Production of LPG 2011-2015
Nama Badan Usaha
Business Entity 2011 2012 2013 2014 2015
KILANG MINYAK | Oil Reinery
Dumai (PT. Pertamina (Persero)) 41,086 39,264 53,135 62,291 39,949
Musi (PT. Pertamina (Persero)) 100,459 97,718 84,150 104,323 113,687
Cilacap (PT. Pertamina (Persero)) 111,439 128,408 56,105 32,703 122,241 Balikpapan (PT. Pertamina (Persero)) 82,159 79,794 66,232 30,847 57,656 Balongan (PT. Pertamina (Persero)) 369,698 331,464 304,313 317,281 310,778
Sub Total 704,842 676,650 563,935 547,445 644,311
KILANG GAS POLA HULU | Gas Reinery Upstream Pattern
Bontang (Badak) 644,574 470,598 476,980 412,095 327,493
Santan (Chevron) 69,401 47,552 21,949 15,418 18,821
"SBS 1FUSPDIJOB 3,159 2,524 2,218 2,837 2,795
Jabung (Petrochina) 514,376 559,908 556,180 541,031 545,076
Belanak (Conoco Phillips) 22,794 515,845 355,507 382,075 307,722
1BOHLBI )FTT 48,873 47,272 34,221 39,241 45,868
Sub Total 1,303,177 1,643,698 1,447,055 1,392,697 1,247,775
KILANG GAS POLA HILIR | Gas Reinery Downstream Pattern
Mundu ( PT Pertamina (Persero)) 1,595 6,016 4,510 0 3,649
P. Brandan (PT. Pertamina (Persero)) 21,971 7,855 0 0 0
-BOHLBU 15.BSVUB#VNJ1SJNB 4,458 4,277 4,755 3,961 0
,BKJ 15.FEDP-1(,BKJ 15,304 14,669 0 0 0
Prabumulih (PT. Titis Sampurna) 25,820 24,020 21,931 21,389 16,036
Tugu Barat (PT. Sumber Daya Kelola) 2,787 1,780 2,544 2,654 2,276
##8. 0 22,804 18,128 8,440 6,915
Lembak (PT. Surya Esa Perkasa) 40,037 35,620 45,136 46,230 82,838
$JMBNBZB 15:VEIJTUJSB)BLB1FSLBTB 11,362 10,070 9,401 11,766 4,505
$FNBSB 158BIBOB*OTBOOVHSBIB 6,034 6,721 6,070 7,186 4,473
Gresik (PT. Media Karya Sentosa) I 28,881 24,251 97,370 25,048 5,067
Gresik (PT. Media Karya Sentosa) II 0 0 0 77,468 22,261
Tuban (PT. Tuban LPG Indonesia) 82,186 0 0 9,432 15,857
1POEPL5FOHBI 15:VEJTUJSB&OFSHZ 12,612 26,389 26,457 26,333 27,999
5VCBO 15('* 0 2,145 14,245 10,662 14,674
PT Pertasamtan Gas 0 0 126,656 190,150 177,275
Tambun (Odira E.P.) 24,373 0 0 0 0
Sub Total 277,420 186,618 377,202 440,720 383,824
TOTAL KILANG GAS | Total Gas Reinery 1,580,597 1,830,317 1,824,257 1,833,417 1,631,599
Grand Total of LPG Production 2,285,439 2,506,966 2,388,193 2,380,862 2,275,910
* In 2015, gas production was stopped because there was no gas supply
(M. Ton)
Direktorat Jenderal Minyak dan Gas Bumi
Chart of LPG Production 2011-2015
2011 2012 2013 2014 2015
PRODUKSI LPG
Production of LPG 2,285,439 2,506,966 2,388,193 2,380,862 2,275,910
2,550,000
2,500,000
2,450,000
2,400,000
2,350,000
2,300,000
2,250,000
2,200,000
2,150,000
M.T
on
Production of LNG 2011-2015
Nama Badan Usaha
Business Entity 2011 2012 2013 2014 2015
"SVO 15"SVO 1,172,435 886,074 696,213 - -
Bontang (PT. Badak) 14,404,840 11,654,760 10,982,274 10,603,161 10,603,161
Tangguh (BP) 6,394,272 6,917,147 7,571,517 7,770,170 7,770,170
%POHHJ4FOPSP 15%4-/( - - - - 697,864
TOTAL PRODUKSI LNG
Total of LNG Production 21,971,547 19,457,982 19,250,004 18,373,332 19,071,196
4FKBLUBIVO"SVOTVEBIUJEBLCFSPQFSBTJMBHJ
* Since 2014, Arun no longer in operation
(M. Ton)
GRAFIK PRODUKSI LNG TAHUN 2011-2015 Chart of LPG Production 2011-2015
2011 2012 2013 2014 2015
1SPEVLTJ-/(
Production of LNG 21,971,547 19,457,982 19,250,004 18,373,332 19,071,196
23,000,000
22,000,000
21,000,000
20,000,000
19,000,000
18,000,000
17,000,000
16,000,000
M.T
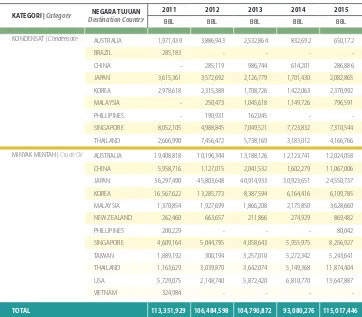
KATEGORI | Category Destination CountryNEGARA TUJUAN 2011 2012 2013 2014 2015
BBL BBL BBL BBL BBL
,0/%&/4"5]Condensate "6453"-*" 1,971,439 3,886,943 2,532,864 832,692 650,172
#3";*- 285,183 - - - -
$)*/" - 285,119 986,744 614,201 286,886
+"1"/ 3,615,361 3,572,692 2,126,779 1,701,430 2,082,865 ,03&" 2,978,618 2,315,388 1,708,726 1,422,063 2,370,992
."-":4*" - 250,473 1,045,618 1,149,726 796,591
1)*--*1*/&4 - 190,931 162,045 - -
4*/("103& 8,052,105 4,988,845 7,049,521 7,723,832 7,310,544
5)"*-"/% 2,666,990 7,456,472 5,738,169 3,183,012 4,166,766
.*/:",.&/5")]Crude Oil "6453"-*" 19,408,818 10,196,344 13,188,126 12,123,741 12,024,058
$)*/" 5,958,716 1,127,015 2,041,532 1,602,279 11,067,006
+"1"/ 36,297,490 45,803,648 40,914,933 30,923,651 24,550,737 ,03&" 16,567,622 13,285,773 8,387,594 6,164,416 6,109,785
."-":4*" 1,370,854 1,927,699 1,866,208 2,175,850 3,628,660
/&8;&"-"/% 262,460 663,657 211,866 274,929 869,482
1)*--*1*/&4 200,229 - - - 80,042
4*/("103& 4,609,164 5,044,795 4,058,643 5,955,975 8,256,927
5"*8"/ 1,889,192 300,194 3,257,010 5,272,342 5,243,641 5)"*-"/% 1,163,629 3,039,870 3,642,074 5,149,368 11,874,404
64" 5,729,075 2,148,740 5,872,420 6,810,770 13,647,887
7*&5/". 324,984 - - - -
TOTAL 113,351,929 106,484,598 104,790,872 93,080,276 115,017,446
Barrels Indonesian Export of Crude Oil and Condensate 2011-2015
AUSTRALIA CHINA JAPAN KOREA MALAYSIA NEW ZEALAND PHILLIPINES SINGAPORE TAIWAN THAILAND USA
30,000,000
25,000,000
20,000,000
15,000,000
10,000,000
5,000,000
0
.*/:",.&/5")]Crude Oil ,0/%&/4"5 | Condensate
Bar
rels
Chart of Indonesian Export of Crude Oil and Condensate 2015
Direktorat Jenderal Minyak dan Gas Bumi
NEGARA ASAL |Country 2011 2012 2013 2014 2015
4"6%*"3"#*" 35,601,875 29,932,304 39,404,159 39,606,732 36,000,000
5)"*-"/% - - - - -
."-":4*" 20,534,588 - - 2,377,356 8,700,000
7*&5/". 485,782 - - 609,279 -
"6453"-*" - 1,936,977 1,300,561 - 2,150,000
#36/&*%"3644"-". 8,925,211 2,373,653 5,758,350 5,147,937 1,800,000 /*(&3*" 24,004,354 26,104,721 27,701,386 34,946,503 39,800,000
$)*/" - - - - -
-*#:" - 6,063,710 3,321,988 - -
"-(&3*" - 1,391,013 3,597,883 3,566,686 3,965,881
,";",45"/ - - 625,295 - -
6"& - - 261,029 - -
"/(0-" - 950,595 1,898,604 1,854,728 11,050,000
46%"/ - - - - -
*3", - - 1,976,291 - -
364*" 1,813,992 2,972,810 1,883,580 1,224,743 1,800,000
,03&" 5,496,623 6,086,690 1,251,722 - -
2"5"3 - 615,648 - - -
#0/(" - 952,061 - - -
563,&: - 16,588,054 29,353,326 603,440 -
";&3#"*+"/ - - - 32,056,040 22,050,000
$0/(0 - - - - 6,000,000
(6*/&" - - - - 1,200,000
MESIR - - - - 2,150,000
TOTAL PER TAHUN | Total Per Year 96,862,425 95,968,236 118,334,174 121,993,445 136,665,881
5VSLFZIBOZBQFMBCVIBONVBU]* Turkey as loading port only Data Unaudited
Barrels Crude Oil Imports by Country 2011-2015
2011 2012 2013 2014 2015
505"-1&35")6/
Total per Year 96,862,425 95,968,236 118,334,174 121,993,445 136,665,881
160,000,000
140,000,000
120,000,000
100,000,000
80,000,000
60,000,000
40,000,000
20,000,000
0
Bar
rels
Kiloliter I Kilolitre
JENIS | Type 2011 2012 2013 2014 2015
#&/4*/*Gasoline 88 12,653 10,909 - - -
.*/:",5"/")*Kerosene 429,219 268,488 259,460 63,718 93,702
.*/:",40-"3*Higher Speed Diesel 17,975 14,668 - 23,510 -
"7563*Aviation Turbin Fuel 1,015 2,115 218 2,049 2,455
.*/:",#","3*Fuel Oil - - 686,795 511,211 218,983
#&/4*/*Gasoline 92 840 9,570 2,125 25,279 2,340
TOTAL 461,702 305,750 948,598 625,766 317,480
Indonesian Export of Fuel 2011-2015
Kiloliter I Kilolitre
JENIS |Type 2011 2012 2013 2014 2015
"7563*Aviation Turbin Fuel 815,556 707,610 947,757 981,406 1,201,960
"7("4*Aviation Gasoline 2,458 2,246 - 288
#&/4*/*Gasoline 88 15,247,687 17,621,338 18,340,068 18,829,092 16,273,913
#&/4*/*Gasoline 92 318,942 212,530 268,143 619,083 1,780,814
#&/4*/*Gasoline 95 36,496 36,209 59,933 64,302 171,173
)0.$*High Octane MogasComponent 157,492 524,894 1,014,695 1,092,609 997,531 .*/:",40-"3]Higher Speed Diesel 13,572,550 12,455,009 11,946,708 11,474,700 7,318,129 .*/:",#","3]Fuel Oil 998,032 419,569 106,749 173,663 148,041
.*/:",%*&4&-]Diesel Fuel - - 6,344 6,703 6,394
TOTAL 31,146,754 31,979,617 32,692,643 33,241,558 27,898,244
*) Unaudited
Indonesian Import of LPG 2011-2015
M. Ton
JENIS | Type 2011 2012 2013 2014 2015
LPG 2,124,292 2,573,670 3,299,808 3,604,009 4,025,600
Data Unaudited
1SPHSBNLPOWFSTJ.JUBOLF-1(EJNVMBJUBIVO
* The conversion program from kerosene to LPG, began in 2009
EKSPOR LPG INDONESIA 2011-2015 Indonesian Export of LPG 2011-2015
M. Ton
JENIS | Type 2011 2012 2013 2014 2015
LPG 76,566 205 286 483 392
Data Unaudited
EKSPOR PRODUK KILANG 2011-2015 Indonesian Exports of Refinery Products 2011-2015
Kiloliter I Kilolitre
JENIS |Type 2011 2012 2013 2014 2015
-483 2,251,620 2,472,409 1,976,343 2,329,005 1,700,199
7BDVVN3FTJEVF -4'0 721,516 874,150 604,151 926,097 810,244
Decant Oil 567,641 488,928 550,748 453,665 543,677
Propylene - 48,549 - -
Base Oil - 42,207 - -
Green Coke - 185,861 - -
/BQIUIB 209,305 - 173,630 848,858 405,522
1FSUBNJOB%FY "-'0 - - - - -
4MBDL8BY - - - - -
Gasoil - - - - -
)FBWZ"SPNBUJD - - - 2,608 -
TOTAL 3,750,082 4,112,102 3,304,872 4,560,233 3,459,642
*) Data Unaudited
MMBTU
NEGARA TUJUAN
Destination Country 2011 2012 2013 2014 2015
+&1"/( 485,631,803 313,783,267 339,166,264 294,527,328 318,365,589 ,03&" 399,431,137 404,461,161 298,070,416 268,354,006 184,016,673 5"*8"/ 98,443,500 95,283,030 98,472,860 114,780,967 115,078,500
$)*/" 116,913,870 120,356,150 136,816,400 136,634,970 156,839,230
64" 12,263,021 15,557,837 15,877,802 12,558,937 9,361,253
5)"*-"/% 3,314,780 - - -
-4*/("103& - - - 3,619,110 6,600,000
."-":4*" - - - 3,767,608
-*/%*" - - - - 10,530,290
,68"*5 - - - - 3,330,030
&(:15 - - - - 3,683,840
6&" - - - - 3,237,604
TOTAL 1,115,998,111 949,441,445 888,403,742 834,242,926 811,043,009
Export of LNG by Destination Country 2011-2015
2011 2012 2013 2014 2015
1,200,000,000
1,000,000,000
800,000,000
600,000,000
400,000,000
200,000,000
0
MMB
TU
+&1"/( ,03&" 5"*8"/ $)*/" 64" 5)"*-"/% 4*/("103& ."-":4*" */%*" ,68"*5 &(:15 6&"
Direktorat Jenderal Minyak dan Gas Bumi
Indonesian Sales of Fuel Realization 2011-2015
Kiloliter I Kilolitre
JENIS | Type 2011 2012 2013 2014 2015
#&/4*/*Gasoline 88 25,836,804 28,459,985 29,501,773 29,707,002 28,107,022
#&/4*/*Gasoline 90 - - - - 379,959
#&/4*/*Gasoline 92 750,852 666,461 850,408 1,062,920 2,761,956
#&/4*/*Gasoline 95 168,950 149,424 158,714 154,888 278,758
.*/:",5"/")]Kerosene 1,984,939 1,382,469 1,260,490 971,434 769,233 .*/:",40-"3]Higher Speed Diesel 33,624,959 34,209,757 34,047,721 32,673,230 29,172,694 .*/:",%*&4&-]Diesel Fuel 133,589 91,600 79,137 60,870 53,069 .*/:",#","3]Fuel Oil 3,904,580 3,428,875 1,973,903 1,884,040 1,647,441
"7("4]Aviation Gasoline 2,214 2,606 2,868 1,499 3,070
"7563]Aviation Turbin Fuel 3,267,453 3,898,832 4,159,010 4,229,094 4,336,624
TOTAL 69,674,338 72,290,008 72,034,024 70,744,978 67,509,826
STATISTIK
Minyak dan Gas Bumi
STATISTICS
O i l a n d G a s2015
Direktorat Jenderal Minyak dan Gas Bumi
Kementerian Energi dan Sumber Daya Mineral
Directorate General of Oil And Gas
Ministry of Energy and Mineral Resources
PENUNJANG
Supporting
PENJUALAN LPG INDONESIA 2011-2015 Indonesian Sales of LPG 2011-2015
M. Ton
URAIAN |Description 2011 2012 2013 2014 2015
URAIAN | Description 2011 2012 2013 2014 2015
/PO,POTUSVLTJ]Non-Construction 890 1,048 1,533 1,655 1,620
Kontruksi | Construction 439 396 412 460 239
Industri Penunjang | Industry Support 63 65 121 109 99
Total 1,392 1,509 2,066 2,224 1,958
Statistic Of Registered Certificate 2011-2015
2011 2012 2013 2014 2015
1,800
1,600
1,400
1,200
1,000
800
600
400
200
0
Jumlah P
erusahaan I
C
ompany number
/PO,POTUSVLTJ]Non-Construction Kontruksi |Construction Industri Penunjang | Industry Support Chart of Local Content Usage in Upstream Oil and Gas Activities 2010-2015
2010 2011 2012 2013 2014 2015
1&/(&-6"3"/
Expenditure 13,515.00 16,106.00 17,872.00 20,384.00 20,380.79 15,312.68
/*-"*1&.#&-*"/ #"3"/(%"/+"4" Puchasing number of goods and services
10,787.00 11,815.00 16,613.00 13,920.00 17,355.00 7,092.00
5,%/]% Local
Content 63 61 60 57 54 65
25,000.00
20,000.00
15,000.00
10,000.00
5,000.00
0.00
70%
60%
50%
40%
30%
20%
10%
0%
Juta US$ I
M
illion U
S$
Persentase I
Per
centage
Direktorat Jenderal Minyak dan Gas Bumi
URAIAN | Description 2011 2012 2013 2014 2015
)VMV]Upstream 181.80 197.60 2,071.37 46.70 91.38
)JMJS]Downstream 0.00 0.16 0.00 0.00 784.00
Total (Barrels) 181.80 197.76 2,071.37 46.70 875.38
Statistic of Oil Spill 2011-2015
2011 2012 2013 2014 2015
2,500.00
2,000.00
1,500.00
1,000.00
500.00
0.00
Bar
rels
2011 2012 2013 2014 2015
250
200
150
100
50
0
Jumlah K
ejadian
Number of A
ccident
Ringan | Minor Sedang | Medium Berat |Severe 'BUBM
Statistic of Accident in Upstream Oil and Gas Activities 2011-2015
2011 2012 2013 2014 2015
Ringan | Minor 119 80 147 131 206
Sedang | Medium 19 6 29 49 55
Berat | Severe 19 5 3 16 10
'BUBM 11 8 4 6 2
2011 2012 2013 2014 2015
Statistic of Accident in Downstream Oil And Gas Activities 2011-2015
2011 2012 2013 2014 2015
Ringan | Minor 3 16 12 5 3
Sedang | Medium 4 5 0 2 8
Berat | Severe 2 3 0 1 0
'BUBM 5 7 2 2 0
Total 14 31 14 10 11
Draft of Indonesian National Work Competency Standard 2015
No Golongan Pokok Kep.
Menakertrans
Tahun Area pekerjaan/Kompetensi Keterangan
1 +BTBBSTJUFLUVSEBOUFLOJLTJQJM"OBMJTJT dan Uji teknis
Architectural and civil engineering services; Analysis and Technical inspection
/PNPS5BIVO 2015
No. 52 year 2015
2015 Inspeksi Kelistrikan Inspektur Kelistrikan
Architectural and civil engineering services; Analysis and Technical inspection
/PNPS5BIVO 2015
No. 89 year 2015
2015 Inspeksi Platform Inspektur Platform
Architectural and civil engineering services; Analysis and Technical inspection
/PNPS Tahun 2015
No. 126 year 2015
2015 *OTQFLTJ$BTJOH5VCJOHEBO"DDFTTPSJFT *OTQFLUVS$BTJOH5VCJOHEBO"DDFTPSJT
Inspection of Casing, Tubing and Accessories
Inspector of Casing, Tubing, and Accessories
4 Pertambangan Minyak Bumi dan Gas alam dan panas bumi
Oil and natural gas mining and geothermal
/PNPS Tahun 2015
No. 129 year 2015
2015 Bidang Produksi Subbidang Operasi Produksi
Production
Sub-Sector of Production Operations
Kaji Ulang
Review
5 Pertambangan Minyak Bumi dan Gas alam dan panas bumi
Oil and natural gas mining and geothermal
/PNPS Tahun 2015
No. 133 year 2015
2015 Bidang pengeboran Darat
Onshore drilling
Kaji Ulang
Review
6 Pertambangan Minyak Bumi dan Gas alam dan panas bumi
Oil and natural gas mining and geothermal
/PNPS
Tahun 2015 2015 Bidang Produksi Subbidang Operasi Perawatan Sumur
Production, Sub-Sector operation of well maintenance
Kaji Ulang
Review
7 Pertambangan Minyak Bumi dan Gas alam dan panas bumi
Oil and natural gas mining and geothermal
/PNPS Tahun 2015
No. 135 year 2015
2015 #JEBOH0QFSBTJ1FTBXBU"OHLBU "OHLVUEBO*LBU#FCBO
Lifting Machine, Transportation and heavy equipment binding
Kaji Ulang
Review
8 Pertambangan Minyak Bumi dan Gas alam dan panas bumi
Oil and natural gas mining and geothermal
/PNPS Tahun 2015
No. 267 year 2015
2015 Bidang Keselamatan dan Kesehatan Kerja Industri Migas
Health and Safety in Oil and Gas Industry
Kaji Ulang
Review
9 "OBMJTJTEBO6KJ5FLOJT
Analysis and Technical inspection
/PNPS Tahun 2015
No. 192 year 2015
2015 Bidang Inspektur Rotating Equipment
Rotating Equipment Inspector
10 Jasa Pertambangan
Mining services
/PNPS Tahun 2015
No. 162 year 2015
2015 Bidang Slickline
No. 193 year 2015
2015 #JEBOH8JSFMJOF-PHHJOH
No. 266 year 2015
2015 #JEBOH1JQF'JUUFS
Pipe Fitter
13 Jasa arsitektur dan teknik sipil; analisis dan uji teknis
Architectural and civil engineering services; Analysis and Technical inspection
/PNPS Tahun 2015
No. 268 year 2015
2015 &OKJOFS*OTUSVNFO4JTUFN"MBU6LVS (Measurement System)
Measurement System Engineer
Direktorat Jenderal Minyak dan Gas Bumi