Managed care and technology adoption in health
care: evidence from magnetic resonance imaging
Laurence C. Baker
∗Department of Health Research and Policy, Stanford University and NBER, HRP Redwood Building Room 253, Stanford, CA 94305-5405, USA
Received 1 February 2000; received in revised form 1 December 2000; accepted 4 January 2001
Abstract
This paper empirically examines the relationship between HMO market share and the diffusion of magnetic resonance imaging (MRI) equipment. Across markets, increases in HMO market share are associated with slower diffusion of MRI into hospitals between 1983 and 1993, and with substantially lower overall MRI availability in the mid- and later 1990s. High managed care areas also had markedly lower rates of MRI procedure use. These results suggest that technology adoption in health care can respond to changes in financial and other incentives associated with managed care, which may have implications for health care costs and patient welfare. © 2001 Elsevier Science B.V. All rights reserved.
JEL classification:I1
Keywords:Managed care; Health maintenance organizations; Technology diffusion; MRI
1. Introduction
Among the many questions raised by growth in managed care is the impact it will have on the development, adoption, and use of new medical technologies. The US health care system has been characterized for many decades by rapid technological progress, fueled in part by a reimbursement system that generously payed for the development and use of new advanced therapies (Weisbrod, 1991). Now, some fear that growth in managed care is eroding the pillars that supported this system. Managed care has reduced physician and hospital reimbursement in many parts of the US and moved to limit use of expensive tests and procedures by enrollees, often focusing most intently on spending for new high cost technologies at the most advanced institutions. These kinds of changes could reduce the
∗Tel.:+1-650-723-4098; fax:+1-650-723-3786.
E-mail address:[email protected] (L.C. Baker).
profitability of new innovations, and slow adoption and reduce the overall availability of technologies. This, in turn, could have ripple effects throughout the process of technology development if researchers and developers perceive changes in the markets for new products and scale back their efforts or alter their research and development strategies.
Changes in the availability of new technologies and the rate of technological change could have important implications for the health care system. It is widely believed that the majority of health care cost growth over the past 50 years is due to technological change (Newhouse, 1992; Fuchs, 1996). Rapid technological change also appears to have significantly improved the capacity of medicine to treat disease and thereby substantially improved the well-being of patients (e.g. Cutler et al., 1998). Understanding the impact of managed care on technology change is thus important for assessing its impact on spending and patient welfare, as well as for evaluating and optimally designing policies that would influence the future development of managed care.
This paper investigates the relationship between managed care activity and the adoption of magnetic resonance imaging (MRI) equipment, a good example of a technology that could have been influenced by managed care. MRI is a diagnostic tool for producing high resolution images of body tissues, most frequently the brain and spinal cord. The first prototype MRI machines for human imaging were installed in the United States in 1980 and MRI entered general clinical use in 1982 (Baltaxe and Geokas, 1983; Hillman and Schwartz, 1985). It diffused during the 1980s and 1990s, the period in which managed care came to play a significant role in the US health care system.
MRI has attracted attention, from managed care plans among others, partly because of its high cost. Hospitals or other health care providers that wish to offer MRI typically purchase and install an MRI scanner.1 The machines themselves are costly, typically running more than US$ 1.5 million for a new imager, and there are often substantial facility modifications that must be made to provide coolant for the magnets and shield surrounding equipment from powerful magnetic fields (Bell, 1996; Steinberg and Evens, 1988). The operating costs of MRI can also be significant. Personnel and maintenance costs can easily amount to US$ 200 000 per year for most facilities, and the cost of supplies were estimated to be more than US$ 100 per scan in 1995 (Bell, 1996). Patient charges associated with MRI procedures vary widely depending on things like the complexity of the images required and physician charges for interpretation, but it is not difficult to run up total charges of more than US$ 1000 for many MRI procedures.
MRI can improve the speed and accuracy with which many diagnoses can be made. For some conditions and patients, though, MRI scans can be viewed as helpful but not neces-sary. It is sometimes possible to substitute other less expensive procedures like computed tomography (CT) or ultrasound for MRI with arguably limited effects on the quality of the diagnosis. Virtually, all insurers cover medically indicated MRI procedures, but health
plans concerned about costs have been particularly vigilant about the use of MRI in cases where its benefits are not immediately clear or where other procedures could be substituted. Section 2 briefly reviews mechanisms by which managed care could have influenced adoption of MRI. I then turn to the empirical work. Using data on hospital adoption of MRI and data on the overall availability of MRI, I examine MRI diffusion and availability in markets with varying levels of HMO market share. I conclude that managed care was associated with slower diffusion of MRI, particularly in hospitals. With expenditures for the purchase of MRI equipment typically running in the millions of dollars, reductions in adoption should have produced substantial savings. But, achieving these savings may also have entailed reductions in the use of services that benefit patients, which would leave questions about the net welfare effects open. After studying the effects of managed care on adoption patterns, I briefly examine the relationship between HMO market share and the number of MRI procedures performed. The results suggest that increases in HMO market share are strongly associated with declines in the utilization of MRI procedures.
The general patterns and determinants of technology adoption in health care, including
the case of MRI, have been widely studied.2 The overall impacts of managed care on
spending and premiums have also been previously examined.3 However, there is relatively
little work that examines the effects of managed care on technology adoption and use in detail. Cutler and Sheiner (1998) investigated the relationship between state-level HMO market share and the availability of a range of services in hospitals, finding evidence that managed care slowed the diffusion of technologies that were diffusing recently. Baker and Brown (1999) report that managed care reduced the number of mammography providers, but increased the volume of procedures performed at the remaining sites. Baker and Phibbs (2000) report that high HMO market share was associated with slower adoption of neonatal intensive care units between 1980 and 1996. The literature is not unanimous, however, Baker and Spetz (1999) report that managed care activity was not associated with changes in an index of hospital technologies, suggesting that managed care may not slow overall adoption, and Hill and Wolfe (1997) reported mixed effects of managed care on diffusion of a range of technologies in Wisconsin during and after rapid growth in managed care activity.4
2. Managed care activity and technology adoption
“Managed care”, for purposes of discussion here, describes a collection of activities health plans can undertake that are designed to reduce the high levels of utilization and
2For general studies of health care technology diffusion see, e.g. Anderson and Steinberg (1984), Baker (1979), Banta (1980), Cutler and McClellan (1996), Fendrick et al. (1994), Globerman (1982), Lee and Waldman (1985), Romeo et al. (1984), Salkever and Bice (1976), and Russell (1977). For studies specific to MRI, see Hillman and Schwartz (1985, 1986), Teplensky (1993, 1994), Teplensky et al. (1995), and Vogt (1997).
3See, e.g. Baker (1997, 1999), Baker and Corts (1996), Chernew (1995), Clement et al. (1992), Feldman et al. (1986), Feldman et al. (1993), Frank and Welch (1985), Goldberg and Greenberg (1979), McLaughlin (1987, 1988), Noether (1988), Robinson (1991, 1996), Welch (1994), and Wickizer and Feldstein (1995).
spending that accompanied unfettered fee-for-service medicine, and improve the efficiency of health care delivery. These activities can include a range of things like the use of financial incentives to influence utilization patterns, direct oversight of utilization decisions, selective contracting with preferred physicians and hospitals, and restrictions on patient choices of providers through the use of closed panels and gatekeepers.
Growth in the number and size of health plans using strategies like these could influence technology adoption in several ways. Most straightforwardly, managed care could make it less profitable for hospitals, physician groups, or other providers to adopt new technologies like MRI. Many managed care plans have reduced the amounts that they are willing to pay providers, particularly for expensive services like MRI (Bell, 1996). Patients in managed care plans are also less frequently referred for expensive tests and procedures (Miller and Luft, 1997). Beyond just enrollees in managed care plans, evidence also suggests that even fee-for-service patients treated in areas with high levels of managed care activity receive less intensive treatments (e.g. Baker, 1999). Reductions in profitability would tend to slow adoption — virtually all models of technology adoption, including studies of health tech-nologies, suggest that profitability is a key determinant of adoption patterns (e.g. Mansfield, 1968; Reinganum, 1989).
The view that growth in managed care will slow the adoption of new technologies like MRI by reducing profitability is commonly encountered. But, it is not clear that managed care need necessarily slow adoption. If excess profits were earned by providers in the absence of managed care, growth in managed care that reduced but did not eliminate excess profits need not change provider behavior. In addition, MRI, like most new technologies, is a substitute for some services and a complement for others, and a full assessment of the profitability of adoption would incorporate effects on the complete range of services offered by providers. Having an MRI may, for example, facilitate more profitable orthopedic surgeries. Similarly, if managed care plans that selectively contract choose providers to include in their network based on the availability of services as well as costs, there may be an incentive to adopt new technologies that are unprofitable in and of themselves in order to help win contracts that bring in additional patients to other services.
rises. In formal modeling, the direction of strategic effects would depend on the assumptions about the preferences of managed care organizations and the expectations of hospitals about the returns to various adoption scenarios, but is increasingly clear that they could play an important role in adoption processes.
While appeals are frequently made to profitability arguments suggesting that managed care should slow the adoption of MRI and other similar technologies, this effect could be mitigated, or even reversed, by other forces. This possibility leaves the direction of the expected net impact of managed care on the timing and extent of MRI adoption ambiguous and open for empirical analysis.
3. Empirical approach and data
I study the impact of managed care on MRI by comparing MRI diffusion and availability in markets with varying levels of managed care activity. I define markets as health care service areas (HCSAs). HCSAs are groups of counties constructed to approximate markets for health care services based on Medicare patient flow data (Makuc et al., 1991). There are 802 HCSAs covering the entire continental United States.
I use data on MRI diffusion and availability from three complementary sources. I begin by using AHA survey data on hospital adoption of MRI from 1983 to 1993 to estimate adoption hazard models. These models permit analysis of adoption behavior by a well defined set of potential adopters (hospitals) over 11 years that encompass much of the diffusion period for MRI. They do not capture MRI outside of hospitals, but results below suggest that the primary impact of managed care was on MRI adoption by hospitals, which is captured.
After 1993, the AHA changed the format of its survey questions about MRI, so more recent AHA data cannot be used in the adoption hazard models. The more recent surveys do provide some less-detailed information about MRI availability, though, so I use them to estimate models of the number of hospitals per person that offer MRI services as a function of managed care activity in different areas. These provide a more recent general measure of the impact of managed care on hospital MRI availability.
The AHA surveys do not provide information about non-hospital MRI, nor do they report the actual number of machines in operation or procedure volume. To obtain this information, I use data from two “censuses” of MRI sites, done in 1993 and 1995, that report the number of machines operating in and outside of hospitals as well as procedure volume by area. These data provide the most detailed information and the best opportunity for examining overall MRI availability and use, albeit only for these 2 years. I use these data to estimate models of the number of machines per person and procedure use per person in different areas.
the overall availability of MRI. From a policy perspective, information about the effect of managed care on the overall availability of MRI equipment per person is valuable since this provides direct information about the effects of managed care on costs and care for the population as mediated through the availability of MRI equipment. On the other hand, models of the overall availability of MRI are less clear about the mechanisms by which managed care influences availability since the number of machines reflects the number of candidate adopters, the probability of adoption by candidate adopters, and the number of machines operated by those that adopt, all of which could be influenced by managed care.
3.1. AHA surveys
Every year, the AHA surveys all of the hospitals operating in the United States. They began asking about the presence of MRI in 1983, immediately following its introduction into clinical use. From 1983 to 1993, the surveys obtained specific information about the presence of MRI equipment in the hospital (see Appendix A for details). To facilitate a hazard-model analysis of adoption over 1983–1993, I constructed a dataset of non-federal general medical and surgical hospitals and children’s hospitals in the continental United States that were observed in 1983. Hospitals in rural areas may behave quite differently than hospitals in other areas, so I excluded hospitals in HCSAs with populations under 25 000. This left a sample of 5344 hospitals in 707 HCSAs. I followed each hospital as far as possible by linking subsequent AHA surveys, and identified hospitals that had adopted MRI (i.e. acquired MRI equipment) and the year of adoption based on answers to the survey questions each year. Appendix A describes the identification of adoption dates from the AHA survey data in detail. Hospitals that could not be followed all the way to adoption or to 1993, including hospitals involved in mergers or acquisitions, were treated as censored.
Beginning in 1994, the format of the questions changed substantially. Hospitals were asked more generally about the availability of MRI services in a variety of settings, and the data do not clearly indicate whether or not the hospital had actually acquired an MRI machine. One of the questions used during this time period asked was whether MRI was “owned or provided by the hospital or a subsidiary”. Hospitals answering this question in the affirmative need not have adopted MRI in the sense of making a decision to acquire an MRI machine of their own, and they could have provided MRI through a contract with a mobile service that operates MRI imagers on vehicles that move from place to place, but patterns of response to this question by area probably do provide a reasonable approximation of overall hospital MRI availability. I counted the number of non-federal short-term general or children’s hospitals in each HCSA in each year that reported owning or providing MRI themselves or through a subsidiary, and I analyze this data for the 707 HCSAs with populations over 25 000.
3.2. MRI census data
about a range of items including affiliation (e.g. hospital or non-hospital), number of MRI machines, and procedure volume in the preceding year. Appendix A describes the sampling and survey in more detail. I used this data to compute the number of sites, the number of magnets, and the number of procedures in 707 HCSAs with population over 25 000 in the continental United States.
3.3. HMO market share data
I measure the level of managed care activity in each HCSA using data on HMO market share, defined as the percent of the population enrolled in HMOs. Although there are many forms of managed care plans that could conceivably exert influence on technology diffusion processes, good geographically detailed data is only available for HMO market share for the time period under study here. Since HMOs were by far the most prevalent form of managed care during much of the time that MRI was diffusing, HMO activity probably provides a good proxy for the general level of managed care activity at this time. Even in more recent years, the presence of HMOs is likely to be a good proxy for the overall presence of strong managed care organizations since HMOs tend to use more stringent utilization management than other types of health plans, and have been more aggressive in reducing payments to providers.
At any given time, decisions about MRI adoption should be a function of the current level of HMO market share and expectations about future levels of HMO market share. Cumulatively, MRI adoption patterns and ultimate MRI availability levels should, therefore, be functions of actual HMO market share observed, and expectations about future levels of HMO market share held, at all of the points over the course of the diffusion of MRI. No measures of the expectations of physicians and hospital managers are available. Data on HMO market shares by HCSA are available for the early-1990s, and I classify areas based on the average market share over the years 1990–1993. I expect this to be a reasonable proxy for actual and expected HMO market shares during the diffusion of MRI for two reasons. First, areas that had high HMO market shares in the early-1990s also tended to have high market shares in earlier years. For example, using data on metropolitan statistical areas, the correlation between 1990 and 1993 average market share and 1990 market share is 0.98. The correlation between 1990 and 1993 average and 1983 market share is 0.66. Second, areas that had high HMO market shares in the early-1990s also tended to have high growth rates in HMO market shares since 1983 when MRI began diffusing. For example, the MSA-level correlation between the 1990 and 1993 average and the market share change between 1983 and 1993 was 0.82. If physicians and hospital managers were able to forecast HMO growth in their areas with some degree of accuracy, those in areas with high 1990–1993 average market share would also have had higher expected future market share levels during the time period when MRI was diffusing.
is described in more detail in Appendix A. The nation-wide mean of the 1990–1993 average market share is 16%. Across HCSAs, average 1990–1993 market shares range from 0 to 50%.
4. Overall MRI diffusion and availability
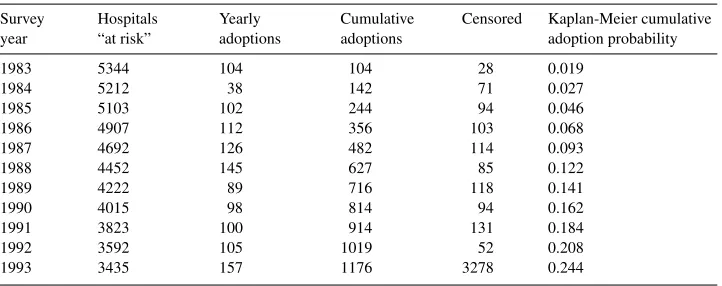
Table 1 summarizes adoption of MRI by hospitals in the 1983–1993 AHA survey sample. Over this time period, 1176 hospitals adopted MRI. Kaplan-Meier estimates of the cumu-lative adoption probability rise from 0 to nearly 25% by 1993. A total of 90 of the original 5344 hospitals are censored before 1993, when all remaining hospitals are censored. The majority of these are censored because they close or merge during the time period, and the large number of hospitals in this category is consistent with overall trends in the hospital industry.
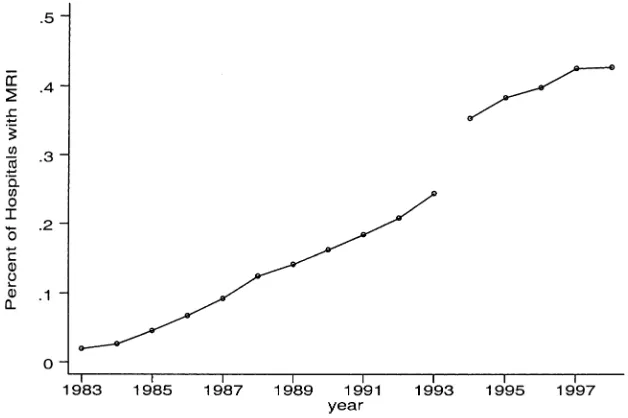
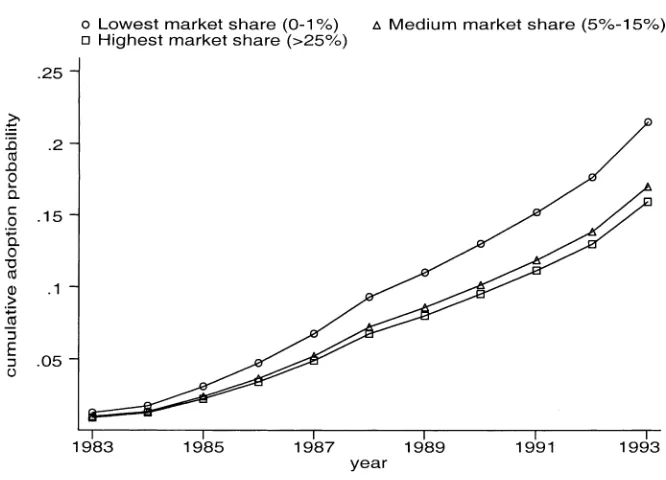
AHA data from 1994 to 1998 suggest that MRI continued to diffuse through the late 1990s, although perhaps somewhat more slowly. Fig. 1 plots the cumulative adoption probabilities for 1983–1993 from Table 1 along with the share of hospitals in the AHA survey that reported having MRI owned or provided by the hospital or a subsidiary each year for 1994–1998. As a group, AHA survey data from 1994 to 1998 show more MRI availability than the earlier data, likely because of the more general question about pro-viding MRI and the failure to distinguish fixed MRI equipment from MRI provided by mobile services. Nonetheless, the trend in the 1994–1998 data suggests continued diffusion with a possible slowing of diffusion toward the end of the time period.
Table 1
Summary of hospital MRI adoption dataa Survey
year
Hospitals “at risk”
Yearly adoptions
Cumulative adoptions
Censored Kaplan-Meier cumulative adoption probability
1983 5344 104 104 28 0.019
1984 5212 38 142 71 0.027
1985 5103 102 244 94 0.046
1986 4907 112 356 103 0.068
1987 4692 126 482 114 0.093
1988 4452 145 627 85 0.122
1989 4222 89 716 118 0.141
1990 4015 98 814 94 0.162
1991 3823 100 914 131 0.184
1992 3592 105 1019 52 0.208
1993 3435 157 1176 3278 0.244
Fig. 1. Percent of hospitals with MRI (note: from author’s calculations using AHA data. The base sam-ple is non-federal short-term general and children’s hospitals in non-rural HCSAs. Values for 1983–1993 are Kaplan-Meier estimates of the cumulative adoption probability for hospitals observed in 1983. Values for 1994–1998 are the share of hospitals surveyed each year that reported owing or providing MRI by the hospi-tal or a subsidiary).
Table 2 reports the total number of sites, magnets, and procedures in the 707 HCSAs with populations over 25 000 based on the 1993 and 1995 MRI censuses.5 In 1995, there were 2484 MRI sites in these areas. These sites operated 2787 magnets, a good indication of the number of MRI machines in operation since each machine typically requires its own magnet. A little over half of the magnets in the US are located in hospitals,6 and
the remainder are in clinics, physician offices, and other non-hospital locations. About 7.7 million MRI procedures were performed in the United States in 1993 and 8.2 million in 1995.
5. HMOs and hospital MRI, 1983–1993
Hazard models provide a natural framework for studying technology adoption by a well defined set of candidate adopters (e.g. Rose and Joskow, 1990; Cutler and McClellan, 1996).
5Limiting the analysis to the 707 HCSAs with populations over 25 000 removes very few MRI sites from consideration. In 1993, for example, there were four MRI sites, performing about 8000 procedures per year total, located in the excluded HCSAs.
Denoting the cumulative probability that hospitalihas MRI at timetbyFi(t) and the density function asfi(t), the hazard is defined as the probability that hospitaliacquires MRI at time
tconditional on not having acquired MRI up to that point:λi(t ) = fi(t )/[1−Fi(t )]. I parameterize the hazard using a proportional hazard form:λi(t )=λ0(t )exp(xi′β) where
xi denotes co-variates that determine the proportionality in the hazard and λ0(t )is the
baseline hazard. Defineγ (t ) = lnt
t−1λ0(τ )dτ
to be the logarithm of the integrated baseline hazard of adoption from t−1 to t. Then the cumulative probability of adopting MRI by timetis given by
Denote the first time is which provideriis observed to have MRI byt∗
i. The probability that MRI was acquired during the interval between timet∗
i −1 andt Lettingδi =1 for providers that are observed to adopt andδi =0 for providers that are censored, the likelihood function for the data is given by
L(γ , β)= The likelihood in Eq. (2) is based on differences in the cumulative distribution function and is the correct likelihood for data of the type analyzed here, where the intervals during which adoptions occur are observed, but not the exact timing of the adoption. I maximize the logarithm of this likelihood function using standard techniques.
To allow flexible adoption patterns over time, I use a non-parametric baseline haz-ard (Prentice and Gloeckler, 1978; Meyer, 1990). Hospitals that close, merge, or oth-erwise drop out of the sample before 1993 without adopting are considered censored.7 All of the hospitals in the sample that had not adopted by 1993 were censored in 1993.
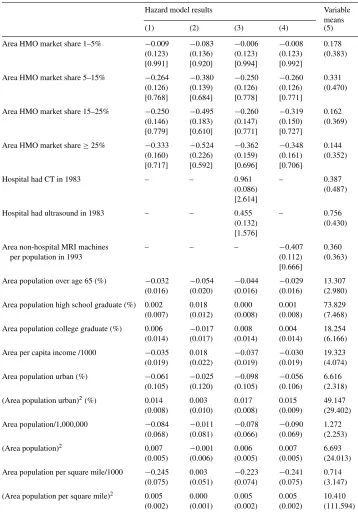
HMO market share is categorized into five groups:<1, 1–5, 5–15, 15–25, and 25% or more. This grouping will both capture non-linearities in the effect of market share and dampen the effects of any measurement error in the market share data. In addition to market share, the models include a set of hospital characteristics that could influence adoption: the average bed size of the hospital over 1983–1993 and dummy variables for hospitals affiliated with medical schools, other major teaching hospitals, and children hospitals. I also control for a variety of area characteristics. One group of area controls is designed to account for the degree of urbanization and includes the market population and pop-ulation squared, the area poppop-ulation per square mile and its square, and the percent of
the population that lives in an urban area and its square. A second set of variables aims to capture important determinants of health care demand, including population age, ed-ucation, and income. A third set of area variables controls for characteristics of the area health care system including the number of hospitals per 1000 population, and the total number of generalists, specialists, and radiologists per 1000 population. Finally, I include the average 1990 Medicare AAPCC, a general measure of health care costs and utiliza-tion patterns in the HCSA. With the exceputiliza-tion of the AAPCC, I measure all of the area variables as of 1993 since these levels seem likely to capture both actual levels of these variables over preceding years and the expectations of hospital managers about trends over 1983–1993. Column 5 of Table 3 reports means and standard deviations of the independent variables.
The first 4 columns of Table 3 report estimation results. Results from the basic model (column 1) indicate that increasing HMO activity is associated with substantial reductions in the adoption hazard. The relative hazard for each HMO market share group compared to the lowest market share areas is shown in brackets. Hospitals in the highest market share areas had adoption hazards 28% lower than hospitals in the lowest market share areas. There appears to be some non-linearity in the effect. Moving to the middle market share groups produces a substantial reduction in the adoption hazard, with slower declines as market share increases further.8
To illustrate the effects, Fig. 2 plots predicted values ofF(t) for markets with<1, 5–15, and 25% or more market share, holding other covariates fixed at their sample means. The model predicts that by 1993, the cumulative adoption probability was 15.9% for hospitals in the highest market share areas, compared to 17.0% for hospitals in the middle market share group, and 21.5% for hospitals in the lowest market share group.9
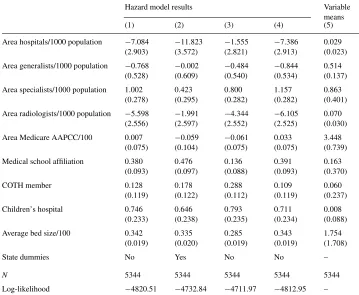
Some other coefficients in Table 3 are noteworthy. The most significant predictors of adoption in the model are hospital characteristics. More specialized hospitals, indicated by affiliation with an academic medical center or children’s hospital status, are much more likely to adopt MRI than other hospitals. Larger hospitals are also much more likely to adopt. The urbanization variables were not strong predictors of adoption, but they tend to suggest lower adoption hazards in more urbanized areas. Hospitals in areas with many other hospitals are also less likely to adopt. More urbanized areas with many hospitals may not need MRI in all area hospitals to meet population demand, and these results suggest that MRI was adopted in limited numbers of hospitals in these kinds of areas. This runs counter to the “medical arms race” hypothesis, which suggests that hospitals with many competitors
8These results are robust to a variety of respecifications, including: (1) allowing all of the non-HMO co-variates to be time-varying; (2) including a control for for-profit hospitals; (3) removing the potentially endogenous controls for area number of hospitals and physicians and the AAPCC; (4) including only hospitals in MSAs and measuring HMO market share with either GHAA/AAHP-based MSA market share estimates or Interstudy’s published market share estimates for MSAs; and (5) weighing the regressions by either area population or the area number of hospitals.
Table 3
Estimates from hospital MRI adoption hazard models, 1983–1993a
Hazard model results Variable
means
(1) (2) (3) (4) (5)
Area HMO market share 1–5% −0.009 (0.123) Area HMO market share 5–15% −0.264
(0.126) Area HMO market share 15–25% −0.250
(0.146) Area HMO market share≥25% −0.333
(0.160) Hospital had ultrasound in 1983 – – 0.455
(0.132) Area population over age 65 (%) −0.032
(0.016) Area population high school graduate (%) 0.002
(0.007) Area population college graduate (%) 0.006
(0.014) Area per capita income /1000 −0.035
(0.019) Area population urban (%) −0.061
(0.105) (Area population urban)2(%) 0.014
(0.008) Area population per square mile/1000 −0.245
(0.075) (Area population per square mile)2 0.005
Table 3 (Continued)
State dummies No Yes No No –
N 5344 5344 5344 5344 5344
Log-likelihood −4820.51 −4732.84 −4711.97 −4812.95 – aNote: Robust standard errors in parentheses. Hazard ratios in brackets. All equations include 11 baseline hazard parameters. COTH is council of teaching hospitals.
are more likely to adopt new technologies like MRI. Interestingly, demand variables, like population age, income, education, and the AAPCC are not strong predictors of adoption, and those that do approach significance suggest that characteristics normally associated with higher demand for medical care are associated with reduced adoption.
There may be characteristics of areas that are not accounted for in the models shown in column 1 that confound the effects of HMO market share. For example, some states have certificate of need programs or other laws that govern the adoption of new medical technologies. Preferences for health care and styles of treatments may also vary geograph-ically. Including state dummies is a way to control for state-level variation in policies or other characteristics, although including them also runs the risk of absorbing exogenous variation in HMO activity. Results from a model with state dummies (column 2) continue to indicate that increases in market share are associated with lower adoption hazards, and suggest an effect even stronger than observed in column 1.
Fig. 2. Predicted cumulative adoption probabilities (note: the predicted cumulative adoption probabilities are based on the model in column 1 of Table 3).
have disproportionately located in areas with low demand for high-tech diagnostic imaging because of, say, high levels of health or strong preferences for low-tech medicine among the population. HMOs may also have located in areas with strong preferences for outpatient care, and correspondingly low incentives for hospital adoption. If these kinds of factors were not captured by the co-variates included in the models above, estimates of the effect of HMOs would be biased. An approach to this problem is to control for adoption patterns of tech-nologies that diffused before managed care could have played an important role in adoption decisions. If there is some fixed characteristic of high market share areas that causes hospitals located in them to adopt new technologies more slowly than hospitals in other markets, this should be reflected in the diffusion of earlier technologies. Here, I control for the presence of CT scanners and ultrasound equipment. Both are capital embodied, diagnostic imaging technologies that had diffused to a large degree by the early-1980s. CT in particular is very similar to MRI, except that it began diffusing in 1973. I expect the presence of CT and ultra-sound by the early-1980s to reflect the underlying propensities of hospitals in different areas to adopt advanced imaging equipment, independent of the effects of managed care. An addi-tional advantage of controlling for CT and ultrasound is the potential for substitution across technologies. If hospitals with CT and ultrasound are less likely to adopt MRI because they do not see the need for another imaging technology, this would be captured in this model.
areas that leads hospitals in high market share areas to adopt advanced imaging technologies more slowly than hospitals in other areas.10
It might also be that HMOs disproportionately located in areas with strong outpatient delivery systems, where MRI adoption would naturally have occurred more frequently in outpatient settings rather than hospitals. It may also be that HMOs encouraged MRI adoption by outpatient facilities, leading hospitals to adopt less. A way to investigate this is to include the number of non-hospital MRI machines per person in 1993 from the 1993 MRI census as a control in the hazard models. This variable may be endogenous, but will absorb fixed area characteristics or HMO effects that led to reduced hospital adoption via increased non-hospital adoption. Results, in column 4, are little different, suggesting that the HMO effect is not due to characteristics of area outpatient facilities or HMO diversion of adoption to outpatient facilities.
6. HMOs and MRI machines in and out of hospitals, 1993 and 1995
The AHA data provide only part of the picture of MRI availability in the United States since many MRI machines are not in hospitals, and even for hospitals the AHA surveys do not provide information about the number of installed units. The 1993 and 1995 MRI censuses provide data on the number of magnets operated in and outside of hospitals.
I used MRI census data for 707 HCSAs with populations over 25 000 to estimate regres-sions of the form
MAGj,1993
POPj,1993
=δ0+δ1HMOj+δ2Xj+ηj (3)
MAGj,1995
POPj,1995
=β0+β1HMOj+β2Xj+ǫj (4)
where MAGj,t is the number of magnets in areajin year t, POPj,t the area population (in hundred thousands), HMOjthe average 1990–1993 HMO market share,Xj a vector of co-variates, andεandηare the error terms.11 These models include the same controls for area characteristics used in the hazard models, and add a measure of the average bed size of area hospitals.
Results are shown in Table 4. In both years, the results suggest that increases in market share are associated with declines in MRI availability. The HMO effect observed in 1995 is stronger and more consistent than in 1993. Since the difference in the estimated HMO
10Another approach to unobserved heterogeneity is to model it as a multiplicative additional source of error in the MRI adoption equation so that the hazard becomesλi(t )=θiλ0(t )exp(x′iβ)whereθiis a random variable capturing the unobserved heterogeneity, assumed to be independent ofxi(Heckman and Singer, 1984; Meyer, 1990). Parametric and non-parametric estimation of this model produced results similar to those shown, indicating that the results are not biased by unobserved heterogeneity of this particular form.
11Eqs. (4) and (5) are similar to the differences in differences model that could be estimated using data from both years pooled: MAGj,t/POPj,t=γ0+γ1Y1995j+γ2HMOj+γ3HMO∗
effects,β1−δ1, is a measure of the effect of HMO market share on the 1993–1995 growth
rate in magnets per capita, this suggests that MRI availability grew less quickly in high HMO areas. To illustrate, the bottom portion of Table 4 reports predicted values holding the control variables fixed at their sample means. In low market share areas, MRI sites per 100 000 population rose substantially between 1993 and 1995, while there were many fewer MRI adoptions in high market share areas.12 By 1995, the predicted number of magnets per person in the highest market share areas was 30% lower than in the lowest market share areas. These results can be used to obtain an estimate of the effect of managed care on the total number of MRI scanners in use. Using results from the 1995 model (column 2), I simulated the total number of magnets that would be in operation in 1995 if all market areas had market shares of<1%, and, correspondingly, 0.928 scanners per 100 000 population. By this calculation, there would have been 3255 MRI machines in operation in 1995, 468 (17%) more than the 2787 actually observed.
Consistent with the hazard model results, areas with larger hospitals have more magnets per person. More urbanized areas and areas with more hospitals also have more magnets per person. The hazard models above showed lower adoption hazards in these areas, but these re-sults suggest that there were enough more health care providers to offset the lower adoption hazards and produce higher availability. As above, most indicators of demand were not sig-nificant predictors of MRI availability, although in these models areas with higher levels of traditional Medicare spending (as measured by AAPCC) did have more magnets per person. Including state dummies as a control for state policies and state-level sources of un-observed heterogeneity produces consistent results. For example, with state dummies, the 1995 coefficient for areas with average 1990–1993 market share 15–25% is−0.172 (S.E.= 0.111) and the coefficient for areas with market share of 25% or more is−0.223 (S.E.= 0.137). Adding the number of area hospitals with CT and ultrasound in 1983 as controls for area adoption of earlier technologies has almost no impact on the coefficients.
The effect of managed care is centered in hospitals. Columns 3–6 of Table 4 report results from regressions in which the dependent variables are the number of hospital magnets (columns 3–4) and non-hospital magnets (columns 5–6) per person. Increases in HMO market share are associated with strong reductions in the number of hospital magnets in both years, with stronger effects in 1995. The effect on non-hospital magnets is much weaker. Mechanically, the coefficients from hospital and non-hospital magnet models in each year must sum to that year’s coefficient for total magnets reported in columns 1–2, so that columns 3–6 can be regarded as a decomposition of the total effect. As such, it suggests that the great majority of the observed effect of HMO market share on MRI availability came about through effects on hospitals.
This is perhaps not surprising given the tendency of managed care organizations to promote the use of outpatient health care over inpatient care. Not only may reduced demand for inpatient services directly reduce the returns a hospital would receive from owning an MRI machine, but the more general squeeze that managed care has put on hospital finances may make also it more difficult for hospitals to obtain the resources required to purchase
MRI equipment. On the other hand, managed care may have encouraged more demand for outpatient services and increased the profitability of owning MRI for physicians offices, clinics, and other outpatient sites.
7. HMOs and hospital MRI After 1993
A natural question is the extent to which these effects have persisted into the later 1990s. AHA data from 1994 to 1998 can provide information about more recent trends in hospital MRI adoption. I used this data to compute the number of hospitals that indicated having MRI “owned or provided by the hospital or a subsidiary” per 100 000 population in each area, which should serve as a general measure of MRI availability in the area. I then estimated annual cross-sectional OLS models of the form
MRI HOSPj,t
POPj,t
=β0+β1HMOj+β2Xj +ǫj,t (5)
where MRI HOSPj ,tdenotes the number of hospitals with MRI in areajin yeart. HMOjand
Xjdenote the same set of HMO measures and other co-variates used in the MRI availability models.
These models indicate substantial reductions in the number of hospitals with MRI associ-ated with increasing HMO market share, consistent with the view that the effects observed above have persisted. In 1994, there were 0.670 hospitals with MRI per 100 000 population in the United States as a whole. Areas with market shares of 15–25% had 0.203 fewer MRI hospitals per 100 000 population than areas with less than 1% market share (S.E.=0.103). Areas with HMO market shares of 25% or more had 0.353 fewer (S.E.=0.133). By 1998, the gap had widened. There were then 0.771 MRI hospitals per 100 000 population in the US, and areas with the highest market shares had 0.526 fewer MRI hospitals than areas with the lowest market shares (S.E.=0.185).
These results suggest that MRI diffused more quickly during 1994–1998 in lower market share areas than in higher market share areas. Evaluating predicted values from these models around the national means suggests that areas with less than 1% market share went from 0.815 MRI hospitals per 100 000 population in 1994 to 0.995 in 1998. Areas with market shares 15–25% went from 0.612 to 0.665, and areas with market shares of 25% or more stayed approximately constant, moving from 0.462 to 0.469.
8. MRI utilization
Reductions in adoptions could reduce patient access to MRI equipment.13 Managed care could also directly reduce utilization, given a fixed number of MRI machines. I investigate
Table 5
Estimates from OLS regression models for MRI procedures per person, 1993 and 1995a Total procedures
per 100000 population
Hospital procedures per 100000 population
Non-hospital procedures per 100000 population
1993 1995 1993 1995 1993 1995
(1) (2) (3) (4) (5) (6)
Market share 1–5% −168 (130) −287 (147) −223 (128) −307 (146) 55 (88) 20 (84) HMO market share 5–15% −214 (146) −449 (153) −320 (136) −493 (151) 106 (105) 44 (104) HMO market share 15–25% −427 (193) −632 (208) −336 (164) −633 (198) −91 (180) 1 (179) HMO market share≥25% −433 (208) −825 (228) −452 (185) −841 (217) 19 (174) 16 (180)
N 707 707 707 707 707 707
R2 0.456 0.374 0.193 0.148 0.360 0.327
Predicted values
Market share<1% 2236 2637 1596 1984 640 653
Market share 1–5% 2068 2350 1373 1677 695 673
Market share 5–15% 2021 2188 1276 1491 745 697
Market share 15–25% 1809 2005 1260 1350 549 654
Market share≥25% 1803 1812 1144 1143 659 669
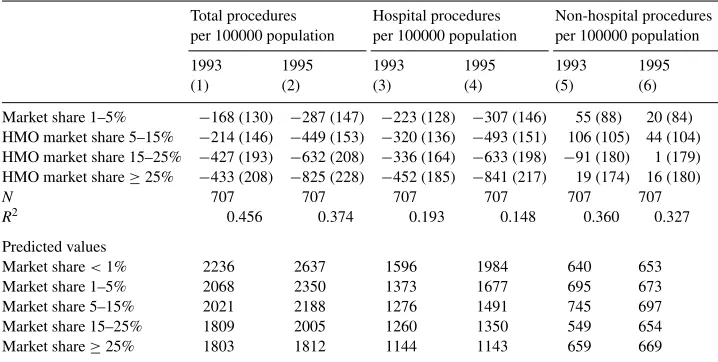
aNote: Robust standard errors in parentheses. The models also control for urbanization, demographics, and area health system characteristics. Predicted values are computed holding other covariates in the models at their sample means. Procedure data from the 1993 survey reflect the number of procedures performed in 1992; data from the 1995 survey reflect procedures performed in 1994.
the impact of HMO market share on MRI procedure use using models analogous to those estimated for magnets per person. Procedure volume data are derived from the 1993 and 1995 MRI censuses, which asked sites to indicate their total annual procedure volume in the preceding year. I include procedures from sites with fixed equipment and sites contracting with mobile services. Regression results are presented in Table 5. Increases in HMO market share are associated with substantial reductions in total procedure use in both 1992 and 1994, with stronger effects in 1994. Areas with market shares of 25% or more performed more than 800 fewer procedures per 100 000 population than areas with<1% market share, a reduction of 31% for an area with average characteristics. As with magnets, the declines in procedure utilization are largest in hospitals, and there is little evidence of an effect of managed care on non-hospital procedure use.
I simulated the effects of managed care on the total number of MRI procedures performed, using results from the 1995 model and computing the total number of procedures predicted to have been done if all market areas had market shares of<1%. By this calculation, there would have been just over 9.5 million procedures done in 1995, 1.3 million (16%) more than the 8.2 million observed.
speed up treatments, and ease worries about the presence of serious health conditions, so reductions in procedure use could reduce patient welfare. The magnitude of this effect is difficult to determine. In a fee-for-service system, MRI services may well be consumed to the point where the value of the marginal procedure is low. If this is the case, and the marginal procedures are the ones that get rationed in the presence of managed care, then welfare reductions from reduced procedure use could be small. These data, though, do not provide information about the value of the specific procedures foregone, so a more detailed assessment would have to be taken up by future work with better data.
In both 1993 and 1995, the reduction in procedure volume associated with increasing market share is about the same size as the reduction in magnets, so that on average the number of procedures per magnet stays about the same with increases in market share. This is interesting in that it suggests managed care activity has not increased the efficiency with which MRI machines are used, a goal frequently espoused by managed care plan that would likely be furthered by increasing the number of procedures per machine. Note though that the number of magnets may change more slowly than procedure use and may not have reached equilibrium. A lack of change in overall procedures per magnet could also occur if managed care plans concentrate their patients at efficient centers with high volume, but leave other centers with reductions in volume so that the overall mean is not changed.
9. Conclusions
Data from AHA surveys and from two MRI censuses indicate that increases in HMO activity are associated with slower diffusion of MRI equipment and lower overall MRI availability. This is consistent with the view that changes in incentives brought about by managed care can have important impacts on technology diffusion in health care.
Since MRI is still diffusing, it is probably too early to say for sure that the equilibrium levels of MRI will be lower in high managed care areas, although that would be a natu-ral outcome of the patterns observed so far. In particular, evidence from the most recent AHA surveys does suggest a general slowing in MRI diffusion in the late-1990s, coupled with substantially reduced MRI availability levels in high managed care areas, consistent with the patterns one might expect if managed care were to bring about lower equilibrium availability levels.
facilities in 1995 and thereafter, this would produce annual savings on the order of US$ 200 million. Finally, each MRI procedure incurs costs for film, other supplies, and a fee for the physician who reads the MRI. Bell (1996) estimated these to be about US$ 200 per proce-dure. The procedure use models from the MRI census data indicated a reduction of about 1.3 million MRI procedures associated with increasing HMO market share in 1995, suggesting annual savings of another US$ 260 million in per-procedure costs. These are only rough estimates, but they clearly suggest the potential for reductions in MRI adoption and use to produce substantial savings, particularly over time as large annual savings accumulate.
Although the savings may be substantial, these results do not by themselves demonstrate that managed care can have long-term impacts on cost growth rates. Reductions in adop-tion and frequency of use for any single technology need only produce one-time savings. To substantially impact cost growth rates, managed care would have to slow the pace of development and adoption of many new technologies, or persistently limit the spread of a range of technologies to new conditions and patients. The fact that managed care can influence adoption and use of MRI leaves open the possibility that it might be able to do so for other technologies as well, although the extent to which these effects can be extrapolated to other technologies is not completely clear. In the field of diagnostic imaging, there are other diffusing technologies that are not unlike MRI, including PET and SPECT scanners, and which might be affected in similar ways. However, MRI differs in important ways from other new technologies like genetic screening procedures. Further research on other technologies and on other aspects of technology development and use are needed to fully evaluate the long-term effects of managed care.
A full assessment of the implications of managed-care-induced changes in MRI adoption and use must balance welfare gains from savings against potentially offsetting changes in patient care or health outcomes. I did observe reductions in procedure use, which could reduce welfare, although the extent to which they would do so is hard to determine. It seems quite possible that fee-for-service incentives could have prompted the consumption of MRI to the point where the marginal value was low, so that welfare reductions from reduced utilization of marginal procedures may be small, and the welfare gains from expenditure savings more likely to dominate. On the other hand, if the baseline marginal value was not low or if the procedures rationed were inframarginal, effects could be larger. These data are insufficient to specifically investigate the value of the foregone procedures and further attention should be paid to their value for patients. Managed-care-induced changes in technology adoption also warrant attention for the impact they could have on future technology development. If researchers and developers alter their efforts in response to managed care, the future direction and extent of new developments in medical technology could be altered. This could have potentially important impacts on patient welfare, although it is not clear whether one should expect any such changes to be welfare increasing or decreasing, and it may be very difficult to empirically determine.
Acknowledgements
assistance with data analysis. This project was supported by a grant from the Robert Wood Johnson Foundation’s Health Care Financing and Organization Program.
Appendix A. Additional information about the data
A.1. AHA data
Beginning with the 1983 survey, the AHA has used four different sets of questions to inquire about the presence of MRI. In 1983–1989, the AHA survey asked hospitals whether they had hospital-based MRI, MRI was provided by another hospital or provider, or whether MRI was not available. Some hospitals may offer MRI through a contract with a mobile service that operates equipment mounted on vehicles that move from place to place. In 1990, the survey retained the original question and added a question asking hospitals that indicated having hospital-based MRI services whether they used fixed equipment or provided MRI through a contract with a mobile provider. The 1993 survey added the option for hospitals to say MRI was provided using both fixed and mobile equipment to the second question, (no hospitals indicated using both). In 1994, the AHA survey changed the question format dramatically, replacing the earlier questions with a series of questions asking whether MRI was “owned or provided by (the) hospital or a subsidiary” or provided by other providers in health systems, networks, joint ventures, or elsewhere in the local community. This change is associated with an increase in the number of hospitals that reported having MRI. My hazard model analysis of adoption over time runs from 1983 to 1993. Separate analysis of data from 1994 to 1998 is reported in the text.
I used responses to AHA survey questions to identify hospitals that adopted fixed MRI equipment between 1983 and 1993 and the year in which they did so. I considered four definitions of adoption year:
1. Adoption year is the first year in which the hospital says it has MRI (pre-1990) or fixed MRI (post-1990).
2. Adoption year is the first year of the first consecutive pair of years in which the hospital says it has MRI (pre-1990) or fixed MRI (post-1990). For example, a hospital that said it had MRI in 1985, 1987, and 1988, but not 1986 would be defined to have adopted in 1987. Forcing hospitals to indicating having MRI twice in a row to signify adoption results in the reclassification of a small number of hospitals that indicate having MRI in 1 year but then say that they do not have it in surrounding years.
3. Adoption year is the first year of the first consecutive pair of years, or triple of years with missing MRI information in the middle year, in which the hospitals says it has MRI (pre-1990) or fixed MRI (post-1990). For example, a hospital that said it had MRI in 1985, 1987, and 1989, but said no in 1986 and had missing MRI data in 1988, would be defined to have adopted in 1987.
4. The same as definition three, but reclassifies hospitals that adopted in 1986–1989, but who said they had mobile MRI in at least 2 of the 3 years 1990–1992 as having had mobile MRI the whole time. For example, a hospital that said it had MRI in 1988 and 1989 but said it had a mobile unit in 1990 and 1991 would not be defined as adopting in 1988.
Definition four appears to have the best chance of accurately identifying the year of fixed MRI adoption, and it is the definition used in the paper. Results using the other definitions are generally similar, but statistically weaker in the case of definition one.
A.2. TMG MRI censuses
These surveys were designed to contact all of the sites offering MRI in the country. The sampling frames for these surveys were developed using “snowball sample” techniques. An initial set of sites offering MRI was identified from state licensing records, manufacturer sales data, and other sources. These sites were contacted and asked to identify other sites offering MRI in their area. Newly identified sites were similarly contacted, and so on until no new sites were identified. It appears that this technique identified most if not all of the sites providing MRI in the country. Although it is not possible to fully verify the data, they do compare well with the AHA data where applicable. Furthermore, since virtually all sites with fixed MRI equipment are known to state regulators and/or manufacturers, it is very likely that all of the sites with fixed equipment were identified in the sample.
Using this frame, a survey of all identified sites was conducted. Survey questions in-cluded whether the site used fixed or mobile equipment, whether the site was a hospital or non-hospital site, the number of fixed magnets at the site, and the number of procedures performed. With extensive follow up, at least some data was obtained for all of the sites surveyed. For the questions used in the paper, item response rates are generally quite good. Virtually, all sites reported whether they used fixed or mobile equipment, and whether they were a hospital or a non-hospital site. Data for the few non-responders to these questions were imputed based on previous surveys and responses to other survey questions.
Fixed sites were asked about the number of magnets they had in operation in each year. Most, but not all, sites provided this information. On the 1995 survey, for example, 86% indicated the number of magnets in operation. To estimate the total number of magnets in operation throughout the United States, the number of magnets for non-responding sites was imputed based on responses to the previous survey (for 1995 non-responders) and responses to other survey questions. Since the vast majority of sites use one magnet, and sites using multiple magnets are relatively well known and identifiable, imputation for non-responding sites is not expected to bias results. I experimented with repeating the analysis of magnets per person using just the markets in which all of the sites reported the number of magnets, and the results were essentially unchanged.
were filled in using regression imputation that accounted for site-type and the number of magnets at the site. The 1992 procedure data from the 1993 survey was handled similarly. In analyzing procedures per person, I first used only 331 markets in which all sites reported procedure volume. I then performed analyses using all of the markets in the sample, relying on imputed data for sites that did not report procedure volume. Results from these two sets of analyses were similar and so, in the interest of presenting as broad a picture as possible, I report data from all markets in the paper.
A.3. HMO market share data
Construction of county-level estimates of HMO market share, which were aggregated to the HCSA level for analysis, took place in three steps. First, the total enrolment and service area, specified by county, were obtained for each HMO in the United States. The primary source of information on HMO enrolments and service areas is the National Directory of HMOs, published annually by the Group Health Association of America (GHAA, various years). Each year the GHAA conducts a mail survey, with telephone follow up, of all known HMOs in the country and, among other things, asks their total enrolment and their service area. The results of the survey are published in the annual directories. Virtually all of the HMOs in the directories indicated their enrolment. In cases where enrolment was not reported, enrolment was determined by reference to subsequent directories and/or telephone contact. Virtually, all HMOs indicated the counties that they served, although some did not provide a clear definition of their market area in terms of counties. For these HMOs, market areas were determined by reference to subsequent directories and/or telephone contact.
The next step was to distribute the enrolment of each HMO among the counties in its ser-vice area. Initially, this was done by simply distributing enrolment proportionally to county population. In addition, since HMO enrolment may be concentrated near HMO headquarters or since HMOs may locate their headquarters in areas where their enrolment is concentrated, estimates that incorporate both county population and distance from HMO headquarters were constructed. The correlation between estimates produced by the two methods is ap-proximately 0.97. Estimates that incorporate both population and distance are used here.
Once enrolments had been distributed over service areas, the total number of enrollees in each county was computed by summing over the set of HMOs serving that county. Using the set of county enrolment estimates, market share estimates were computed as the proportion of the population enrolled in HMOs. These estimates were then aggregated to the HCSA level for analysis.
are all quite high, particularly given the variations in the years of the observations and the populations that are represented (e.g. the entire population as opposed to employees).
References
Anderson, G.F., Steinberg, E.P., 1984. To buy or not to buy: technology acquisition under prospective payment. New England Journal of Medicine 311 (3), 182–185.
Baker, L.C., 1997. HMOs and fee-for-service health care expenditures: evidence from Medicare. Journal of Health Economics 16 (4), 453–482.
Baker, L.C., 1999. Association of managed care market share and health expenditures for fee-for-service Medicare patients. Journal of the American Medical Association 281 (5), 432–437.
Baker, L.C., Brown, M.L., 1999. Managed care, consolidation among health care providers, and health care: evidence from mammography. Rand Journal of Economics 30 (2), 351–374.
Baker, L.C., Corts, K.S., 1996. HMO penetration and the cost of health care: market discipline or market segmentation? American Economic Review 86 (2), 389–394.
Baker, L.C., Phibbs, C.S., 2000. Managed care, technology adoption, and health care: the adoption of neonatal intensive care. National Bureau of Economic Research. Working Paper no. 7883.
Baker, L.C., Spetz, J., 1999. Managed care and medical technology growth. In: Garber, A.M. (Ed.), Frontiers in Health Policy Research, Vol. 2. MIT Press, Cambridge, MA, pp. 27–52.
Baker, S.R., 1979. The diffusion of high technology medical innovation: the computed tomography scanner example. Social Science and Medicine 13D, 155–162.
Baltaxe, H.A., Geokas, M.C., 1983. Nuclear magnetic resonance. Annals of Internal Medicine 98 (4), 540–542. Banta, H.D., 1980. The diffusion of the computed technology (CT) scanner in the United States. International
Journal of Health Services 10 (2), 251–269.
Bell, R.A., 1996. Economics of MRI technology. Journal of Magnetic Resonance Imaging 6 (1), 10–25. Chernew, M., 1995. The impact of non-IPA HMOs on the number of hospitals and hospital capacity. Inquiry 32 (2),
143–154.
Clement, D.G., Gleason, P.M., Brown, R.S., 1992. The effects of risk contract hmo market penetration on medicare fee-for-service costs. Final Report. Mathematica Policy Research, Princeton, NJ.
Cutler, D.M., Sheiner, L., 1998. Managed care and the growth of medical expenditures. In: Garber, A.M. (Ed.), Frontiers of Health Policy Research, Vol. 1. MIT Press, Cambridge, MA, pp. 77–116.
Cutler, D.M., McClellan, M.B., 1996. The determinants of technological change in heart attack treatment. National Bureau of Economic Research, Working Paper no. 5751.
Cutler, D.M., McClellan, M.B., Newhouse, J.P., 1998. The costs and benefits of intensive treatments for cardiovascular disease. National Bureau of Economic Research, Working Paper no. 6514.
Feldman, R., Dowd, B., Gifford, G., 1993. The effect of HMOs on premiums in employment-based health plans. Health Services Research 27 (6), 779–811.
Feldman, R., Dowd, B., McCann, D., Johnson, A., 1986. The competitive impact of health maintenance organizations on hospital finances: an exploratory study. Journal of Health Politics, Policy, and Law 10 (4), 675–698.
Fendrick, A.M., Escarce, J.J., McLane, C., Shea, J.A., Schwartz, J.S., 1994. Hospital adoption of laparoscopic cholecystectomy. Medical Care 32 (10), 1058–1063.
Frank, R.G., Welch, W.P., 1985. The competitive effects of HMOs: a review of the evidence. Inquiry 22, 148–161. Fuchs, V., 1996. Economics, values, and health care reform. American Economic Review 86 (1), 1–24. GHAA, various years. National Directory of HMOs. Group Health Association of America, Washington, DC. Globerman, S., 1982. The adoption of computer technology in hospitals. Journal of Behavioral Economics 11 (2),
67–95.
Goldberg, L.G., Greenberg, W., 1979. The competitive response of blue cross and blue shield to the growth of health maintenance organizations in northern California and Hawaii. Medical Care 17 (10), 1019–1028. Heckman, J., Singer, B., 1984. A method for minimizing the impact of distributional assumptions in econometric
models for duration data. Econometrica 52 (2), 271–320.
Hillman, A.L., Schwartz, J.S., 1985. The adoption and diffusion of CT and MRI in the United States. Medical Care 23 (11), 1283–1294.
Hillman, A.L., Schwartz, J.S., 1986. The diffusion of MRI: patterns of siting and ownership in an era of changing incentives. American Journal of Roentgenology 146, 963–969.
Interstudy, 1997. Competitive Edge. Interstudy, Excelsior, MN.
Lee, R.H., Waldman, D.M., 1985. The diffusion of innovations in hospitals: some econometric considerations. Journal of Health Economics 4, 373–380.
Makuc, D.M., Haglund, B., Ingram, D.D., Kleinman, J.X., Feldman, J.J., 1991. Health care service areas for the United States. Vital and Health Statistics, Series 2, no. 112. PHS 92-1386, National Center for Health Statistics, Washington, DC.
Mansfield, E., 1968. Industrial Research and Technological Innovation: An Econometric Analysis. Norton and Company, New York.
McLaughlin, C.G., 1987. HMO growth and hospital expenses and use: a simultaneous-equation approach. Health Services Research 22 (2), 183–205.
McLaughlin, C.G., 1988. The effect of HMOs on overall hospital expenses: is anything left after correcting for simultaneity and selectivity? Health Services Research 23 (3), 421–441.
Meyer, B.D., 1990. Unemployment insurance and unemployment spells. Econometrica 58 (4), 757–782. Miller, R.H., Luft, H.S., 1997. Does managed care lead to better or worse quality of care? Health Affairs 16 (5),
7–25.
Newhouse, J.P., 1992. Medical care costs: how much welfare loss? Journal of Economic Perspectives 6 (3), 3–21. Noether, M., 1988. Competition among hospitals. Journal of Health Economics 7 (3), 259–284.
Prentice, R., Gloeckler, L., 1978. Regression analysis of grouped survival data with application to breast cancer data. Biometrics 34, 57–67.
Reinganum, J.F., 1989. The timing of innovation: research, development, and diffusion. In: Schmalensee, R., Willig, R.D. (Eds.), Handbook of Industrial Organization, Vol. 1. North-Holland, Amsterdam, pp. 849–908. Robinson, J.C., 1991. HMO market penetration and hospital cost inflation in California. Journal of the American
Medical Association 266 (19), 2719–2723.
Robinson, J.C., 1996. Decline in hospital utilization and cost inflation under managed care in California. Journal of the American Medical Association 276 (13), 1060–1064.
Romeo, A.A., Wagner, J.L., Lee, R.H., 1984. Prospective reimbursement and the diffusion of new technologies in hospitals. Journal of Health Economics 3, 1–24.
Rose, N.L., Joskow, P.L., 1990. The diffusion of new technologies: evidence from the electric utility industry. Rand Journal of Economics 21 (3), 354–373.
Russell, L.B., 1977. The diffusion of hospital technologies: some econometric evidence. Journal of Human Resources 12 (4), 482–502.
Salkever, D.S., Bice, T.W., 1976. The impact of certificate-of-need controls on hospital investment. Milbank Memorial Fund Quarterly 53, 185–214.
Steinberg, E.P., Evens, R.G., 1988. Economics. In: Stark, D.D., Bradley, W.G. (Eds.), Magnetic Resonance Imaging. CV Moseby, St. Louis, MO, pp. 258–265.
Teplensky, J.D., 1993. Organizational adoption of a capital-based technology under conditions of changing uncertainty: a competitive analysis. Case Western Reserve University, in preparation.
Teplensky, J.D., 1994. Organizational adoption of technological innovations: binary decision behavior or continuum of options. Case Western Reserve University, in preparation.
Teplensky, J.D., Pauly, M.V., Kimberly, J.R., Hillman, A.L., Schwartz, J.S., 1995. Hospital adoption of medical technology: an empirical test of alternative models. Health Services Research 30 (3), 437–465.
Vanden Brink, J., 1995. The Impact of Managed Care on Medical Technology Utilization. Technology Marketing Group, Des Plaines, IL.
Vogt, W.B., 1997. Detecting strategic behavior in technology adoption: the example of magnetic resonance imaging. Carnegie Mellon University, in preparation.
Weisbrod, B., 1991. The health care quadrilemma: an essay on technological change, insurance, quality of care, and cost containment. Journal of Economic Literature 29, 523–552.
Welch, W.P., 1994. HMO market share and its effect on local Medicare costs. In: Luft, H.S. (Ed.), HMOs and the Elderly. Health Administration Press, Ann Arbor, MI, pp. 231–249.