Entrepreneurial Orientation versus Small
Business Orientation: What Are Their
Relationships to Firm Performance
?
by Rodney Runyan, Cornelia Droge, and Jane Swinney
This study examines the constructs of entrepreneurial orientation (EO) versus small business orientation (SBO), their impact on small business performance, and whether these effects are moderated by longevity. A sample of 267 small business owners from 11 small–medium downtowns was used in structural equation modeling (SEM) testing of the measurement, structural and moderation hypotheses. The mea-surement confirmatory factor analyses models of the two constructs revealed that EO and SBO are unique constructs. Then a structural model predicting performance was tested. Finally, a two-group model split on “below 11 years” versus “11+years” demonstrated that the structural paths connecting EO and SBO to performance are not the same in these groups: for the younger group, only EO significantly predicts performance while for the older group, only SBO significantly predicts performance.
Introduction
Entrepreneurship has been the topic of “intensive inquiry” over the years (Stewart et al. 1998), yet only a few rela-tionships are widely accepted; one is between entrepreneurial orientation (EO) and firm performance. The more small firm owners adopt an EO, the more
they achieve competitive advantage (Covin and Slevin 1989; Miller 1983) and enhanced performance (Wiklund and Shepherd 2005; Covin and Slevin 1989). However, Carland et al. (1984) posited that not all small business owners are entrepreneurs. They established a typol-ogy of business owners by distinguishing between those with EO and other small
Rodney Runyan is an assistant professor of retailing, University of Texas. Cornelia Droge is a professor of marketing, Michigan State University.
Jane Swinney is an assistant professor in the Department of Design, Housing and Merchandising, Oklahoma State University.
Address correspondence to: Rodney C. Runyan, Department of Retailing, Hospitality and Tourism Management, University of Tennessee, 245 Jessie Harris Bldg, Knoxville, TN 37996. Tel: 865-974-4594. E-mail: [email protected].
business owners having a “small busi-ness orientation” (SBO), suggesting that the two have different short and long-term goals.
The distinction between EO and SBO has been the subject of subsequent research (Miles, Covin, and Heeley 2000; Stewart et al. 1998), and a significant number of small business owners likely have more of a SBO than an EO (Stewart and Roth 2001; Stewart et al. 1998). Much of the early work on SBO pointed to psychological traits of the small busi-ness owner such as their goals and purposes as well as their emotional attachment to the firm. However, the psychological attributes were primarily from the personality and entrepreneurial psychology literatures (Stewart and Roth 2001) and their role in furthering under-standing of the connection between strategic orientation and performance was often unclear (Naffziger, Hornsby, and Kuratko 1994; Johnson 1990; Carland et al. 1984).
Furthermore, studies on the differ-ences between entrepreneurs and other small business owners usually measured entrepreneurial characteristics only (Stewart et al. 2003, 1998; Stewart and Roth 2001; Carland et al. 1995, 1988, 1984. In these studies, a high score on the entrepreneurial variables means high levels of EO, whereas low scores on these same variables means high levels of SBO. Thus in past approaches, EO and SBO are inversely related by definition and measurement, and thus their sepa-rate effects on performance cannot be investigated.
The present study addresses the gaps in the research concerning both mea-surement and structural paths. The salient questions we address are first, whether EO and SBO are distinct con-structs. Although domain-specific scales have been constructed and operational-ized to measure EO (Covin and Slevin 1989; Miller 1983), such scales have yet to be independently constructed and
tested for SBO. Thus our study extends entrepreneurship research by proposing and testing measurement models to measure the extent of EO versus SBO in small business owners. Our second
research question concerns which orientation—EO versus SBO in a struc-tural model—has the most impact on small business performance. While EO has been shown to provide competitive advantage and improve performance, SBO has not been tested for similar rela-tionships with performance outcomes. If the recent research is correct and a large number of small business owners indeed do have more of an SBO than an EO, then the question of whether SBO is related to competitive advantage is an important one. Third, stage in the busi-ness life cycle as reflected in longevity is explored in a moderation model of EO-performance and SBO-performance relationships. Research suggests that business life cycle stages may be related to the degree of EO or SBO (Stewart et al. 1998; Timmons 1990).
We address these questions within the context of the resource-based view (RBV) of business strategy, an approach which has a solid history in small busi-ness research (e.g., Hunt and Derozier 2004 cited the RBV as an important theo-retical base in entrepreneurial studies). RBV theory focuses on the collection of firm resources and capabilities (Brush and Chaganti 1998), and we view EO and SBO as two resource strategies. Miles, Covin, and Heeley (2000) noted that EO is a strategic choice; similarly, we view SBO as a strategic choice. In general, Galbraith and Schendel (1983) describe individual business-related decisions as interactive and interdependent, perhaps forming a “pattern” reflecting strategic stance; we view EO and SBO as two such “patterns.”
hypotheses. We have a multimethod approach: focus group research is fol-lowed by a large, survey-based study of varying types of small businesses oper-ating in small downtown central business districts. Using structural equation mod-eling (SEM), we assess the fit of the data to our proposed models. The discussion and suggestions for future research con-clude the article.
Measurement Model:
EO versus SBO
Both EO and SBO are conceptualized as strategic resources in this research. These two orientations are considered theoretically distinct and unique resources in the entrepreneurial theory literature (Stewart and Roth 2001; Carland et al. 1988, 1984). Carland et al. (1984) initially described an entrepre-neur as an individual who operates a small business for profit and growth, while Stewart and Roth (2001) referred to entrepreneurial small business owners as “growth oriented.” For this study we consider growth to be a key differentia-tor. Asmall business owneris defined as the individual who establishes and manages a business for the purpose of furthering personal goals and agendas (Jenkins and Johnson 1997). We utilize the same typologies for the current study. As described further in the text, a small business owner is depicted as having more of a SBO versus an EO, based on the owner’s different short-term and long-short-term goals (Davidsson 1989; Woo, Cooper, and Dunkelberg 1986; Carland et al. 1984). Goals may explain and predict the behavior of businesses (Bateman, O’Neill, and Kenworthy-U’Ren 2002; Cooper 1993).
EO
Schumpeter (1934) first described entrepreneurs as innovators and this has been supported by the work of Lumpkin and Dess (1996), Covin and Slevin
(1989), Miller and Friesen (1982), Vesper (1980), and others. EO is evidenced through visible entrepreneurial tenden-cies toward innovativeness, proactive-ness and risk taking. Miller (1983) as well as Covin and Slevin (1989) opera-tionalized these three constructs and see them as central to EO. Proactiveness as an aspect of entrepreneurial behavior was clearly delineated by Covin and Slevin (1989), Miller (1983), as well as Lumpkin and Dess (1996). Risk taking (social, personal, and psychological risk, as well as strategic risk) is another char-acteristic ascribed to entrepreneurs and generally operates in a range from risk averse to risk prone (Lumpkin and Dess 1996; Baird and Thomas 1985; Gasse 1982). Stewart and Roth (2001) and Miller and Friesen (1982) found entrepre-neurs had higher levels of risk propen-sity than other small business owners.
SBO
“acceptable” business performance levels (rather than maximizing performance). Vesper (1980) points out that many small business owners never intend for the venture to grow beyond a specified level. Fischer, Reuber, and Dyke (1993) found that concerns for a balanced lifestyle figure prominently in motivations for starting and managing a business and that this desire for balance correlates with performance outcomes.
Beyond goal focus, SBO is distinct from EO in that small business owners may have less of a preference for inno-vation than exhibited by entrepreneurs (Stewart et al. 1998; Carland et al. 1984). Carland et al. (1984) suggested that entrepreneurs typically engage in inno-vation, introduce new goods and methods, and open new markets and sources of supply, while small business ventures are independently owned, not dominant in their field and do not engage in many new or innovative prac-tices or marketing (for a discussion of these distinctions, see Stewart et al. (1998). Other researchers have also examined the differences between EO and SBO (Stewart et al. 2003, 1998; Stewart and Roth 2001; Carland et al. 1988) and encourage research to under-stand these orientations more fully. Our study meets this call for research.
Measurement Model Hypothesis
Earlier research on SBO utilized scales designed for psychological research, outside the domain of small business. These scales have allowed researchers to measure SBO only in relation to EO because those respondents who score low on EO are considered to have high SBO by definition; that is, previous research measured SBOin inverse rela-tionship to EO (Stewart et al. 2003, 1998). Measuring SBO and EO as inverses supports the view that EO and SBO are opposite ends of the same con-tinuum, but runs contrary to the many entrepreneurship scholars who posit that
EO and SBO are distinct orientations (Stewart et al. 1998; Carland et al. 1984). Because the current study proposes that EO and SBO are separate and dis-tinct conceptually, it is imperative to propose a measurement model in which the EO and SBOscalesare separate, reli-able and valid, while the EO and SBO
constructs are distinct. Such a measure-ment model is essential if the effects of EO and SBO on performance are to be compared. The current research study began with measurements of innovative-ness, risk-taking, and proactiveness as reflective of EO. Separately, SBO was evaluated on two fronts: goals of the business owner and emotional attach-ment of the owner to the business. The emotional attachment measures emerged from focus group interviews with business owners and from the lit-erature (Stewart and Roth 2001; Carland et al. 1984). Therefore we propose the following measurement model hypothesis:
H1: (measurement model research hypothesis): (a) Measures of innova-tiveness, proactiveness, and risk-taking are significant and positive indicators of the latent construct EO while (b) measures of emotional attachment and goals are significant and positive indicators of the latent construct SBO. (c) EO and SBO are distinct constructs.
Structural and
Moderation Hypotheses:
EO versus SBO as
Determinants of
Performance
The Meaning of Performance
example, Venkatraman and Ramanujam (1986) proposed a two-dimensional categorization scheme encompassing outcome-based financial indicators versus operational performance mea-sures. Previous research on small firm performance often asked for relative per-formance evaluations of sales growth, return on sales, net profit, and gross profit (Lumpkin and Dess 2001). Brush and Chaganti (1998) used two indices: net cash flow and change in the number of employees (a proxy for growth). Overall, growth measures are widely used performance indicators for small firms, along with “financial success” measures.
Some small businesses are not really planning to grow however: these types of businesses have different business goals, and may work for a positive cash flow simply to remain in business. For firms that are owned and managed by an individual with little EO for example, the concept of positive performance can include more than financially based measures and/or the norm may be sat-isficing rather than maximizing financial performance. Steers (1975) refers to this type of goal as an “operative” goal, and performance is measured by how the firm is meeting that goal. This is not new to the study of organizations: Georgopoulos and Tannenbaum (1957) noted that the common practice of using univariate measures such as profit and sales is often found to be inconsis-tent with broad overall concepts of organizational effectiveness. Goals are often conceptualized as future situations that an organization wants to achieve (Etzioni 1975), and effectiveness or per-formance is tied to the attainment of these goals (Hall and Clark 1980; Steers 1975). Thus by “performance,” we mean overall performance as perceived and evaluated by the small business owner (and not performance as defined by return on sales [ROS] or return on investments [ROI] or any other specific
measure whose very meaning may depend on EO and/or SBO).
Structural Model: The Effects of EO and SBO on Performance
Prior research has shown a significant and positive relationship between EO and firm performance (Wiklund and Shepherd 2005; Covin and Slevin 1989), but these findings come from research involving small businesses different from those in the current study. However we expect a similar positive relationship between EO and firm performance will be confirmed in the current study.
To date, no one has tested the effects of SBO upon firm performance. If indeed SBO is distinct from EO, then it is incum-bent upon researchers to examine whether it has any effect at all on performance. If higher EO leads to increased firm performance, then does a higher SBO lead to decreased perfor-mance? Such a proposal might be sup-ported by the prior utilized measurement model, which categorized lower scores on EO as being higher on SBO by defi-nition. We believe however that a strong emotional attachment to a business (as well as business goals that coincide with personal goals) will have a positive effect on firm performance. Thus:
H2: (structural model research hypoth-esis): (a) EO and (b) SBO are both significant and positive predictors of small business performance.
Moderation Model: The Effects of Longevity
steady sales and profits may be quite attractive to a buyer seeking stability as opposed to growth (thus exhibiting more of an SBO than an EO). In contrast, an older firm in the maturity or decline stage may be purchased by a new owner who is looking to reinvigorate the firm, thus utilizing more of an EO strategy. Our study seeks to measure the effects of theowner’sorientation, and to disaggre-gate that from the age of the firm itself. In attempting to understand the underly-ing relationships of the two orientations to business performance, we propose to test the hypothesis thatlongevityof own-ership could be a moderator of the rela-tionships specified in H2a and H2b.
H3: (moderation model research hypoth-esis): Longevity moderates the rela-tionships of EO and of SBO to small business performance.
Methodology
Focus Group Research
Focus group interviews were con-ducted with small business owners and directors of the Downtown Development Authority (DDA; or similar groups) in four Midwestern U.S. towns. The towns had populations between 4,700 and 14,000. The economic bases were gener-ally diverse, with a mix of manufactur-ing, retail and food, agriculture and self-employment. Some towns had significant tourism industries. Thus the sample was diverse enough to expect a varied range of answers on economic-related issues.
Interviews were conducted with groups of between 8 and 12 participants, as recommended for optimal feedback and group interaction (McDaniel and Gates 2001). Every effort was made to utilize the same questions and discussion frame in all groups. All interviews were audiotaped and then transcribed. We kept field notes from each meeting; these were useful when taped answers were garbled or too faint to understand.
Following the fourth focus group session, convergence was found on most of the key constructs and we decided to end our discussions. General a priori constructs were confirmed, and others were identified that seemed to describe the perceptions small business owners had toward their own business. The focus group feedback revealed that there were indeed distinct differences between the small business owners who viewed themselves (or their peers) as entrepre-neurs, and those who did not.
Most focus group members were in agreement about what defines an entre-preneur. Terms such as risk taker, cre-ative, innovcre-ative, and motivated were used. This confirmed that using the exist-ing EO scales would capture the salient dimensions. Many focus groups mem-bers did not describe themselves as entrepreneurs however. Several noted that they started their businesses because it fit with their family schedule (e.g., children, school, spouse’s job). A few stated that their business existed because they saw a need for the product/service in the downtown area and took it upon themselves to “do the job.” These busi-ness owners were not talking about “seeing a need and filling it to make a profit.” Rather, they referred more to what they saw as their role in the com-munity: to operate a needed business even if the profit potential was not that great. Overall, it became clear from these focus groups that existing EO scales would suffice, but that SBO scales needed development.
Measurement of EO and SBO
risk taking (see Table 1). Covin and Slevin (1989) factor analyzed the nine items and found a distinct unidimen-sional EO with composite reliability of 0.87. The mean rating on the items is often used as the total EO score: the higher the score, the more entrepreneur-ially oriented the owner is considered to be.
To date, no one has reported the cre-ation of a separate SBO scale for small business owners (as opposed to SBO as the inverse of EO). So based on the work of Stewart and Roth (2001) and Carland et al. (1984) and on the findings from the focus group research, measures were created for the SBO of business owners. From Carland et al. (1984), purposes and goals of the small business owner were measured using five separate state-ments; and from the focus group research, emotional attachment to the business was measured using four sepa-rate statements (Table 1). Measurement scales were seven-point Likert scales, with 1=strongly disagree and 7=
strongly agree. The mean rating on the items can be used as the small business owner’s overall SBO score. The higher the respondent scored, the greater their SBO.
These SBO scales were pretested with 29 small business owners, all of whom fit the profile of those who would be sur-veyed in the full study. The results of the pretest were positive, with all scale reli-abilities acceptable. Results of the CFA of the current study’s sample are presented later in the Results section.
Measurement of Performance
Small business performance was mea-sured using three indicators, adapted from Niehm (2002) and Frazier (2000). Respondents described the overall per-formance of their firm (1) compared to last year; (2) compared to major competi-tors; and (3) compared to other similar firms in the industry. Because focus group members reported going to
neigh-boring downtowns to “shop the com-petition,” it is not surprising that respondents seemed able to expertly compare their own firms with other firms (no respondent had difficulty answering these questions). The items were measured on seven-point seman-tic differential scales, anchored “poor” to “excellent.” The construct reliability was 0.87.
These business performance measures are subjective measures and have one great advantage over objective financial performance measures: more respon-dents answer the subjective questions. Typically, one-third to one-half of a sample will give answers to subjective measures on seven-point scales, but not to objective measures. For example, in Droge, Jayaram, and Vickery (2004), 28 of 57 first-tier auto suppliers provided both types of performance measures only after multiple callbacks. Item non-response was important in the current research because small businesses are known for their reluctance to divulge financial information. Furthermore, non-response on performance items can lead to a propensity for nonresponse on the entire questionnaire. The key question is of course whether subjective data are in substantive concordance with objective data. Overall, concordance is high: studies suggest that subjective assess-ments of performance can accurately reflect objective internal measures such as revenue and profit (see reviews by Dess and Robinson 1984; Venkatraman and Ramanujam 1986). For example, in their research comparing archival infor-mation with owner assessment of sales growth and earnings, Chandler and Hanks (1994) found the two measures highly correlated. Similarly, Droge, Jayaram, and Vickery (2004) found sig-nificant correlations (most at p<.001)
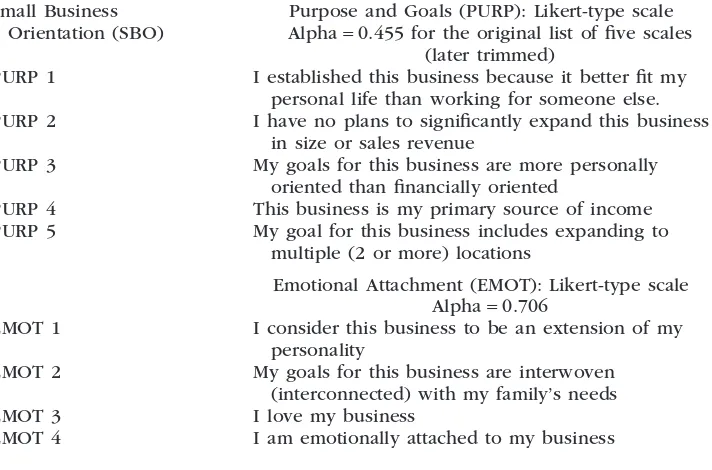
Table 1
Measurement Scales: Entrepreneurial Orientation and
Small Business Orientation
Latent Factor Measurement Items and Scale Alphas
Entrepreneurial Orientation (EO)
Innovativeness (INNOV): Bi-polar Statements Alpha=0.606
INNOV 1 Favor a strong emphasis on the marketing of tried and true products or services
OR A strong emphasis on R&D, technological leadership and innovation INNOV 2 Has introduced no new lines
of products or services
OR Very many new lines of products or services INNOV 3 Changes in product or
service lines have been mostly of a minor nature
OR Changes in product or service lines have been quite dramatic
Proactiveness (PROAC): Bi-polar Statements Alpha=0.576
PROAC 1 Typically responds to actions which competitors initiate
OR Typically initiates actions which competitors then respond to
PROAC 2 Is seldom the first business to introduce new
products/services,
administrative techniques, operating technologies, etc.
OR Is very often the first to introduce new products/ services, administrative techniques, operating, technologies, etc.
PROAC 3 Typically seeks to avoid competitive clashes, preferring a
“live-and-let-live” posture
OR Typically adopts a very competitive,
“undo-the-competitors” posture
Risk Taking (RISK): Bi-polar Statements Alpha=0.608
RISK 1 Strongly favor low-risk projects (with normal and certain rates of return)
OR Strongly favor high risk projects (with chances of very high return) RISK 2 Believe that owing to the
nature of the environment, it is best to explore gradually via timid, incremental behavior
OR Believe that owing to the nature of the
environment, bold, wide-ranging acts are necessary to achieve my firm’s objectives
RISK 3 Typically adopt a cautious, “wait-and-see” posture in order to minimize the probability of making costly decisions
Sampling Procedure
The sampling frame of our study was restricted to small/medium sized, nonur-ban rural communities. The towns included in this sample fit the nonurban rural criteria used by the U.S. Census (U.S. Census Factfinder 2004): that is, populations of 2,500 to 30,000 and located more than 30 miles from a met-ropolitan statistical area. With the growth of chains, malls, and large discounters in metropolitan areas, it is likely that most communities of this small size will have a restricted variety of shopping and enter-tainment choices outside of the down-town area (Gorodesky and McCarron 2003; Levy and Weitz 2003).
All downtowns in one Midwestern state that fit our prescribed profile were identified. The same steps were followed as with the focus group, including e-mailing Chambers of Commerce to
obtain the DDA director’s e-mail addresses. A total of 14 downtowns agreed to participate in our study, but only 11 actually followed through. Three communities were tourist-dependent communities and eight were not. Although previous studies in this research area have excluded chain or franchise stores (Frazier 2000), any small business that existed within a downtown district was included.
Several of Dillman’s (2000) sugges-tions for increasing response rates were adapted to this study. The first was prenotification. The second was offering an incentive. Following agreement of the DDA director to participate, the director became a research project “champion.” This entailed announcing the study to downtown business owners (prenotification) and requesting their participation, as well as supporting the
Table 1
Continued
Small Business Orientation (SBO)
Purpose and Goals (PURP): Likert-type scale Alpha=0.455 for the original list of five scales
(later trimmed)
PURP 1 I established this business because it better fit my personal life than working for someone else. PURP 2 I have no plans to significantly expand this business
in size or sales revenue
PURP 3 My goals for this business are more personally oriented than financially oriented
PURP 4 This business is my primary source of income PURP 5 My goal for this business includes expanding to
multiple (2 or more) locations
Emotional Attachment (EMOT): Likert-type scale Alpha=0.706
EMOT 1 I consider this business to be an extension of my personality
EMOT 2 My goals for this business are interwoven (interconnected) with my family’s needs EMOT 3 I love my business
research as important to the downtown (incentive). The director also set a date for distribution and a date for picking up the completed survey.
The DDA director was instructed to denote the stores in the traditional CBD. In each town, business owners who had not completed the survey by the assigned day were given the option of completing while pickup continued (allowing for one to two hours additional time), or dropping off their survey later to the DDA director’s office. All surveys were disseminated and collected over a three-week period. A total of 1,108 surveys were disseminated and 272 were returned, for an initial response rate of 24.5 percent. Of the 272, five were deemed unusable however, making the final response rate 24.1 percent. This is a respectable response rate, considering what is normally achieved in studies of small businesses (e.g., Conant and White 1999 at 13.1 percent; Frazier 2000 at 12.1 percent).
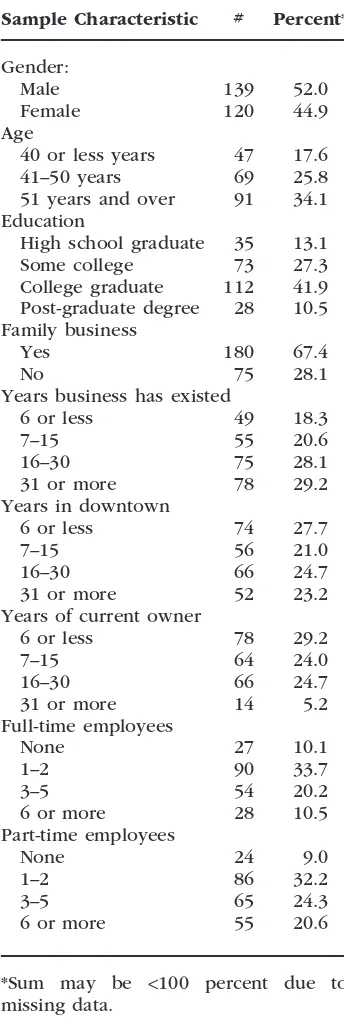
Sample Description
The final sample consisted of 267 owners of small businesses within the CBD of downtowns in 11 Midwestern communities. The populations of these communities ranged from 2,972 to 25,496. In the sample, 78 percent of busi-nesses had been in existence for seven or more years, with 69 percent reporting that their business had been downtown for more than seven years. In general, the firms fit the profiles of small busi-nesses as measured by the number of full and part-time employees: 44 percent reported having two or fewer full-time employees (including themselves) and over 65 percent reported five or fewer part-time employees. Sample characteris-tics are in Table 2.
Analyses
SEM with LISREL 8.72 tested the fit of the measurement, structural, and
Table 2
Sample Characteristics
Sample Characteristic # Percent*
Gender:
Male 139 52.0
Female 120 44.9 Age
40 or less years 47 17.6 41–50 years 69 25.8 51 years and over 91 34.1 Education
High school graduate 35 13.1 Some college 73 27.3 College graduate 112 41.9 Post-graduate degree 28 10.5 Family business
Yes 180 67.4
No 75 28.1
Years business has existed
6 or less 49 18.3
7–15 55 20.6
16–30 75 28.1
31 or more 78 29.2 Years in downtown
6 or less 74 27.7
7–15 56 21.0
16–30 66 24.7
31 or more 52 23.2 Years of current owner
6 or less 78 29.2
7–15 64 24.0
16–30 66 24.7
31 or more 14 5.2 Full-time employees
None 27 10.1
1–2 90 33.7
3–5 54 20.2
6 or more 28 10.5 Part-time employees
None 24 9.0
1–2 86 32.2
3–5 65 24.3
6 or more 55 20.6
*Sum may be <100 percent due to
moderation models using maximum like-lihood (ML) estimation. ML was chosen based on the normal distribution of the data, sample size, and measure-ment using interval-level scales (Schermelleh-Engel, Moosbrugger, and Muller 2003). The standard two-step process was used, where CFA were conducted before testing the structural and moderation models (Anderson and Gerbing 1988).
Model fit was assessed using several methods. We assessed the c2 statistic,
which evaluates the difference between the specified model’s covariance ture and the observed covariance struc-ture (Bollen 1989). We reviewed the standardized residual matrices to identify large residuals (positive or negative) that contributed most to poor fit. Modification indices based on Lagrangian multiplier (LM) tests were used to identify param-eters not specified, which if specified
would contribute to better model fit. However, modifications contrary to theory or logic were not made.
Several other statistics were used to assess fit. These included root mean square error of approximation (RMSEA), comparative fit index (CFI), and adjusted goodness of fit (AGFI). These indices adjust for model complexity (Kline 1998; Bollen 1989), as the c2 statistic is
sensi-tive to model complexity. We used the following cutoff criteria: (1) for “accept-able” model fit: RMSEA<0.08; AGFI >0.90; CFI>0.90; and (2) for “good”
model fit: RMSEA<0.06; AGFI>0.90;
CFI>0.95. These criteria are generally
accepted (Hu and Bentler 1999; Kline 1998; Bollen 1989; Bagozzi and Yi 1988).
Measurement Model
Results (H1): CFA
We first evaluated EO and SBO sepa-rately, and then evaluated them together. EO encompassed innovativeness (INNOV 1,2,3), proactiveness (PROAC 1,2,3), and risk taking (RISK 1,2,3). All
nine measurement variables were loaded directly on the EO construct (see Figure 1). Results of the CFA were
c2=41.10, df=22, p=.008; RMSEA=
0.057; AGFI=0.93; CFI=0.98. All parameter estimates were significant at the p<.05 level, indicating convergent
validity. The composite reliability for EO was 0.75. H1a is thus supported.
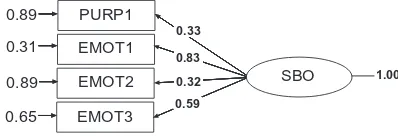
Next, SBO encompasses purpose and goals (PURP, five measures) and emo-tional attachment (EMOT, four mea-sures). Our initial confirmatory factor analysis had fit indices outside of accept-able limits, as there were high residuals among several of the PURP measures and several variables cross-loaded. After examining these results as well as reviewing the wording of the measures, we decided to use PURP1 and EMOT 1, 2, and 3. The CFA was respecified with four manifest variables (see Figure 2). The fit improved to an acceptable level (c2=1.68, df=2, p=.431; RMSEA
<
0.001; AGFI=0.98; CFI<0.99). The
com-posite reliability was 0.61. Although our model as initially specified did not fit well, model trimming yielded an accept-able measurement model for SBO. We thus find support for H1b.
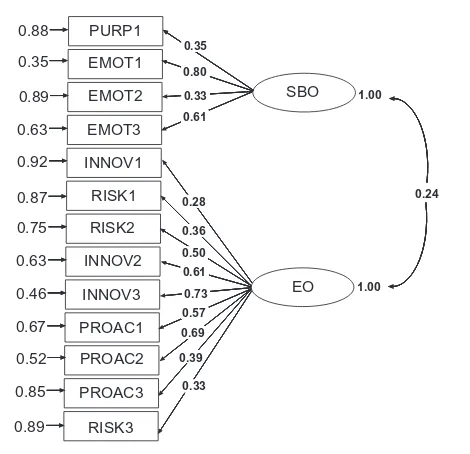
Next, we fit the full measurement model. The model was specified utilizing the measures for EO and SBO, respec-tively. The initial model exhibited poor fit, requiring review of the standardized residuals. Based on LM tests, several of the measurement errors in the EO con-struct were allowed to freely covary. The respecified model exhibited good fit (c2=89.79, df=59, p=.006; RMSEA=
0.044; AGFI=0.92; CFI=0.97). EO and SBO were only moderately correlated (R2=0.24) demonstrating discriminant
Figure 1
Entrepreneurial Orientation Confirmatory Factor Analysis
INNOV1
RISK1
RISK2
INNOV2
INNOV3
PROAC1
PROAC2
PROAC3
RISK3
EO 0.93
0.89
0.79
0.50
0.30
0.77
0.61
0.86
0.88
0.26
0.32
0.46 0.71
0.84 0.48 0.62 0.37
0.32
Chi-Square=41.10, df=22, P-value=0.00802, RMSEA=0.057
1.00
Confirmatory factor analysis, including parameter estimates (factor loadings). All indicators load significantly upon the latent construct.
Figure 2
Small Business Orientation Confirmatory Factor Analysis
Chi-Square=1.68, df=2, P-value=0.43124, RMSEA=0.000
PURP1
EMOT1
EMOT2
EMOT3 0.31
0.89
0.89
0.65
0.33
0.83
0.32 0.59
SBO 1.00
SEM Results for the
Structural and
Moderation Models
(H2 and H3)
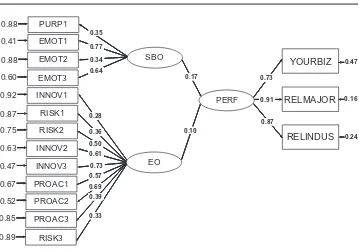
Following the finalization of the mea-surement model, we fit the data to a structural model in order to test our structural and moderation hypotheses. First, we examined the full model with no moderation: the result was good fit with c2=146.12, df=96, p=.001;
RMSEA=0.044; AGFI=0.91; CFI=0.96 (see Figure 4). The standardized param-eter estimate for SBO as a predictor of small business performance was
signifi-cant (G =0.17;t=2.08;p<.05), with an
effect size of 0.412. However, EO was not found to be a significant predictor of performance. Therefore, when no mod-eration is modeled, H2b is supported while H2a is not supported. Appendix 2 provides the parameter estimates and
t-values for this structural model. Next, we accounted for moderation by longevity by specifying two-group nested SEM models (i.e., the standard method of testing moderation). We mea-sured longevity by the years the current owner had owned the business. Two groups were formed, split approximately on the median: (1) YOUNG was below 11 years (n=122); and (2) OLD was 11+
Figure 3
Measurement Model: Entrepreneurial Orientation and
Small Business Orientation
PURP1
EMOT1
EMOT2
EMOT3
INNOV1
RISK1
RISK2
INNOV2
INNOV3
PROAC1
PROAC2
PROAC3
RISK3
SBO
EO 0.35
0.88
0.89
0.63
0.92
0.87
0.75
0.63
0.46
0.67
0.52
0.85
0.89
0.35
0.80
0.33 0.61
1.00
1.00 0.28
0.36 0.50 0.61 0.73 0.57 0.69
0.39
0.33
Chi-Square=89.79, df=59, P-value=0.00601, RMSEA=0.044
0.24
years (n=155). Measurement loadings were specified invariant across groups. Two models, one nested in the other, were run: (1) first, each of the SBO-performance and EO-SBO-performance paths was specified equal across groups and (2) second, these paths were freed in each group. The difference in c2 was 7.15, df=2 (significant atp<.05), and
conse-quently we concluded that the better model has the SBO-performance and EO-performance paths estimated sepa-rately in OLD versus YOUNG groups.
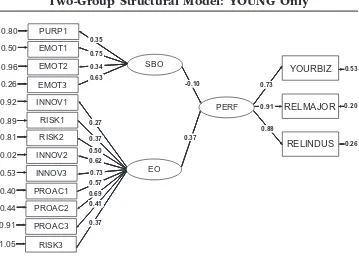
For the OLD group, SBO was a posi-tive and significant predictor of firm per-formance, while EO was not significant (see Figure 5). For the YOUNG group on the other hand, EO was a significant and
positive predictor of firm performance while SBO was not significant (Figure 6). H3 is supported, because longevity of ownership is a moderating variable. Inclusion of longevity reveals that the construct impacting small firm perfor-mance depends on length of ownership: in the “younger” group, performance is driven by an EO while in the “older” group it is driven by a SBO. Thus in the two-group model, the support for H2a and H2b depends on whether the OLD versus YOUNG group is being examined.
Discussion
Cooper (1993) noted that the theoreti-cal frameworks for analyzing influences upon firm performance are not well
Figure 4
Structural Model (No Moderation)
PURP1
EMOT1
EMOT2
EMOT3
INNOV1
RISK1
RISK2
INNOV2
INNOV3
PROAC1
PROAC2
PROAC3
RISK3
YOURBIZ
RELMAJOR
RELINDUS
PERF SBO
EO 0.41
0.88
0.88
0.60
0.92
0.87
0.75
0.63
0.47
0.67
0.52
0.85
0.89
0.35
0.77
0.34 0.64
0.17
0.10 0.28
0.36
0.50 0.61
0.73 0.57 0.69 0.39
0.33
0.87 0.91 0.73
0.47
0.16
0.24
Chi-Square=146.12, df=96, P-value=0.00075, RMSEA=0.044
developed and have too frequently examined only entrepreneurial charac-teristics of proactiveness, risk taking, and innovativeness. There was a research need to examine factors influencing firm performance from a SBO view, thus advancing the resource-based theory beyond EO only. SBO is a relatively idio-syncratic resource and as such may provide a strong source of competitive advantage, as noted by Lado and Wilson (1994). Comparing the impact of SBO with that of EO requires however that independent measurement models must be specified for SBO and EO (i.e., SBO
cannot be an exact linear inverse func-tion of EO).
Measurement Models
In order to further the SBO theory suggested by Carland et al. (1984), a scale was developed and designed to measure SBO uniquely anddistinctfrom EO. The developed scale items were taken from entrepreneurial research, rather than personality research. Follow-ing conceptualization of nine SBO mea-sures (five items to measure purposes/ goals and four items to measure emotional attachment), we tested and
Figure 5
Two-Group Structural Model: OLD Only
PURP1
EMOT1
EMOT2
EMOT3
INNOV1
RISK1
RISK2
INNOV2
INNOV3
PROAC1
PROAC2
PROAC3
RISK3
YOURBIZ
RELMAJOR
RELINDUS
PERF SBO
EO 0.50
0.80
0.96
0.26
0.92
0.89
0.81
0.02
0.53
0.40
0.44
0.91
1.05
0.35
0.75
0.34 0.63
0.24
-0.05 0.27
0.37
0.50 0.62
0.73 0.57 0.69 0.41
0.37
0.88 0.91 0.73
0.53
0.20
0.26
Chi-Square=304.53, df=205, P-value=0.00001, RMSEA=0.061
trimmed the measurement model. We then compared the effects of EO and SBO on firm performance. By doing so, the current study continues the system-atic approach to extending a research stream called for in the literature (Hunt and Derozier 2004; MacKenzie 2003; Summers 2001; Varadarajan 1996).
The factors of innovativeness, risk taking, and proactiveness were found to be indicators of EO, confirming in the current sample, results found in previ-ous research. Thus we were able to, with confidence, test a proprietary scale to measure the existence of SBO. Although the original nine-item SBO scale did not
perform well as a whole, we were able to operationalize a four-item scale that exhibited acceptable reliability and included measures of both emotional attachment and personal goals (as pro-posed conceptually for SBO; Stewart et al. 2003, 1998; Stewart and Roth 2001; Carland et al. 1995, 1988, 1984). This is an important extension of small busi-ness and entrepreneurship research as it is a first step in devising and opera-tionalizing domain-specific SBO scales that measure SBO as a construct distinct from EO. We tested and confirmed that SBO and EO are indeed separate and distinct small business strategies (i.e.,
Figure 6
Two-Group Structural Model: YOUNG Only
PURP1
EMOT1
EMOT2
EMOT3
INNOV1
RISK1
RISK2
INNOV2
INNOV3
PROAC1
PROAC2
PROAC3
RISK3
YOURBIZ
RELMAJOR
RELINDUS
PERF SBO
EO 0.50
0.80
0.96
0.26
0.92
0.89
0.81
0.02
0.53
0.40
0.44
0.91
1.05
0.35
0.75
0.34 0.63
-0.10
0.37 0.27
0.37
0.50 0.62
0.73 0.57 0.69 0.41
0.37
0.88 0.91 0.73
0.53
0.20
0.26
Chi-Square=304.53, df=205, P-value=0.00001, RMSEA=0.061
the CFA demonstrated discriminant validity). This is an important contribu-tion because the existence of SBO as a separate construct had been posited by researchers (Carland et al. 1984), but past research had assumed SBO to be a “lack of” EO (i.e., an inverse relationship by definition and measurement; Stewart and Roth 2001; Stewart et al. 1998). Because we developed a separate SBO construct, we were now able to com-pare the effects of SBO versus EO on performance.
The Impact of SBO versus EO on Performance: Structural and Moderation Models
While the literature suggests that EO is a significant factor influencing firm performance, no work had been done either on the effect of SBO on firm per-formance or in comparing the effects of SBO versus EO. Our findings from a sample of 267 small businesses were consistent with the work of Jenkins and Johnson (1997): SBO can lead to improvement in firm performance. Indeed, SBO’s impact on firm perfor-mance outweighed the influence of EO (which was not significant) in the origi-nal unmoderated structural model. This finding was not anticipated based on the extant literature supporting EO as strongly influencing positive firm perfor-mance (Wiklund and Shepherd 2005; Covin and Slevin 1989). However, not accounted for in this first structural model using the full sample is longevity of current ownership.
Previous work suggested that perfor-mance factors may be a function of small business longevity (Wenthe, Freden-berger, and DeThomas 1988). It is common knowledge that small firms are susceptible to failure in the early years of operation. We hypothesized that perhaps EO and SBO are differentially impactful with the passage of time; that is, longev-ity might be a moderating factor in firm performance determinants. We had 122
owners who had been in business less than 11 years and 155 who had been in business 11 or more years (i.e., the median cutoff was after the 10th year). There were significant differences in the impact of SBO and EO on firm perfor-mance in this two-group analysis: for the younger group,onlyEO was a significant predictor of performance, while for owners in business for 11 or more years,
only SBO was significant. This finding suggests that with continuance, the more emotionally attached to the business and the more devoted to balance work and family life, the more successful the owner. This may be a natural transition for many business owners. The younger small businesses continue to rely on the strength of the owner’s EO for positive performance. This is a new and impor-tant finding in entrepreneurial research, as no one had yet investigated the impact of owner orientation on performance over time.
Future Research Directions
Further refinement of SBO measures is called for, as this was a first attempt to create and operationalize such a scale. The ability to differentiate between a small firm owner’s resource strategies is an important research goal. Replication of entrepreneurial and SBOs will enable theorists to understand more accurately the firms that will most likely succeed and those that may not succeed.
In one possible scenario, a pattern of EO, SBO, EO, SBO (and so on) could be closely related to optimal performance because of punctuated equilibrium of the marketplace. For example, a stable com-petitive marketplace in equilibrium may mean that high SBO maximizes perfor-mance; but then equilibrium is disturbed (or punctuated) by the appearance of a new direct competitor and this requires more of an entrepreneurial response for performance maximization. This view would be supported in Covin and Slevin’s (1989) work. Another possible distinct pattern is EO, SBO, EO triads, where the SBO–EO transition records the retirement of the owner and the succes-sion (Costa 1994). Such a connection may be important as owners make suc-cession plans (Costa 1994).
Finally, our investigation was limited to small firms located in downtown busi-ness districts. Busibusi-ness characteristics may differ between downtown firms and firms located outside of the downtown area. Thus it is possible that our findings on SBO and EO may not be generalize-able to all small businesses. It would be beneficial to replicate this study with small nondowntown businesses in other geographic regions of the country, and in downtowns within more racially and ethnically diverse communities.
References
Anderson, J. C., and D. W. Gerbing (1988). “Some Methods for Respecify-ing Measurement Models to Obtain Uni-Dimensional Construct Measure-ment,”Journal of Marketing Research
19, 453–460.
Bagozzi, R., and Y. Yi (1988). “On the Evaluation of Structural Equation Models,” Journal of the Academy of Marketing Science16, 74–97.
Baird, I., and H. Thomas (1985). “Toward a Contingency Model of Stra-tegic Risk Taking,”Academy of Man-agement Review10, 320–343.
Bateman, T. S., H. O’Neill, and A. Kenworthy-U’Ren (2002). “A Hierar-chical Taxonomy of Top Managers’ Goals,”Journal of Applied Psychology
87(6), 1134–1148.
Bollen, K. A. (1989). Structural Equa-tions with Latent Variables. New York: John Wiley & Sons.
Brush, C. G., and R. Chaganti (1998). “Business without Glamour? An Analysis of Resources of Performance by Size and Age in Small Service and Retail Firms,” Journal of Business Venturing14, 233–257.
Carland, J. W., F. Hoy, W. R. Boulton, and J. C. Carland (1984). “Differenti-ating Entrepreneurs from Small Busi-ness Owners: A Conceptualization,”
Academy of Management Review9(2), 354–359.
Carland, J. W., J. C. Carland, F. Hoy, and W. R. Boulton (1988). “Distinctions between Entrepreneurial and Small Business Ventures,” International Journal of Management5(1), 98–103. Carland, J. W. III, J. W. Carland, J. C. Carland, and J. W. Pearce (1995). “Risk Taking Propensity among Entre-preneurs, Small Business Owners and Managers,” Journal of Business and Entrepreneurship 7, 15–23.
Chandler, G., and S. H. Hanks (1994). “Market Attractiveness, Resource Capabilities, Venture Strategies, and Venture Performance,” Journal of Business Venturing9, 331–349. Conant, J. S., and C. White (1999).
“Mar-keting Program Planning, Process Benefits and Store Performance: An Initial Study among Small Retail Firms,” Journal of Retailing 75(4), 525–541.
Cooper, A. C. (1993). “Challenges in Predicting New Firm Performance,”
Journal of Business Venturing8, 241– 253.
Costa, S. S. (1994). “100 Years and Counting,” Management Review
83(12), 32–34.
Covin, J. G., and D. P. Slevin (1989). “Strategic Management of Small Firms in Hostile and Benign Environments,”
Strategic Management Journal 10(1), 57–75.
Davidsson, P. (1989). “Entrepreneurship-and After? A Study of Growth Willing-ness in Small Firms,” Journal of Business Venturing4(3), 211–226. Dess, G., and R. B. Robinson (1984).
“Measuring Organizational Perfor-mance in the Absence of Objective Measures: The Case of the Privately-Held Firm and Conglomerate Business Units,”Strategic Management Journal
5(3), 265–273.
Dillman, D. (2000).Mail and Telephone Surveys: The Tailored Design Method, 2nd ed. New York, NY: John Wiley and Sons.
Droge, C., J. Jayaram, and S. K. Vickery (2004). “The Effects of Internal versus External Integration Practices on Time-Based Performance and Overall Performance,” Journal of Operations Management 22, 557–573.
Etzioni, A. (1975).A Comparative Analy-sis of Complex Organizations, (revised ed.). New York: Free Press.
Filley, A. C., and R. J. Aldag (1978). “Characteristics and Measurement of an Organizational Typology,”
Academy of Management Journal21, 578–591.
Fischer, E. M., A. R. Reuber, and L. S. Dyke (1993). “A Theoretical Overview and Extension of Research on Sex, Gender, and Entrepreneurship,” Jour-nal of Business Venturing8, 151–168. Frazier, B. (2000). “The Influence of Network Characteristics on Informa-tion Access, Marketing Competence, and Perceptions of Performance in Small, Rural Businesses,” Unpub-lished doctoral dissertation, Michigan State University, East Lansing, Michigan.
Galbraith, C. S., and D. Schendel (1983). “An Empirical Analysis of Strategy Types,” Strategic Management Journal4(2), 153–173.
Gasse, Y. (1982). “Elaborations on the Psychology of the Entrepreneur,” in
Encyclopedia of Entrepreneurship. Eds. C. A. Kent, D. L. Sexton, and K. H. Vesper. Englewood Cliffs, NJ: Prentice Hall, 209–223.
Georgopoulos, B. S., and A. S. Tannen-baum (1957). “A Study of Organiza-tional Effectiveness,” American Sociological Review 22, 534– 540.
Gorodesky, R., and E. McCarron (2003). “Independent Restaurant Survival in a Mega-chain World, Restaurant Report.” http://www.restaurantreport. com/features/ft_megashain.html (ac-cessed November 10, 2006).
Hall, R. H., and J. P. Clark (1980). “An Ineffective Effectiveness Study and Some Suggestions for Future Research,” Sociological Quarterly
21(1), 119–134.
Hu, L. T., and P. M. Bentler (1999). “Cutoff Criteria for Fit Indexes in Covariance Structure Analysis: Con-ventional Criteria versus New Alterna-tives,” Structural Equation Modeling
6(1), 1–55.
Hunt, S. D., and C. Derozier (2004). “The Normative Imperatives of Business and Marketing Strategy: Grounding Strategy in Resource-Advantage Theory,” Journal of Business and Industrial Marketing 19(1), 5– 22.
Jenkins, M., and G. Johnson (1997). “Entrepreneurial Intentions and Outcomes: A Comparative Causal Mapping Study,” Journal of Manage-ment Studies34(6), 895–920.
Johnson, B. (1990). “Toward a Multi-dimensional Model of Entrepreneur-ship: The Case of Achievement Motivation and the Entrepreneur,”
Entrepreneurship Theory and Practice
Kline, R. B. (1998).Principles and Prac-tices of Structural Equation Modeling. New York: Guilford Press.
Lado, A., and M. C. Wilson (1994). “Human Resource Systems and Sus-tained Competitive Advantage: A Com-petency Based Perspective,”Academy of Management Review 19(4), 600– 727.
Levy, M., and B. W. Weitz (2003). Retail-ing Management. New York: McGraw-Hill Irwin.
Lumpkin, G. T., and G. Dess (1996). “Clarifying the Entrepreneurial Orientation Construct and Linking it to Performance,” The Academy of Management Review21(1), 35–172. Lumpkin, G. T., and G. G. Dess (2001).
“Linking Two Dimensions of Entre-preneurial Orientation to Firm Perfor-mance: The Moderating Role of Environment and Industry Life Cycle,”
Journal of Business Venturing 16, 429–451.
MacKenzie, S. B. (2003). “The Dangers of Poor Construct Conceptualization,”
Journal of the Academy of Marketing Science31(3), 323–326.
McDaniel, C., and R. Gates (2001). Mar-keting Research Essentials, 3rd ed. Cincinnati, OH: South-Western Publishing.
Miles, M. P., J. G. Covin, and M. B. Heeley (2000). “The Relationship between Environmental Dynamism and Small Firm Structure, Strategy, and Performance,”Journal of Market-ing Theory and Practice8(2), 63–74. Miller, D. (1983). “The Correlates of
Entrepreneurship in Three Types of Firms,”Management Science29, 770– 791.
Miller, D., and P. Friesen (1982). “Arche-types of Strategy Formulation,” Man-agement Science24, 921–933. Naffziger, D. W., J. S. Hornsby, and
D. F. Kuratko (1994). “A Proposed Research Model of Entrepreneurial Motivation,” Entrepreneurship Theory and Practice18(3), 29–42.
Niehm, L. S. (2002). “Retail Superpre-neurs and their Influence on Small Communities,” Unpublished doctoral dissertation, Michigan State Univer-sity, East Lansing, MI.
Schermelleh-Engel, K., H. Moosbrugger, and H. Muller (2003). Methods of Psychological Research Online 8(2), 23–74.http://www.mpr-online.de (accessed October 15, 2006).
Schumpeter, J. (1934). “The Theory of Economic Development,” Public Opinion Quarterly58, 358–480. Steers, R. M. (1975). “Problems in the
Measurement of Organizational Effec-tiveness,” Administrative Science Quarterly20, 546–558.
Stewart, W. H., and P. L. Roth (2001). “Risk Propensity Differences between Entrepreneurs and Managers: A Meta-Analytic Review,” Journal of Applied Psychology 86(1), 145– 153.
Stewart, W. H., W. E. Watson, J. C. Carland, and J. W. Carland (1998). “A Proclivity for Entrepreneurship: A Comparison of Entrepreneurs, Small Business Owners, and Corporate Man-agers,”Journal of Business Venturing
14, 189–214.
Stewart, W. H., J. C. Carland, J. W. Carland, W. E. Watson, and R. Sweo (2003). “Entrepreneurial Dispositions and Goal Orientations: A Comparative Exploration of United States and Russian Entrepreneurs,” Journal of Small Business Management 41(1), 27–46.
Summers, J. O. (2001). “Guidelines for Conducting Research and Publishing in Marketing: From Conceptualization through the Review Process,”Journal of the Academy of Marketing Science
29(4), 405–415.
Timmons, J. (1990). New Venture Cre-ation Entrepreneurship in the 1990’s, (3rd ed). Boston, MA: Irwin.
Varadarajan, P. R. (1996). “From the Editor: Reflections on Research and Publishing,” Journal of Marketing
60(October), 3–6.
Venkatraman, N., and V. Ramanujam (1986). “Measurement of Business Per-formance in Strategy Research: A Com-parison of Approaches,” Academy of Management Review1(4), 801–809. Vesper, K. H. (1980).New Venture
Strat-egies. Englewood Cliffs, NJ: Prentice-Hall.
Wenthe, J. F., W. C. Fredenberger, and A. R. DeThomas (1988). “Some Empirical
Evidence on Store-Tenant Mortality Rates in Large Regional Shopping Centers,” Southwest Journal of Busi-ness and Economics 6(1), 26–42. Wiklund, J., and D. Shepherd (2005).
“Entrepreneurial Orientation and Small Business Performance: A Con-figurational Approach,” Journal of Business Venturing20, 71–91. Woo, C. Y., A. C. Cooper, and W. C.
Dunkelberg (1986). “The Develop-ment and Interpretation of Entrepre-neurial Typologies,” Journal of Business Venturing6(2), 93–115.
Appendix 1. Parameter Estimates for Measurement
Model
Path Label Parameter
Estimate
t-value*
p<.05
Standardized Estimate
PURP1, SBO 0.51 4.86* 0.32
EMOT1, SBO 1.12 9.49* 0.76
EMOT2, SBO 0.57 4.71* 0.40
EMOT3, SBO 0.70 7.98* 0.56
INNOV1, EO 0.44 4.04* 0.26
RISK1, EO 0.46 5.34* 0.33
RISK2, EO 0.62 7.62* 0.47
INNOV2, EO 1.00 9.22* 0.70
INNOV3, EO 1.09 11.73* 0.81
PROAC1, EO 0.74 8.94* 0.52
PROAC2, EO 0.97 11.08* 0.65
PROAC3, EO 0.58 5.80* 0.40
RISK3, EO 0.41 4.85* 0.36
SBO, EO 0.23 3.10* —
c2=89.79,df=59,n=267,p=.006, RMSEA=0.044, AGFI=0.92
Appendix 2. Parameter Estimates for Unmoderated
Structural Model
Path Label Parameter
Estimate
t-value*
p<.05
Standardized Estimate
PURP1, SBO 0.48 4.33* 0.35
EMOT1, SBO 1.00 — 0.77
EMOT2, SBO 0.54 4.23* 0.34
EMOT3, SBO 0.68 5.72* 0.64
INNOV1, EO 1.00 — 0.28
RISK1, EO 1.04 3.78* 0.36
RISK2, EO 1.41 3.70* 0.50
INNOV2, EO 2.25 3.84* 0.61
INNOV3, EO 2.45 3.97* 0.73
PROAC1, EO 1.66 3.83* 0.57
PROAC2, EO 2.19 3.95* 0.69
PROAC3, EO 1.31 3.43* 0.39
RISK3, EO 0.92 3.18* 0.33
SBO, PERF 0.15 2.08* 0.17
EO, PERF 0.22 1.25 0.10
YOURBIZ, PERF 1.00 — 0.73
RELMAJOR, PERF 1.13 13.74* 0.91 RELINDUS, PERF 1.06 13.65* 0.87
c2=146.12,df=96, n=267,p=.0007, RMSEA=0.044, AGFI=0.91.