Ž .
Journal of Health Economics 19 2000 1117–1137
www.elsevier.nlrlocatereconbase
The effect of tobacco advertising bans on
tobacco consumption
Henry Saffer
), Frank Chaloupka
National Bureau of Economic Research, 365 Fifth AÕenue, New York, NY 10016 USA
Received 1 November 1999; received in revised form 1 April 2000; accepted 18 April 2000
Abstract
Tobacco advertising is a public health issue if these activities increase smoking. Although public health advocates assert that tobacco advertising does increase smoking, there is significant empirical literature that finds little or no effect of tobacco advertising. In this paper, these prior studies are examined more closely with several important insights emerging from this analysis. This paper also provides new empirical evidence on the effect of tobacco advertising in 22 Organization for Economic Cooperation and Development
ŽOECD countries. The primary conclusion of this research is that a comprehensive set of.
tobacco advertising bans can reduce tobacco consumption and that a limited set of advertising bans will have little or no effect. q2000 Elsevier Science B.V. All rights reserved.
Keywords: Tobacco advertising; Advertising ban; Tobacco consumption
1. Introduction
The evidence implicating smoking in the deaths of millions of people is
Ž .
substantial and well documented. The Office on Smoking and Health 1994 estimates that in the US there are over 400,000 premature deaths per year due to
Ž .
smoking. Peto et al. 1994 estimate that in developed countries there are about 2 million premature deaths per year due to smoking. These include death from
)Corresponding author. Tel.:q1-212-817-7956; fax:q1-212-817-1597.
Ž .
E-mail address: [email protected] H. Saffer .
0167-6296r00r$ - see front matterq2000 Elsevier Science B.V. All rights reserved.
Ž .
cancer, heart disease, strokes, and other causes. Smoking is also responsible for a considerable amount of illness including chronic lung disease and low birth weight.
Tobacco advertising is a public health issue if it increases smoking. Although
Ž .
public health advocates for example Roemer, 1993 claim that tobacco advertising does increase smoking, there is a significant empirical literature that finds little or
Ž .
no effect of tobacco advertising on smoking for example Hoek, 1999 . This empirical literature on advertising provides the basis for the tobacco industry claim that its advertising only affects market share among various competing brands. In this paper, the methodologies used in prior studies of tobacco advertising are examined more closely and new empirical evidence on the effect of advertising bans on tobacco consumption is presented.
2. Advertising and consumption
Advertising is an important method of competition in industries that are highly concentrated, such as the cigarette industry. Firms in industries of this type tend not to compete by price, but try to increase sales with advertising and other marketing techniques. Since a number of prior studies have found little relation-ship between advertising and tobacco consumption, it is important to examine this literature before proceeding with a new empirical study. Economic theory provides some insights into how econometric studies of tobacco advertising should be conducted. An important economic aspect of advertising is diminishing marginal product.1 Diminishing marginal product suggests that, after some point, additions
to advertising will result in ever smaller additions to consumption. This concept is the basis of the advertising response function. Advertising response functions have been used for some time in brand level research to illustrate the effect of
Ž
advertising on consumption at various levels of advertising Tull et al., 1986,
.
Sasieni 1989, Lodish et al., 1995 .
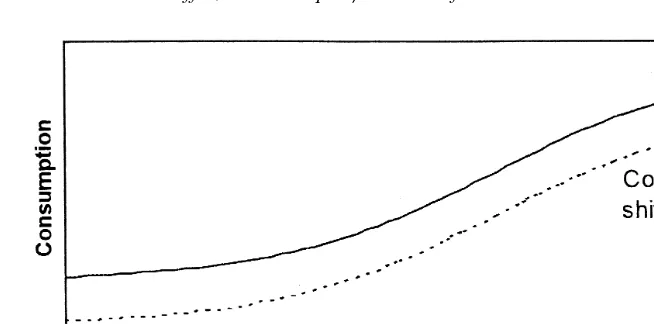
The same theory which describes the brand level advertising response function can be applied to the industry level. The industry level is defined as all tobacco products and includes all brands and all members of brand families. The industry level advertising response function is similar to the brand level function and is graphed in Fig. 1. The vertical axis measures industry level consumption and the horizontal axis measures the industry level stock of advertising. The stock of advertising is used since the effects of advertising linger over time. That is, advertising in period one will have a lingering, although smaller effect, in period two. Although the rate of decline over time remains an arguable issue, research
1
Ž .
( )
H. Saffer, F. ChaloupkarJournal of Health Economics 19 2000 1117–1137 1119
Fig. 1. National level.
Ž .
such as Boyd and Seldon 1990 finds that cigarette advertising fully depreciates within a year. The industry level response function is different from the brand level response function in that advertising-induced sales must come at the expense of sales of products from other industries or savings. Increases in consumption come from new consumers or from increases by existing consumers.
Prior econometric studies of tobacco consumption use one of three alternative empirical measures of advertising. These three alternatives are annual or quarterly national aggregate expenditure data, cross-sectional measures of advertising, and advertising bans. The industry response function predicts the likely outcome of prior studies based on the choice of advertising measure. Table 1 categorizes this literature based on the choice of advertising measure.
The first category of prior studies are those which use annual national expendi-tures as the measure of advertising. Annual national advertising expendiexpendi-tures are the yearly total of all cigarette-advertising expenditures, for all advertisers, in all media, for all geographic market areas. This is a high level of aggregation of the advertising data and as a result the data have very little variation. Since cigarettes are heavily advertised, the marginal product of advertising may be very low or zero.2 In Fig. 1, this is equivalent to measuring advertising in a small range around
A . The loss of variance due to aggregation leaves little to correlate with1
consumption and since the advertising occurs at a level where the marginal effect is small, it is not likely that any effect of advertising will be found.
Table 1 lists 15 cigarette advertising expenditure studies that use national annual or quarterly time series data. As expected, all of these studies find either no
2
Advertising expenditures are typically measured as a percent of sales which is known as the
Ž .
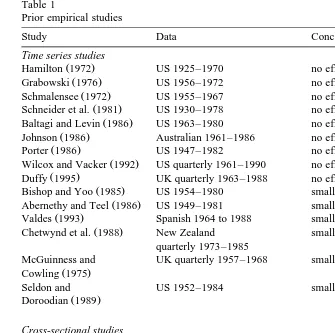
Table 1
Prior empirical studies
Study Data Conclusion
Time series studies
Ž .
Hamilton 1972 US 1925–1970 no effect of advertising
Ž .
Grabowski 1976 US 1956–1972 no effect of advertising
Ž .
Schmalensee 1972 US 1955–1967 no effect of advertising
Ž .
Schneider et al. 1981 US 1930–1978 no effect of advertising
Ž .
Baltagi and Levin 1986 US 1963–1980 no effect of advertising
Ž .
Johnson 1986 Australian 1961–1986 no effect of advertising
Ž .
Porter 1986 US 1947–1982 no effect of advertising
Ž .
Wilcox and Vacker 1992 US quarterly 1961–1990 no effect of advertising
Ž .
Duffy 1995 UK quarterly 1963–1988 no effect of advertising
Ž .
Bishop and Yoo 1985 US 1954–1980 small positive effect of advertising
Ž .
Abernethy and Teel 1986 US 1949–1981 small positive effect of advertising
Ž .
Valdes 1993 Spanish 1964 to 1988 small positive effect of advertising
Ž .
Chetwynd et al. 1988 New Zealand small positive effect of advertising quarterly 1973–1985
McGuinness and UK quarterly 1957–1968 small positive effect of advertising
Ž .
Cowling 1975
Seldon and US 1952–1984 small positive effect of advertising
Ž .
Doroodian 1989 Cross-sectional studies
Ž .
Lewit et al. 1981 7000 youths 1966–1970 positive effect of advertising
Ž .
Goel and Morey 1995 US states 1959–1982 positive effect of advertising Roberts and 1971–1982 for five firms positive effect of advertising
Ž .
Samuelson 1988 Ban studies
Ž .
Hamilton 1975 11 OECD countries no effect of a ban Laugesen and 22 OECD countries 1960–1986 negative effect of a ban
Ž .
Meads 1991
Ž .
Stewart 1993 22 OECD countries 1964–1990 no effect of a TV ban
Ž .
effect or a small effect of advertising on cigarette demand. Chetwynd et al. 1988 find a small effect with quarterly data that is lost when aggregation is increased to the annual level. This supports the theory that annual data have too little variance.
Ž .
Duffy 1996 reviews these studies, and a few more, which also use national level advertising data. He also reports that these studies find either no effect or a small effect and concludes that these studies show that cigarette advertising has no effect on cigarette consumption. An alternative conclusion, however, is that studies that use a single time series of national level data are inappropriate to measure the effect of advertising on consumption.
( )
H. Saffer, F. ChaloupkarJournal of Health Economics 19 2000 1117–1137 1121
level, such as a Metropolitan Statistical Area, for periods of less than a year. This type of data can have greater variation than national level data for several reasons. One reason for the variation in this type of data is that the mix of target markets and their relative size in each MSA is different. Another reason for variation in advertising levels is that the cost of advertising varies across local areas. An econometric study that uses monthly or quarterly local level data would include a relatively larger variation in advertising levels and in consumption data. When the variation in advertising levels is greater, the probability of being in an upward sloping portion of the response function increases. Local level advertising data are thus more likely to find a positive relationship between advertising and consump-tion.
Table 1 lists three studies that use cross-sectional data. The reason for so few cross-sectional studies is that the data are expensive and difficult to assemble. Cross-sectional data may measure advertising over a wider range and be more likely to fall in an upward sloping portion of the response function. The study by
Ž .
Roberts and Samuelson 1988 is somewhat different but may still be classified as cross-sectional. In their study the cross-sectional unit is the firm. These three studies show that when advertising is measured with cross-sectional data, a significant positive effect of advertising is observed.
The third category of prior studies are studies of advertising bans in specific media. The process by which an advertising ban can affect consumption is important to examine since there is more than one outcome possible, and bans are the empirical measure used in the empirical section of this paper. The first point to consider is that tobacco advertisers use a number of media and that each medium is subject to diminishing marginal product. The second point is that, although each medium has certain advantages and disadvantages, media are substitutes. An advertising ban will result in substitution into the non-banned media. The in-creased use of the non-banned media lowers the average and marginal product for these media. This shifts the industry response function in Fig. 1 downward. In a perfectly competitive model, firms will respond to this decrease by decreasing advertising. However, in an oligopoly, with response to rivals, all firms may react to reduced sales by increasing advertising and other promotion activities.3 This would be illustrated by moving to a higher level of advertising on a lower industry advertising response function.
As the number of media banned increases, there are less options for substitution and larger decreases in the average and marginal products of advertising. Addi-tional advertising expenditures in the non-banned media may no longer be able to compensate or may be too costly to justify the gains. This theory suggests that a
3 Ž .
limited set of bans may have little or no effect but that a comprehensive set of bans could significantly reduce the level of advertising expenditure and consump-tion.
Table 1 lists three studies of cigarette advertising bans using pooled
interna-4 Ž .
tional data sets. Hamilton 1975 used data on 11 countries over the period from 1948 to 1973. Hamilton presents a set of regressions using pooled data of countries with bans and countries without bans. The regressions show no effect of
Ž .
a ban. Laugesen and Meads 1991 used data from 22 Organization for Economic
Ž .
Cooperation and Development OECD countries for the period 1960 to 1986. Like Hamilton, they also find that prior to 1973 cigarette advertising bans had no effect on consumption. However, they find that after 1973 cigarette advertising bans and warning labels have had a significant negative effect on consumption. Laugesen and Meads argue that prior to 1973 manufacturers were able to increase alternative marketing efforts in response to broadcast advertising restrictions but that after 1973 this was more difficult. The third study of cigarette advertising
Ž .
bans was done by Stewart 1993 who analyzed data from 22 OECD countries for the period 1964 to 1990 and found that a television advertising ban had no effect. This study does not control for other offsetting increases in advertising in other media.
In summary, prior econometric studies of tobacco consumption use one of three alternative empirical measures of advertising. These three alternatives are annual or quarterly national aggregate expenditure data, cross-sectional measures of advertising, and advertising bans. Prior studies which use national expenditures as the measure of advertising lose variance from aggregation and measure advertising where the marginal product is likely to be very low or zero. Prior studies that use cross-sectional data have greater variation in the advertising data and are more likely to measure advertising where the marginal product is positive. Prior studies that use advertising bans as the measure of advertising must include bans which are sufficiently comprehensive to reduce the average and marginal products of the non-banned media such that the industry cannot compensate for this loss by increasing advertising or other marketing expenditures.
3. Empirical analysis of advertising bans
One reason that the empirical results from prior studies of the effects of advertising bans are mixed is that the bans must be sufficiently inclusive to reduce
4
( )
H. Saffer, F. ChaloupkarJournal of Health Economics 19 2000 1117–1137 1123
Ž .
the average product of the non-banned media. The studies by Hamilton 1975 and
Ž .
Laugesen and Meads 1991 suggest that this may not have been true in the past. However, since the late 1980s, a number of countries have enacted more compre-hensive tobacco advertising bans. These changes provide an opportunity to reexamine the effects of advertising bans on tobacco consumption. Consumer demand theory provides the conceptual framework for the empirical models. Tobacco advertising is included in the demand function as an information variable. The effect of advertising bans can be tested with an international data set that provides both cross-section and time series variance in the advertising ban
Ž .
variable. Farley and Lehmann 1994 conclude that cross-national differences in the response to advertising are relatively small. The advantages of this data set also include no self-reporting measurement error problems. However, the aggre-gate data set has a limited number of independent variables and may have serial correlation in the error terms for each country.5
An international aggregate data set consisting of 22 countries for the years 1970 through 1992 was constructed. The 22 countries are members of the OECD. The OECD countries were chosen because they have attempted to maintain a database of comparable economic and social data since 1960. The member countries of the OECD are also the most developed free market countries in the world. The data set was limited to 22 countries as data from Luxembourg and Turkey are not available.
Four alternative dependent variables are used in the regressions. There are two measures of per capita annual consumption of cigarettes, one from Health New
Ž .
Zealand 1995 and the other from the United States Department of Agriculture
ŽUSDA . There are also two measures of per capita consumption of tobacco in.6
Ž . Ž .
grams, one from Health New Zealand 1995 and one from Stewart 1993 . The data from Stewart go only to 1990, and the USDA data include only 17 OECD countries. The reason for employing four alternative dependent variables is the controversy over the differences in the data. The four data series actually correlate fairly closely with each other and with the available tobacco use data from the
Ž .
OECD 1997 . The correlation coefficient between the HNZ and Stewart tobacco data sets is 0.81 for the period 1970 to 1990 and 0.71 for the period 1984 to 1990. The correlation coefficient between the HNZ and USDA cigarette data sets is 0.92 for the 1970 to 1992 time period and 0.93 for the period from 1984 to 1992.7
5
Endogeneity between consumption and advertising bans is also possible. However, a test for endogeneity is dependent on an identifying variable that is difficult to find with this type of data.
6
The USDA data were provided by the World Bank.
7 Ž .
The advertising ban variables were created from data on television advertising, radio advertising, print advertising, outdoor advertising, point of purchase advertis-ing, movie advertisadvertis-ing, and sponsorship bans. The advertising ban data were
Ž . Ž .
obtained from Chapman and Wong 1989 , Health New Zealand 1995 , and
Ž .
WHO 1997 . Since the theory suggests that the effect of bans will increase as the number of banned media increases, there is likely to be a non-linear relationship between the number of bans and consumption. The most general specification which allows for a non-linear relationship between the number of media banned and consumption is eight dummy variables, one for no bans and one for each of the included media. However, a more parsimonious specification can also allow for a nonlinear relationship without creating additional collinearity problems. The alternative chosen is a set of three dummy variables. The first dummy is defined as Weak Ban and equals one if there are zero, one or two bans in effect. The second dummy, defined as Limited Ban, equals one if there are three or four media banned. The third dummy is defined as Comprehensive Ban, and equals one if there are five, six or seven media banned.8
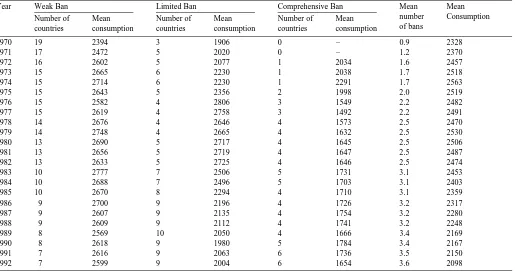
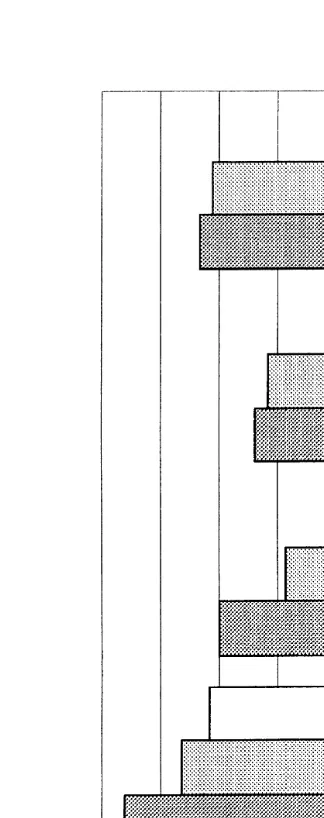
Table 2 and Fig. 2 present some descriptive data on the relationship between bans and consumption. Causality cannot be inferred from the data in Table 2 nor from the data in Fig. 2. Table 2 presents data for the three ban variables and per capita cigarette consumption, by year. The number of countries with Weak, Limited and Comprehensive Bans are reported along with per capita cigarette consumption for the countries in each ban category. The countries used to compute the mean consumption change each year since there are ban changes each year. The mean number of bans is also reported along with mean per capita cigarette consumption. It is interesting to note that the countries in the Comprehensive Ban category have the lowest consumption and the greatest decline in consumption over time. Fig. 2 shows mean consumption before a ban change and after a ban change, for the sample period from 1984 to 1992. The five increases in the number of bans were associated with a decrease in consumption. In the case of Sweden, which decreased the number of bans, the theory would predict no change or an increase in consumption. The decrease in consumption in Sweden may be at-tributable to other factors.
The data set also contains a price variable, an income variable, a percent filtered variable, and an unemployment variable. The tobacco price variable is the price of 20 cigarettes. The price data were converted to United States dollars and
Ž .
are in 1992 prices. The price data were obtained from Health New Zealand 1995 . Real income was computed by first dividing gross domestic product by population. This was then divided by the gross domestic product deflator and the purchasing
8
()
Advertising bans and per capita cigarette consumption
Year Weak Ban Limited Ban Comprehensive Ban Mean Mean
number Consumption
Number of Mean Number of Mean Number of Mean
of bans countries consumption countries consumption countries consumption
Fig.
2.
Per
capita
cigarette
( )
H. Saffer, F. ChaloupkarJournal of Health Economics 19 2000 1117–1137 1127
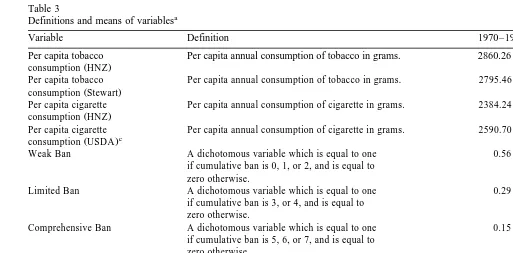
power parity. The data are in thousands of U.S. dollars and come from the OECD National Accounts. The demand equation also includes a measure of the percent of cigarettes that are filtered. This variable is included because several studies have shown that people who smoke filtered cigarettes smoke more than people who smoke unfiltered cigarettes. This variable could also reflect accumulating health information that induces a shift to filtered cigarettes. The demand equation also includes a variable for unemployment since a number of studies have shown that stress factors such as unemployment increase smoking. These data also come from HNZ. All of the data from HNZ were derived from OECD publications and the statistical yearbooks of specific countries. Table 3 contains summary definitions and mean values for all the variables.
A final set of variables included in all regressions is time and country dummy variables. These variables are particularly important in an international data set. In an international data set it is difficult to collect comparable data on many factors which may influence tobacco use. The unmeasured factors that vary over time, but are the same in all countries, are controlled by the time dummies. The unmeasured factors that vary across countries, but are the same in all time periods, are controlled by the country dummies.
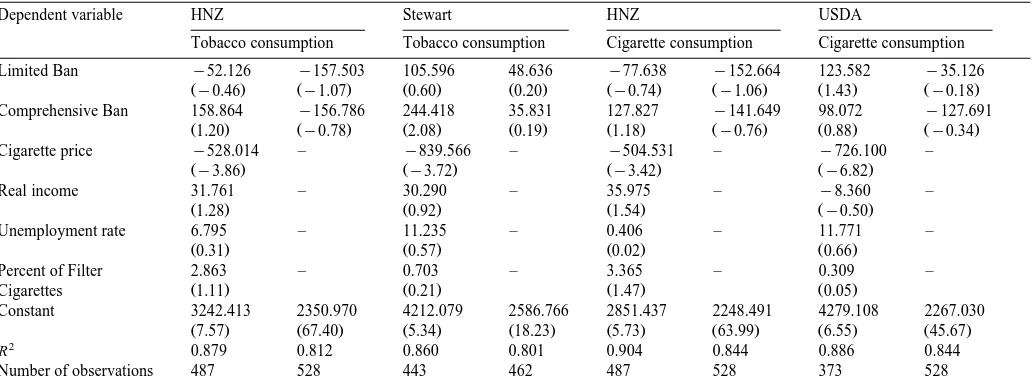
An initial set of regressions for all four dependent variables with two alternative specifications of independent variables were estimated. Since the Durbin–Watson statistics indicate serial correlation, all specifications were estimated with robust
Ž .9
standard errors Greene, 1997 . These results are presented in Table 4. The advertising ban coefficients were generally insignificant. These results may reflect a problem with the variance in the ban variables in the early years of the data set. The theory predicts that media substitution will prevent one or two bans from having any effect on the level of advertising. In the earlier years of the data set, there may not have been a sufficient number of media banned to have any impact on the level of advertising. An examination of Table 2 reveals that from 1970 to 1982 on average about 70% of the data were in the Weak Ban category. This may not be a sufficient number of bans to have any effect on advertising and thus on consumption.10 In 1983, France, Italy, and Portugal enacted stringent new
restric-tions on tobacco advertising, increasing the number of countries with Limited and Comprehensive Bans. Table 2 reveals that from 1983 to 1992 on average about 39% of the data were in the Weak Ban category. This suggests that the data after 1983 may include enough bans for an effect to be found.
9
These standard errors were computed with the robust variance estimator in STATA using country as the cluster variable. This procedure, which is also known as the Huber or White estimator, corrects for within cluster dependence. This allows for a country specific correction to the serial correlation problem. All other regressions presented in this paper also use robust variance estimators.
10 Ž .
()
Definitions and means of variablesa
b Variable Definition 1970–1992 mean 1984–1992 mean
Per capita tobacco Per capita annual consumption of tobacco in grams. 2860.26 2648.68 Ž .
consumption HNZ
Per capita tobacco Per capita annual consumption of tobacco in grams. 2795.46 2655.09 Ž .
consumption Stewart
Per capita cigarette Per capita annual consumption of cigarette in grams. 2384.24 2243.33 Ž .
consumption HNZ
Per capita cigarette Per capita annual consumption of cigarette in grams. 2590.70 2406.90 c
Ž . consumption USDA
Weak Ban A dichotomous variable which is equal to one 0.56 0.39 if cumulative ban is 0, 1, or 2, and is equal to
zero otherwise.
Limited Ban A dichotomous variable which is equal to one 0.29 0.40 if cumulative ban is 3, or 4, and is equal to
zero otherwise.
Comprehensive Ban A dichotomous variable which is equal to one 0.15 0.21 if cumulative ban is 5, 6, or 7, and is equal to
zero otherwise.
Cigarette price Price of 20 cigarettes. The variable is converted 2.00 2.16 to U.S. dollars by dividing by the purchasing
power parity.
Real income Gross domestic product divided by population. 16.30 18.71 The variable is adjusted by dividing by the GDP deflator
and converted to thousands of U.S. dollars by dividing by the purchasing power parity.
Unemployment rate Unemployment rate as percent of total labor force. 5.72 7.56 Percent of filter cigarettes Measure of the percent of cigarettes that are filter. 84.24 89.46
aAll data are for the 22 countries: Australia, Austria, Belgium, Canada, Denmark, Finland, France, Germany, Greece, Iceland, Ireland, Italy, Japan, Netherlands, New
Zealand, Norway, Portugal, Spain, Sweden, Switzerland, the United Kingdom, and the United States. bStewart 1993 data on per capita tobacco consumption are for the years 1984 through 1990.Ž . c
()
H.
Saffer,
F.
Chaloupka
r
Journal
of
Health
Economics
19
2000
1117
–
1137
1129
Table 4 1970–1992
Dependent variable HNZ Stewart HNZ USDA
Tobacco consumption Tobacco consumption Cigarette consumption Cigarette consumption
Limited Ban y52.126 y157.503 105.596 48.636 y77.638 y152.664 123.582 y35.126
Žy0.46. Žy1.07. Ž0.60. Ž0.20. Žy0.74. Žy1.06. Ž1.43. Žy0.18.
Comprehensive Ban 158.864 y156.786 244.418 35.831 127.827 y141.649 98.072 y127.691
Ž1.20. Žy0.78. Ž2.08. Ž0.19. Ž1.18. Žy0.76. Ž0.88. Žy0.34.
Cigarette price y528.014 – y839.566 – y504.531 – y726.100 –
Žy3.86. Žy3.72. Žy3.42. Žy6.82.
Real income 31.761 – 30.290 – 35.975 – y8.360 –
Ž1.28. Ž0.92. Ž1.54. Žy0.50.
Unemployment rate 6.795 – 11.235 – 0.406 – 11.771 –
Ž0.31. Ž0.57. Ž0.02. Ž0.66.
Percent of Filter 2.863 – 0.703 – 3.365 – 0.309 –
Ž . Ž . Ž . Ž .
Cigarettes 1.11 0.21 1.47 0.05
Constant 3242.413 2350.970 4212.079 2586.766 2851.437 2248.491 4279.108 2267.030
Ž7.57. Ž67.40. Ž5.34. Ž18.23. Ž5.73. Ž63.99. Ž6.55. Ž45.67. 2
R 0.879 0.812 0.860 0.801 0.904 0.844 0.886 0.844
Number of observations 487 528 443 462 487 528 373 528
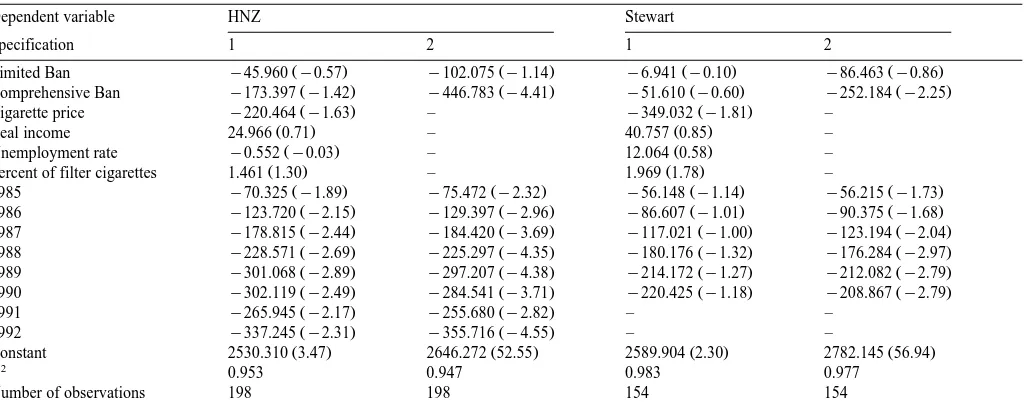
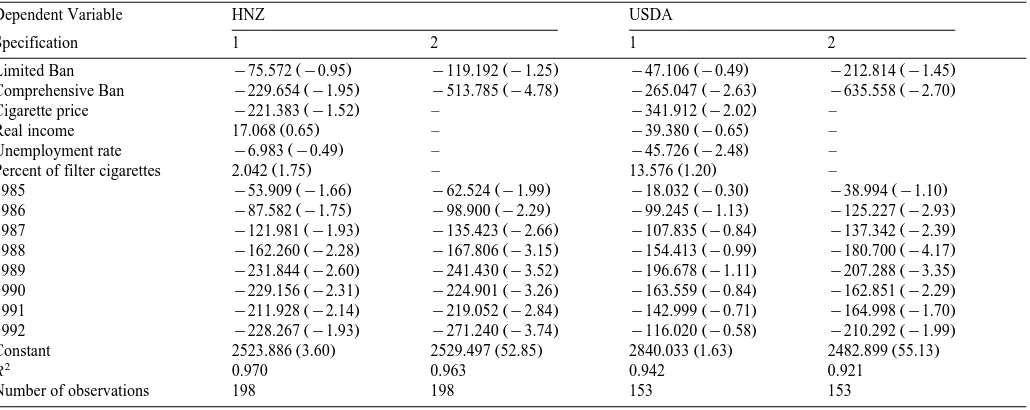
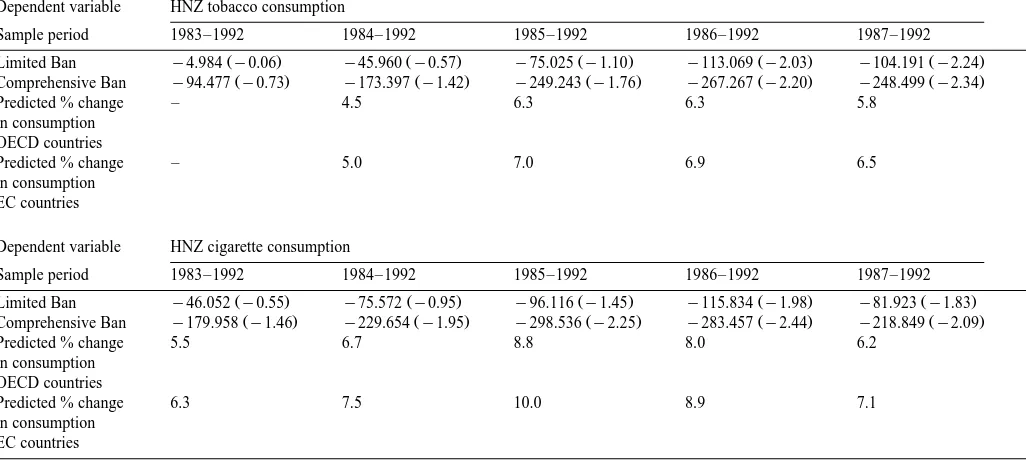
A new set of regressions limited to the period 1984 to 1992 was estimated. These results are presented in Tables 5 and 6. Table 5 presents the results for tobacco consumption and Table 6 presents the results for cigarette consumption. Each table presents a specification that includes independent variables as well as dummy variables and a specification that includes only dummy variables. The dummy variables are the bans, time, and country variables. Since splitting the sample at 1984 is somewhat arbitrary, it is important to examine the results from alternative subsamples of the data. Table 7 presents the ban coefficients and the results using HNZ cigarette and tobacco consumption derived from four alterna-tive time subsamples. These subsamples begin with the period 1983 to 1992 and end with the period 1987 to 1992. These models also include the price, income, unemployment, and percent filter cigarette variables. The subsample for 1984 to 1992 is also included in this table to facilitate comparisons with Tables 5 and 6. In Tables 5–7, the advertising ban variables are all negative. The Limited Ban variable coefficients are generally not significant, while the Comprehensive Ban coefficients are almost all significant. There are several interesting comparisons between the ban variable coefficients. These comparisons support the hypothesis that the effects of advertising bans is cumulative, show that the Stewart data is inconsistent with the other series, and provide some guidance for studies of tobacco control in developing nations.
First, the coefficients of the Limited Ban variable are generally not significant. In the five regressions in Table 7 where the Limited Ban coefficients are significant, they are less than one-half the size of the coefficients of the Compre-hensive Ban variable. This suggests that moving from a Limited Ban to a Comprehensive Ban has a compounding effect, which is consistent with the theory that Limited Bans allow substitution to other media. The results show that limited sets of bans will be minimally effective in reducing the impact of advertising. However, Comprehensive Bans have a clear effect in reducing tobacco use. Also, Table 7 indicates that the effect of advertising bans increases in magnitude and significance as more current samples are used. This may be due, in part, to the increase in the number of bans over time, or due to the effect of lagged consumption on current consumption.
()
Comprehensive Ban y173.397 y1.42 y446.783 y4.41 y51.610 y0.60 y252.184 y2.25
Ž . Ž .
Cigarette price y220.464 y1.63 – y349.032 y1.81 –
Ž . Ž .
Real income 24.966 0.71 – 40.757 0.85 –
Ž . Ž .
Unemployment rate y0.552 y0.03 – 12.064 0.58 –
Ž . Ž .
Percent of filter cigarettes 1.461 1.30 – 1.969 1.78 –
Ž . Ž . Ž . Ž .
Constant 2530.310 3.47 2646.272 52.55 2589.904 2.30 2782.145 56.94
2
R 0.953 0.947 0.983 0.977
Number of observations 198 198 154 154
()
Comprehensive Ban y229.654 y1.95 y513.785 y4.78 y265.047 y2.63 y635.558 y2.70
Ž . Ž .
Cigarette price y221.383 y1.52 – y341.912 y2.02 –
Ž . Ž .
Real income 17.068 0.65 – y39.380 y0.65 –
Ž . Ž .
Unemployment rate y6.983 y0.49 – y45.726 y2.48 –
Ž . Ž .
Percent of filter cigarettes 2.042 1.75 – 13.576 1.20 –
Ž . Ž . Ž . Ž .
Constant 2523.886 3.60 2529.497 52.85 2840.033 1.63 2482.899 55.13
2
R 0.970 0.963 0.942 0.921
Number of observations 198 198 153 153
()
H.
Saffer,
F.
Chaloupka
r
Journal
of
Health
Economics
19
2000
1117
–
1137
1133
Table 7
Dependent variable HNZ tobacco consumption
Sample period 1983–1992 1984–1992 1985–1992 1986–1992 1987–1992
Ž . Ž . Ž . Ž . Ž .
Limited Ban y4.984 y0.06 y45.960 y0.57 y75.025 y1.10 y113.069 y2.03 y104.191 y2.24
Ž . Ž . Ž . Ž . Ž .
Comprehensive Ban y94.477 y0.73 y173.397 y1.42 y249.243 y1.76 y267.267 y2.20 y248.499 y2.34
Predicted % change – 4.5 6.3 6.3 5.8
in consumption OECD countries
Predicted % change – 5.0 7.0 6.9 6.5
in consumption EC countries
Dependent variable HNZ cigarette consumption
Sample period 1983–1992 1984–1992 1985–1992 1986–1992 1987–1992
Ž . Ž . Ž . Ž . Ž .
Limited Ban y46.052 y0.55 y75.572 y0.95 y96.116 y1.45 y115.834 y1.98 y81.923 y1.83
Ž . Ž . Ž . Ž . Ž .
Comprehensive Ban y179.958 y1.46 y229.654 y1.95 y298.536 y2.25 y283.457 y2.44 y218.849 y2.09
Predicted % change 5.5 6.7 8.8 8.0 6.2
in consumption OECD countries
Predicted % change 6.3 7.5 10.0 8.9 7.1
in consumption EC countries
are about the same while the estimated effects with the Stewart variable are smaller.
Third, the specifications which omit the independent variables, price, income, unemployment, and percent filtered generate ban coefficients that are about twice the size of the coefficients from the specifications which include these variables. These results show that regression models that omit important correlates of tobacco use still find that advertising bans have a negative and significant effect, but overestimate the magnitude of the effect. One reason this result is important is that it provides evidence that studies of tobacco control in developing nations may find very limited data on independent variables such as price and income. Studies which exclude these variables will correctly measure the effect of advertising bans, but will probably overstate the magnitude of the effect.
The other independent variables in Tables 5 and 6 are mixed. The price coefficients are negative and significant in the regressions for the 1970 to 1992 period and in regressions for 1984 to 1992. The estimated price elasticities for the HNZ and USDA cigarette variables in the 1970 to 1992 period are y0.41 and
y0.55, respectively. The comparable elasticities for 1984 to 1992 arey0.21 and
y0.31. These estimates are consistent with many other studies of tobacco price
Ž .
elasticities Chaloupka and Warner, 2000 . Finally, income and unemployment are insignificant, while the percent filtered cigarettes generally has a positive effect on tobacco and cigarette use.
4. Conclusions
The primary conclusion of this research is that tobacco advertising increases tobacco consumption. The empirical evidence also shows that comprehensive advertising bans can reduce tobacco consumption, but that a limited set of advertising bans will have little or no effect. A limited set of advertising bans will not reduce the total level of advertising expenditure but will simply result in substitution to the remaining non-banned media. When more of the remaining media are eliminated, the options for substitution are also eliminated.11
The estimated ban coefficients can be used to predict the percentage change in consumption that would result from additional media bans. For example, the consumption level which would have occurred if all OECD countries had Compre-hensive Bans during a sample period can be predicted. The regressions from Table 7 are used for this exercise since the HNZ data include more countries than the USDA and is more consistent than the Stewart data. The percentage change in
11
( )
H. Saffer, F. ChaloupkarJournal of Health Economics 19 2000 1117–1137 1135
consumption predicted from each regression is reported in Table 7. The data indicate about a 5.4% reduction in tobacco use and about a 7.4% reduction in cigarette use if all OECD countries had enacted Comprehensive Bans.12
The regression results can also be used to predict the effects of the new European tobacco advertising policy initiatives. A European Commission directive issued in late 1997 requires that tobacco advertising in the EC countries diminish progressively from 2001 and end entirely no later than October 2006. The data for the 11 included EC countries and regressions in Table 7 can be used to predict the effects of this directive. The data predict that the new legislation will reduce tobacco consumption by 6.3% and cigarette consumption by 7.9%.
Finally, the analysis presented in this paper suggests that the new ban on outdoor advertising, required by the 1999 US tobacco industry settlement, will have little effect on consumption. Under the settlement, print advertising, point of purchase advertising, and sponsorships will not be banned. In addition, other forms of promotion will not be banned. This will result in substitution to the remaining three forms of advertising and to increased use of tobacco promotion.13
Acknowledgements
Funded by grant number R01 CA63458 from the National Cancer Institute. Helpful comments were provided by Michael Grossman, K. Michael Cummings and Kenneth Warner. Research assistance was provided by Dhaval Dave.
References
Abernethy, A., Teel, J.E., 1986. Advertising for cigarettes. Journal of Advertising 15, 51–55. Baltagi, B.H., Levin, D., 1986. Estimating dynamic demand for cigarettes using panel data: the effects
of bootlegging, taxation, and advertising reconsidered. Review of Economics and Statistics 68, 148–155.
Bishop, J.A., Yoo, J.H., 1985. Health scare, excise taxes and advertising ban in the cigarette demand and supply. Southern Economic Journal 52, 402–411.
Boyd, R., Seldon, B., 1990. The fleeting effect of advertising. Economic Letters 34, 375–379.
Ž .
Chaloupka, F.J., Warner, K.E., 2000. The economics of smoking. In: Culyer, A.J., Newhouse, J. Eds. , Handbook of Health Economics. Elsevier, Amsterdam.
Chapman, S., Wong, W.L., 1990. Tobacco Control in the Third World: A Resource Atlas. International Organization of Consumers Unions, Malaysia.
12
Consumption was predicted with the Limited Ban variable equal to zero and the Comprehensive Ban variable equal to one and all other variables equal to their mean. Predicted consumption was subtracted from actual consumption, and the change was divided by actual consumption.
13
Chetwynd, J., Coope, P., Brodie, R.J., Wells, E., 1988. Impact of cigarette advertising on aggregate demand for cigarettes in New Zealand. British Journal of Addiction 83, 409–414.
Duffy, M., 1995. Advertising in demand systems for alcoholic drinks and tobacco: a comparative study. Journal of Policy Modeling 17, 557–577.
Duffy, M., 1996. Econometric studies of advertising, advertising restrictions, and cigarette demand: a survey. International Journal of Advertising 15, 1–23.
Farley, J.U., Lehmann, D.R., 1994. Cross-national AlawsB and differences in market response. Management Science 40, 112–122.
Federal Trade Commission, 1998. Federal Trade Commission Report to Congress for 1996: Pursuant to the Federal Cigarette Labeling and Advertising Act, Federal Trade Commission, Washington, DC. Goel, R.K., Morey, M.J., 1995. The interdependence of cigarette and liquor demand. Southern
Economic Journal 62, 451–459.
Grabowski, H.G., 1976. The effect of advertising on the inter-industry distribution of demand. Explorations in Economic Research 3, 21–75.
Greene, W.H., 1997. Econometric Analysis. Prentice Hall, NJ.
Hamilton, J.L., 1972. Advertising, the health scare, and the cigarette advertising ban. Review of Economics and Statistics 54, 401–411.
Hamilton, J.L., 1975. The effect of cigarette advertising bans on cigarette consumption. Proceedings of the Third World Conference on Smoking and Health. DHEW, Washington, DC, pp. 829–840. Health New Zealand, 1995. Tobacco Use Among the OECD Industrialized Countries Since 1960:
Advertising Restrictions & Health Warnings. Health New Zealand, New Zealand.
Hoek, J., 1999. Effects of tobacco advertising restrictions. International Journal of Advertising 18, 23–39.
Johnson, L.W., 1986. Advertising expenditure and the aggregate demand for cigarettes in Australia. International Journal of Advertising 1, 45–58.
Laugesen, M., Meads, C., 1991. Tobacco advertising restrictions, price, income, and tobacco consump-tion in OECD countries 1960–1986. British Journal of Addicconsump-tion 86, 1343–1354.
Lewit, E.M., Coate, D., Grossman, M., 1981. The effects of government regulation on teenage smoking. Journal of Law and Economics 24, 545–569.
Luik, J.C., 1994. Do Tobacco Advertising Bans Really Work? A Review of the Evidence. The Niagara Institute, Canada.
Lodish, L.M. et al., 1995. How TV advertising works: a meta-analysis of 389 real world split cable TV advertising experiments. Journal of Marketing Research 32, 125–139.
McGuinness, T., Cowling, K., 1975. Advertising and the aggregate demand for cigarettes. European Economic Review 6, 311–328.
OECD, 1997. OECD Health Systems: Facts and Trends. OECD, Paris.
Office on Smoking and Health, 1994. Preventing Tobacco Use Among Young People: A Report of the Surgeon General. U.S. Government Printing Office, Washington, DC.
Peto, R., Lopez, A.D., Boreham, J., Thun, M., Heath, C. Jr., 1994. Mortality from Smoking in Developed Countries 1950–2000. Oxford Univ. Press, New York.
Porter, R.H., 1986. The impact of government policy on the U.S. cigarette industry. In: Ippolito, P.M.,
Ž .
Scheffman, D.T. Eds. , Empirical Approaches to Consumer Protection Economics. U.S. Govern-ment Printing Office, pp. 447–484.
Roberts, M.J., Samuelson, L., 1988. An empirical analysis of dynamic, nonprice competition in an oligopolistic industry. RAND Journal of Economics 19, 200–220.
Roemer, R., 1993. Legislative Action to Combat the World Tobacco Epidemic. World Health Organization, Geneva.
Saffer, H., 1995. Alcohol advertising and alcohol consumption: econometric studies. In: Martin, S.E.
ŽEd. , The Effects of the Mass Media on the Use and Abuse of Alcohol. National Institute on.
Alcohol Abuse and Alcoholism, pp. 83–99.
( )
H. Saffer, F. ChaloupkarJournal of Health Economics 19 2000 1117–1137 1137
Schmalensee, R.L., 1972. On the Economics of Advertising. North Holland, Amsterdam.
Schneider, L., Klein, B., Murphy, K., 1981. Government regulation of cigarette health information. Journal of Law and Economics 24, 575–612.
Schonfeld and Associates, 1997. Advertising Ratios and Budgets. Schonfeld and Associates, Lin-colnshire.
Seldon, B.J., Doroodian, K., 1989. A simultaneous model of cigarette advertising: effects on demand and industry response to public policy. Review of Economics and Statistics 71, 673–677. Stewart, M.J., 1993. The effect on tobacco consumption of advertising bans in OECD countries.
International Journal of Advertising 12, 155–180.
Tull, D.S. et al., 1986. Leveraged decision making in advertising: the flat maximum principle and its implications. Journal of Marketing Research 23, 25–32.
Valdes, B., 1993. Cigarette consumption in Spain: empirical evidence and implications for public health policy. Applied Economics 20, 149–156.