Full Terms & Conditions of access and use can be found at
http://www.tandfonline.com/action/journalInformation?journalCode=vjeb20
Download by: [Universitas Maritim Raja Ali Haji] Date: 11 January 2016, At: 19:17
Journal of Education for Business
ISSN: 0883-2323 (Print) 1940-3356 (Online) Journal homepage: http://www.tandfonline.com/loi/vjeb20
Illusion Versus Reality: An Empirical Study of
Overconfidence and Self Attribution Bias in
Business Management Students
Vinky Sharma & Moonis Shakeel
To cite this article: Vinky Sharma & Moonis Shakeel (2015) Illusion Versus Reality: An Empirical Study of Overconfidence and Self Attribution Bias in Business Management Students, Journal of Education for Business, 90:4, 199-207, DOI: 10.1080/08832323.2015.1014458
To link to this article: http://dx.doi.org/10.1080/08832323.2015.1014458
Published online: 16 Mar 2015.
Submit your article to this journal
Article views: 124
View related articles
View Crossmark data
Illusion Versus Reality: An Empirical Study
of Overconfidence and Self Attribution Bias
in Business Management Students
Vinky Sharma and Moonis Shakeel
Jaypee Institute of Information Technology, Noida, India
Students often exhibit overconfidence and self-attribution bias (SAB). The authors report the findings of a survey of management students across gender. They found why students fail to understand the fact that their performance was actually dismal while their belief about their ability to perform well was high. The results imply that all students irrespective of gender tend to be overconfident. It was also observed that a larger percentage of the female students had a tendency to be overconfident. Existence of SAB among management students was also observed. However, a gender-wise breakdown of the students depicted that more female students portrayed SAB specifically when poor grades were received.
Keywords: management, overconfidence, self-attribution bias, students
The way individuals think about themselves has been an important research topic for a long time. In that sense, there is evidence for a variety of behaviors or behav-ioral outcomes when people assess their characters more favorably. These behaviors also include overconfidence and self-attribution bias (SAB). Overconfidence is the tendency of people to overestimate the accuracy of their knowledge. There is a substantial literature in psychol-ogy, which suggests that, people are apparently overcon-fident about their own knowledge (Keren, 1991; Yates, 1990). This behavior is particularly observed in stu-dents, where they tend to overestimate their grades. Psy-chologists have also long known that people, in general, and students, in particular, tend to overestimate their abilities. In an educational context, this tendency toward overconfidence is exacerbated among the people who exhibit the lowest skill in recognizing their own incom-petence (Kruger & Dunning, 1999).
Philosophers and writers have long tried to raise the awareness about the difficulty of balancing confidence with realism, yet the consequences of unsupportable confidence continues specifically when it comes down to gender differences. A number of studies have docu-mented a gender difference in overconfidence, with
men being more overconfident than women in a wide variety of domains related to mathematics, science, and technology (Niederle & Vesterlund, 2007; O’Laughlin & Brubaker, 1998; Pajares & Miller, 1994). In addi-tion, men more often initiate unprovoked attacks and wars than by women because men are more overconfi-dent about their expectations of success in conflict (Johnson et al., 2006).
Another behavior, which is depicted by people, is SAB. It is a tendency for people to attribute successes or good outcomes to their own abilities, while blaming failures on circumstances beyond their control, which can lead to increase in over confidence (Miller & Ross, 1975). One possibility that tilt attribution is the cogni-tive factors, suggesting that self-serving bias stems mainly from certain tendencies in the way people pro-cess social information (Ross, 1977). In contrast, another explanation emphasizes the role of motivation. This explanation suggests that the self-serving bias stems from people’s need to protect and enhance their self-esteem or related desire to look good to others (Greenberg, Pyszczynski, & Solomon, 1983).
In the present study we tried to investigate the presence of overconfidence and SAB from empirical data collected using a survey questionnaire on management students. The paper also examines, using appropriate statistical tests, to find out if there exists a gender difference in overconfidence and SAB.
Correspondence should be addressed to Vinky Sharma, Jaypee Institute of Information Technology, Jaypee Business School, Noida, India. E-mail: [email protected]
ISSN: 0883-2323 print / 1940-3356 online DOI: 10.1080/08832323.2015.1014458
LITERATURE SURVEY
Overconfidence has been explained by variety of ways, ranging from a tendency to favor positive above negative evidence (Koriat, Linchtenstein, & Fischhoff, 1980) or con-firmatory bias (Rabin & Schrag, 1990) to a lack of com-plete, immediate, and accurate feedback (Arkes, 2001). People often appear overconfident for questions where they possess a self-declared expertise (Heath & Tversky, 1991). Camerer and Lovallo (1991) also found strong evidence of overconfidence in an experimental market entry game. An overconfident person, whose average probability judgment exceed the proportions of items he or she answers correctly (Yates, Lee, & Shinotsuka, 1996), tends to makes decision based on faulty assumptions, resulting in less than optimal decisions (Lee at al., 1995). In the same way students, in particular, often exhibit overconfident grade expectations and tend to overestimate the actual course grade at the com-pletion of a course (Nowell & Alston, 2007).
Millea and Grimes (2002) reported that both expected grades and actual grades influence students’ evaluations. The average of student evaluations of teaching are higher in classes where students expect higher grades, but they found that it is “the gap between expected grade and cumu-lative grade point average” rather than expected grade, per se, that is the relevant explanatory variable (Isley & Singh, 2005, p. 28). Seifert (2004) and Bandura (1993) suggested that for achievement-oriented students, who set goals and adjust their behavior to reach them, overconfidence may result in allocating less time to studying than would be the case if their grade expectations were more accurate.
Yates et al. (1992) proposed that the overconfidence observed in most Asian countries, relative to western coun-tries, reflects differences in the number of arguments typi-cally recruited in those countries. Western methods of education (i.e., constructive approach) result in the recruit-ment of more argurecruit-ments than do Asian methods (i.e., direct instruction approach). The more arguments he or she recruits, the more a person is in doubt about any decision. It is noted that students consistently overestimate the grades they would actually receive. Falchikov and Boud (1989) and Grimes (2002) also suggested that overconfidence may vary systematically with student characteristics and aca-demic discipline.
The most pervasive finding in the body of literature on overconfidence is that individuals are overconfident across a wide variety of tasks (Fischhoff & Slovic, 1980), response modes (Fischhoff, Slovic, & Lichtenstien, 1977), subject populations (Philips and Wright, 1977), and contexts (e.g., banking, engineering, clinical psychology). Notably, the overconfidence bias does not vary as a function of intelli-gence or other personality measures, though the results relating to expertise are maximized and mixed.
Langer and Roth (1975) argued that skill attribution is determined early in sequence of outcomes suggesting that
overconfidence develops quickly. Brockner and Weisenfeld (1996) used attribution theory to explain the processx out-come interaction pattern by looking at two different aspects of the theory. The first explanation focuses on basic internal and external causes for the process and outcome while the second explanation focuses on behavior or motivational aspects of attribution theory.
An early review of serving bias suggests that self-serving bias can be interpreted in nonmotivational, infor-mation-processing terms (Miller & Ross, 1975). In this view of self- serving bias, individuals restrict their attention to the information available to them so that flawed informa-tion processing leads to self-serving bias. A different view suggests that self-serving bias can be interpreted in motiva-tional terms such that individuals desire to think positively of themselves so they attribute successful outcomes to themselves and negative outcomes to others (Bradley, 1978). This view assumes that people need to protect or enhance their feelings of personal worth, so that self-serv-ing attributions can be made to confirm the individual’s self-esteem.
In an attempt to reconcile the two different viewpoints, some researchers have suggested that cognitive and motiva-tional aspects may be operating concurrently. Pyszcynski, Greenberg, and LaPrelle (1985), for example, argued that an extensive information search that occurs after a failure experience may be a reaction to self-threat, and motivates the individual to find information consistent with a self-serving attribution. The individual would only engage in the extensive information search, however, if he or she expected to confirm a self-serving conclusion. In this situa-tion, elements of both motivational and information-proc-essing theory are used to account for self-serving bias.
A field experiment conducted by Taylor and Reiss (1989) concluded that self-serving bias may not occur in natural settings, and the authors suggested that previous studies (particularly laboratory experiments) may not gen-eralize to field settings as expected. In contrast, however, most reviews on serving bias have concluded that self-serving bias does exist albeit with certain caveats.
Problem Statement(s)
Given the significance of overconfidence and SAB among students, in the present study we attempted an empirical examination of the presence of the same among manage-ment students by conducting a comparative analysis on gender. The objectives of the study were (a) to find out the presence of overconfidence among management students across gender; and (b) to explore the existence of SAB among management students across gender.
Hypotheses
Study hypotheses follow:
200 V. SHARMA AND M. SHAKEEL
Hypothesis 1 (H1): To test the differences in actual and expected frequencies on the variable ability to under-stand MBA courses (for overall sample; and based on gender):
H0 (Overall Sample):Actual frequency (ability to understand) would be equal to expected frequency (ability to understand)
H0 (GenderDMale):Actual frequency (ability to understand) would be equal to expected frequency (ability to understand)
H0 (GenderD Female): Actual frequency (ability to under-stand) would be equal to expected frequency (ability to understand)
H2:To test the presence of differences on ability to under-stand, grade perception, and actual grade across gender:
H0: Male perception (ability to understand) would be equal to female perception (ability to understand)
H0:Male perception (grade perception) would be equal to female perception (grade perception)
H0: Male perception (actual grade) would be equal to female perception (actual grade)
Significance of the Study
It would be worthwhile to know if a gender difference in overconfidence exists within the management students. Such a gender difference could have far-reaching conse-quences; among other things, it could explain why students fail to understand the fact that their performance was actu-ally dismal while their belief about their ability to perform well was actually high. Overconfidence may lead to dis-couragement among such students; hence, it becomes imperative for the institutions to have periodic counseling sessions for the students in order to make them understand the differences in their performances and how to recover from the same. This would help them prevent from entering into SAB and make them understand the difference between illusion and reality.
RESEARCH PHILOSOPHY
This research problem required an intense research process that used both interpretivist (qualitative) and positivist (quantitative) approaches to research. Both quantitative and qualitative methods were needed to provide the information required for sound and effective analysis. Each approach can inform the other with a study of an issue following a circular course through a qualitative-quantitative or quanti-tative-qualitative sequence. In this sense the research
process was both inductive (bottom-up) and deductive (top-down) in nature.
In the first phase of the study, inductive approach was used to describe and explain the research problem. To do this, observations were collected and patterns were identi-fied to formulate the hypothesis. Once this was done, the second phase of the study used the deductive approach, wherein the hypotheses were tested using the collected observations. The empirical results obtained in the second phase were unexpected and hard to explain. Therefore, we had to resort to inductive approach to substantiate the find-ings from other researches (Burns & Burns, 2008).
Questionnaire Design
Primary data were collected from postgraduate management students with the help of a structured questionnaire, which contained three questions, wherein question 1 was designed to capture overconfidence and question 2 for capturing SAB. Question 3 was incorporated to validate their claims.
The first question was regarding how they rate themselves on their ability to understand management courses. The responses were taken using a 5-point Likert-type scale rang-ing from 1 (highly able) to 5 (highly unable). The second question was about their grade perception (good or bad). This particular question was divided into two parts: if the student thinks that the grades that he or she has scored are good then, they would fill part (a) or else part (b). The third question was about their actual grade earned (or cumulative grade point average [CGPA]).
Data Collection Procedure and Processing
The questionnaire was administered to the students sepa-rately; that is, the students were asked to give the response to the first question and the responses were collected. Then the second question was provided and the responses were collected. Finally, the third question was given to get the responses. This was intentionally done to avoid biased responses mainly because response to one question could have influenced the response to the next question, and we did not want the students to know what the next question was. All the questions were coded with the same number and it was ensured that the same questionnaire goes to the same student.
Before giving the response to the first question, the respondent was asked to check the box against male or female. In order to make CGPA comparable on Likert-type scale, the CGPA was categorized from 1 (highest existing grade [i.e., 8.1–10]) to 4 (lowest existing grade [i.e.,<4]).
The data were collected over a period of two years (2012 and 2013; i.e., for two different master of business adminis-tration batches). Thus, the sample size was 320 manage-ment students. Of the total number of students surveyed
over the period of two years, 58% (nD185) were female respondents and 42% (nD135) were male respondents.
Statistical Techniques
Our research was inductive, as it starts with analysis fol-lowed by specific observations and descriptions that pro-duced explanation of the results generated. Therefore, this research was qualitative in nature as it developed a picture of what is occurring, generating tentative conjectures and determining the feasibility and sense of direction for more rigorous follow-up. Given this background, we have used nonparametric tests (quantitative approach) such as chi-square and Mann-Whitney and then dived deep for specific
observation by conducting cross-frequency tables to sub-stantiate the findings.
The data used for the study are multidimensional (nominal), therefore it was apt to use chi-square statistic to test whether the variables are independent of each other. Further, the Mann-Whitney test was applied to conduct the independent samples test to confirm whether the significant difference exist on a particular variable based on gender.
FINDINGS
To illustrate the existence of difference in overconfi-dence among the management students in general, and across gender, we conducted a chi-square analysis. We used it here to determine whether there was equal num-ber of students within the five categories of ability per-ception by testing the differences between the observed and expected frequencies. Previous research has
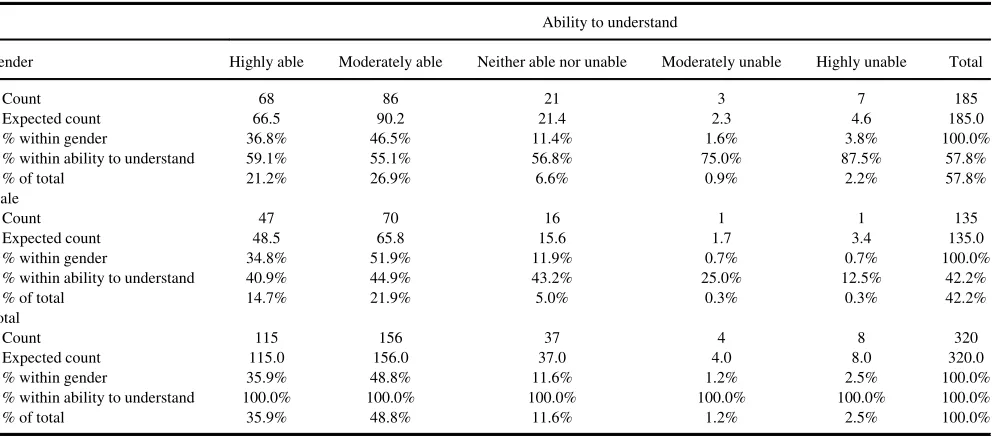
TABLE 4
Gender£Ability to Understand Cross-Tabulation
Ability to understand
Gender Highly able Moderately able Neither able nor unable Moderately unable Highly unable Total
Count 68 86 21 3 7 185
Expected count 66.5 90.2 21.4 2.3 4.6 185.0
% within gender 36.8% 46.5% 11.4% 1.6% 3.8% 100.0%
% within ability to understand 59.1% 55.1% 56.8% 75.0% 87.5% 57.8%
% of total 21.2% 26.9% 6.6% 0.9% 2.2% 57.8%
Male
Count 47 70 16 1 1 135
Expected count 48.5 65.8 15.6 1.7 3.4 135.0
% within gender 34.8% 51.9% 11.9% 0.7% 0.7% 100.0%
% within ability to understand 40.9% 44.9% 43.2% 25.0% 12.5% 42.2%
% of total 14.7% 21.9% 5.0% 0.3% 0.3% 42.2%
Total
Count 115 156 37 4 8 320
Expected count 115.0 156.0 37.0 4.0 8.0 320.0
% within gender 35.9% 48.8% 11.6% 1.2% 2.5% 100.0%
% within ability to understand 100.0% 100.0% 100.0% 100.0% 100.0% 100.0%
% of total 35.9% 48.8% 11.6% 1.2% 2.5% 100.0%
TABLE 2
Gender Differences Across Questions
Item Mann-WhitneyU Wilcoxon W Z p
Ability to understand 12358.000 21538.000 ¡0.173 .862 Grade perception 11590.000 20770.000 ¡1.269 .205 Actual grade 9558.000 18738.000 ¡3.588 .000
TABLE 3 Ability to Understand
Ability n % Valid % Cumulative %
Valid highly able 115 35.9 35.9 35.9
Moderately able 156 48.8 48.8 84.7
Neither able nor unable 37 11.6 11.6 96.2
Moderately unable 4 1.2 1.2 97.5
Highly unable 8 2.5 2.5 100.0
Total 320 100.0 100.0
TABLE 1
Difference in Ability Perception
Ability to understand h2 df p
Ability to understand (overall) 289.531 4 .000 Ability to understand (male) 137.852 4 .000 Ability to understand (female) 153.351 4 .000 202 V. SHARMA AND M. SHAKEEL
suggested that there exists a difference in overconfi-dence among male and female students and they often exhibit overconfident grade expectations that tend to overestimate the actual course grade at the completion of the course (Nowell & Alston, 2007). Our chi-square result suggests an expected frequency of 64 in each of the categories in the ability question; however, given the actual frequencies the test suggest that there is a sig-nificant difference between them (x2 p D .000). The same test was then applied on ability perception based on gender to know further whether these differences also present in male and female students separately. The result shows that there is also a significant difference (x2pD.000) for male and female students, respectively (see Table 1).
As mentioned in research methodology, Mann-Whit-ney test was then applied to substantiate the above results. The test depicts that there is no significant dif-ference (p D.862) on their perception about their ability
to understand the management courses (see Table 2). This reflects that both the genders are equally overconfi-dent when it comes to their ability. These results are in line with previous studies (Clayson, 2005; Kennedy, Lawton, & Plummee, 2002).
At the microlevel, we also investigated the first objective of the study, that is, overconfidence among management students. Simple frequency tables were used for the first variable on the ability to understand management courses. Of the total students, a majority of the students considered themselves to be moderately to highly able. If we consider only those students who opted for highly able, then they are around 36% (see Table 3); of this, 59% (68 of 115) were women and 41% (47 of 115) were men (see Table 3). This depicts that higher number of female students displayed overconfidence than male students.
When we link this perception of the students about them-selves on ability to understand management courses with their perception about grades and their actual grades, then
we can decipher whether they have a tendency to overesti-mate their ability or not. As shown in Table 5, exactly half of the students have actually scored bad grades but they still consider their grades good, which displays their
TABLE 5
Grade Range£Ability to Understand£Grade Perception Cross-Tabulation
Ability to understand
Grade perception Highly able Moderately able Neither able nor unable Moderately unable Highly unable Total
Bad grade range
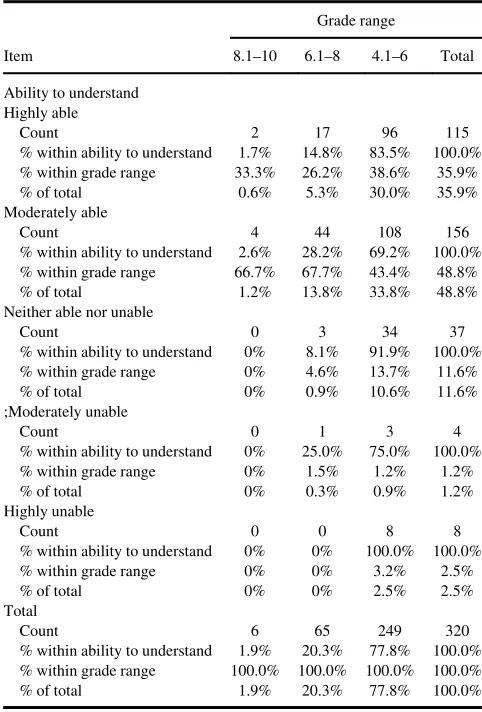
Ability to Understand£Grade Range Cross-Tabulation
Grade range
Item 8.1–10 6.1–8 4.1–6 Total
Ability to understand Highly able
Count 2 17 96 115
% within ability to understand 1.7% 14.8% 83.5% 100.0% % within grade range 33.3% 26.2% 38.6% 35.9%
% of total 0.6% 5.3% 30.0% 35.9%
Moderately able
Count 4 44 108 156
% within ability to understand 2.6% 28.2% 69.2% 100.0% % within grade range 66.7% 67.7% 43.4% 48.8%
% of total 1.2% 13.8% 33.8% 48.8%
Neither able nor unable
Count 0 3 34 37
% within ability to understand 0% 8.1% 91.9% 100.0% % within grade range 0% 4.6% 13.7% 11.6%
% of total 0% 0.9% 10.6% 11.6%
;Moderately unable
Count 0 1 3 4
% within ability to understand 0% 25.0% 75.0% 100.0% % within grade range 0% 1.5% 1.2% 1.2%
% of total 0% 0.3% 0.9% 1.2%
Highly unable
Count 0 0 8 8
% within ability to understand 0% 0% 100.0% 100.0% % within grade range 0% 0% 3.2% 2.5%
% of total 0% 0% 2.5% 2.5%
Total
Count 6 65 249 320
% within ability to understand 1.9% 20.3% 77.8% 100.0% % within grade range 100.0% 100.0% 100.0% 100.0%
% of total 1.9% 20.3% 77.8% 100.0%
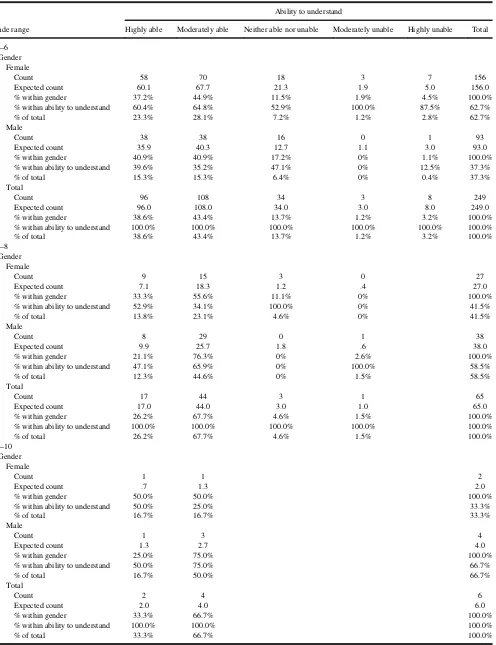
TABLE 7
Gender£Ability to Understand£Grade Range Cross-Tabulation
Ability to understand
Grade range Highly able Moderately able Neither able nor unable Moderately unable Highly unable Total
4.1–6 Gender
Female
Count 58 70 18 3 7 156
Expected count 60.1 67.7 21.3 1.9 5.0 156.0
% within gender 37.2% 44.9% 11.5% 1.9% 4.5% 100.0%
% within ability to understand 60.4% 64.8% 52.9% 100.0% 87.5% 62.7%
% of total 23.3% 28.1% 7.2% 1.2% 2.8% 62.7%
Male
Count 38 38 16 0 1 93
Expected count 35.9 40.3 12.7 1.1 3.0 93.0
% within gender 40.9% 40.9% 17.2% 0% 1.1% 100.0%
% within ability to understand 39.6% 35.2% 47.1% 0% 12.5% 37.3%
% of total 15.3% 15.3% 6.4% 0% 0.4% 37.3%
Total
Count 96 108 34 3 8 249
Expected count 96.0 108.0 34.0 3.0 8.0 249.0
% within gender 38.6% 43.4% 13.7% 1.2% 3.2% 100.0%
% within ability to understand 100.0% 100.0% 100.0% 100.0% 100.0% 100.0%
% of total 38.6% 43.4% 13.7% 1.2% 3.2% 100.0%
6.1–8 Gender
Female
Count 9 15 3 0 27
Expected count 7.1 18.3 1.2 .4 27.0
% within gender 33.3% 55.6% 11.1% 0% 100.0%
% within ability to understand 52.9% 34.1% 100.0% 0% 41.5%
% of total 13.8% 23.1% 4.6% 0% 41.5%
Male
Count 8 29 0 1 38
Expected count 9.9 25.7 1.8 .6 38.0
% within gender 21.1% 76.3% 0% 2.6% 100.0%
% within ability to understand 47.1% 65.9% 0% 100.0% 58.5%
% of total 12.3% 44.6% 0% 1.5% 58.5%
Total
Count 17 44 3 1 65
Expected count 17.0 44.0 3.0 1.0 65.0
% within gender 26.2% 67.7% 4.6% 1.5% 100.0%
% within ability to understand 100.0% 100.0% 100.0% 100.0% 100.0%
% of total 26.2% 67.7% 4.6% 1.5% 100.0%
8.1–10 Gender
Female
Count 1 1 2
Expected count .7 1.3 2.0
% within gender 50.0% 50.0% 100.0%
% within ability to understand 50.0% 25.0% 33.3%
% of total 16.7% 16.7% 33.3%
Male
Count 1 3 4
Expected count 1.3 2.7 4.0
% within gender 25.0% 75.0% 100.0%
% within ability to understand 50.0% 75.0% 66.7%
% of total 16.7% 50.0% 66.7%
Total
Count 2 4 6
Expected count 2.0 4.0 6.0
% within gender 33.3% 66.7% 100.0%
% within ability to understand 100.0% 100.0% 100.0%
% of total 33.3% 66.7% 100.0%
204 V. SHARMA AND M. SHAKEEL
overconfidence. Splitting this result based on gender depicts that, of 58 students 41% of the male students had a ten-dency to overestimate their ability, which is less than that of female students, 59% (see Table 4). One reason for this could be that young men often grow up expecting to work and take over the responsibility of their family while females are still less likely to grow up believing they must support their family (Duffy & Atwater, 2011). Therefore, the conjecture that could be made is that even though the marks of more female students were bad they considered them good and was otherwise for male students. On the other hand, there were 33% of the students who had actu-ally earned bad grades and considered their grades bad. However, they perceived themselves to be highly able. This displays their psychological thought process that it was not the lack of ability due to which they got bad grades; rather there were other factors that might have been the reasons for their grades such as those mentioned in question 2 of the questionnaire (Appendix; see Table 5).
Another analysis was conducted on ability to under-stand and actual grade scored by the students. It was found that majority of the total population, irrespective of gender, considered themselves to be moderately to highly able on understanding management courses. However, when the actual grades were seen, 78% of the students have scored the lowest grade (see Table 6). When the same analysis was conducted gender wise, 84% (156 of 185) of the female students were found to be lying in the lowest grade category. Interestingly, of these 156 female students, 82% rated themselves to be highly to moderately able. Similarly, 68% (93 of 135) of the male students were found to be lying in the low-est grade category. Of these 93 male students, 81% rated themselves to be highly to moderately able (see Table 7).
These results were substantiated by the Mann-Whitney test. It was found that there was no significant difference in grade perception, and ability perception; however, ironi-cally there was a significant difference in the actual grades scored by male and female students. Thus, it can be inferred that female students are more over-confident compared to the male students.
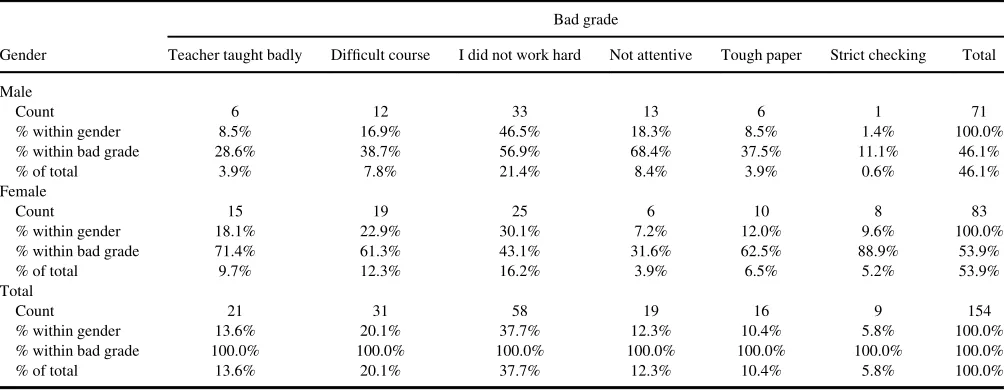
To investigate the second objective of the study that is, SAB among management students, cross-tabulation was first conducted on actual bad grade scored. It was found that in 50% of the total students, SAB was missing. Com-paring male students with the female students, 35% of the male students depicted SAB, while 63% of the females showed SAB (see Table 8).
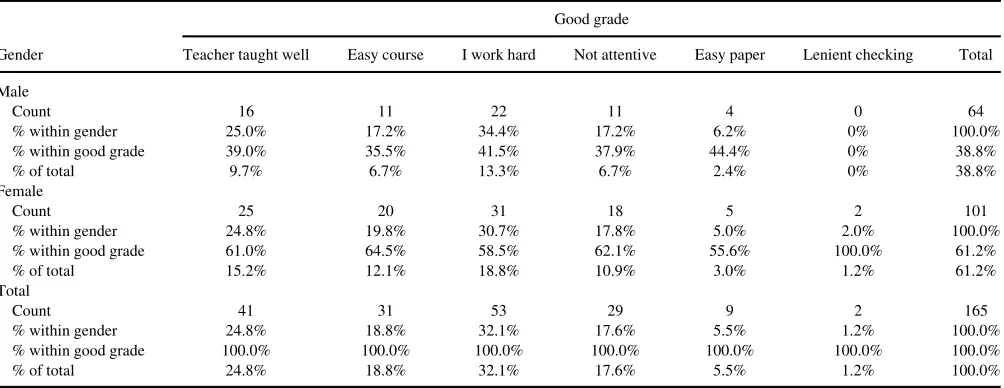
Surprisingly when the same analysis was conducted on actual good grade scored, again among 50% of the total stu-dents, SAB was found. Comparing male students with female students almost equal percentages of the male and female students displayed SAB (see Table 9).
CONCLUSION AND RECOMMENDATIONS
The results imply that majority of the students considered themselves to be highly able. Almost equal numbers of male and female students thought the same. However, more of the male students seemed to be modest relative to the female students. A negligible number of students under-rated themselves. This can further be supported by compar-ing their ability with their grade perception or by comparing their ability perception with their actual grades.
The analysis depicts that almost half of the sample size considered their grades to be bad. Wherein from this it can be deduced that there are two observations; first, that these students have actually scored good grades but this may not
TABLE 8
Gender£Bad Grade Cross-Tabulation
Bad grade
Gender Teacher taught badly Difficult course I did not work hard Not attentive Tough paper Strict checking Total
Male
Count 6 12 33 13 6 1 71
% within gender 8.5% 16.9% 46.5% 18.3% 8.5% 1.4% 100.0%
% within bad grade 28.6% 38.7% 56.9% 68.4% 37.5% 11.1% 46.1%
% of total 3.9% 7.8% 21.4% 8.4% 3.9% 0.6% 46.1%
Female
Count 15 19 25 6 10 8 83
% within gender 18.1% 22.9% 30.1% 7.2% 12.0% 9.6% 100.0%
% within bad grade 71.4% 61.3% 43.1% 31.6% 62.5% 88.9% 53.9%
% of total 9.7% 12.3% 16.2% 3.9% 6.5% 5.2% 53.9%
Total
Count 21 31 58 19 16 9 154
% within gender 13.6% 20.1% 37.7% 12.3% 10.4% 5.8% 100.0%
% within bad grade 100.0% 100.0% 100.0% 100.0% 100.0% 100.0% 100.0%
% of total 13.6% 20.1% 37.7% 12.3% 10.4% 5.8% 100.0%
correspond to their actual ability to understand management courses. Second, that these students have actually scored bad grades, which depicts that they are overestimating the accuracy of their knowledge (i.e., overconfidence). It is also observed that more of the female students have a ten-dency of being overconfident.
While comparing ability to understand management courses with the actual grades of the students, it was again substantiated that management students are overconfident. As a majority of the students who rated their ability to understand was high, a major chunk of the students actually scored the lowest grades, ranging between 4.1 and 6.
It was also observed that there exists a SAB among man-agement students. However, gender-wise breakup of the students those who displayed SAB depicted that more female (almost double) students portrayed SAB specifically when bad grades were scored. On the other hand, when good grades were scored by female students, this percent-age declined to the percentpercent-age of male students, which increased in this case. Therefore, it can be said that in case of female students when something bad happens to them SAB becomes more prominent.
This study was an attempt to find out the presence of overconfidence and SABs among management students. The results indicate the presence of both. Although, it gets different when gender-wise comparisons were made.
The results of this study could have significant implica-tions, given an insight into the fact that most of the manage-ment students are still lacking in certain skills, which they do not realize and hence are not employable. Therefore, there is a need for students and institutions to understand the existence of overconfidence and SAB and to take meas-ures such as to come up with the counseling sessions and/or
foundation courses before the students actually begin their classes formally. Students indeed can be trained to perform better.
REFERENCES
Arkes, H. R. (2001). Overconfidence in judgmental forecasting. In J. S. Armstrong (Ed.),Principles of forecasting(pp. 495–515). Boston, MA: Kluwer Academic.
Bandura, A. (1993). Perceived self-efficacy in cognitive development and functioning.Educational Psychologist,28, 117–148.
Bradley, G. W. (1978). Self-serving biases in the attributional process: A reexamination of fact or fiction question.Journal of Personality and Social Psychology,36, 56–71.
Brockner, J. (1996). An integrative framework for explaining reactions to decision: Interactive effects of outcomes and procedures.Psychological Bulletin,180, 189–208.
Burns, R., & Burns, A. (2008).Business research methods and statistics using SPSS. Thousand Oaks, CA: Sage.
Camerer, C., & Lovallo, D. (1999). Overconfidence and excess entry: An experimental approach.American Economic Review,89, 306–318. Clayson, D. E. (2005). Performance overconfidence: Metacognitive effects
or misplaced student expectation?Journal of Marketing Education,27, 122–129.
Duffy, K. G., & Atwater, E. (2011).Psychology for living(8th ed.). New Delhi, India: Pearson.
Falchikov, N., & D. Boud. (1989). Student self-assessment in higher edu-cation: A meta-analysis.Review of Educational Research,59, 395–430. Fischhoff, B., & Slovic, P. (1980). A little learning. . .confidence in
multi-cue judgment.Attention and Performance,8, 8.
Fischhoff, B., Slovic, P., & Lichtenstein, S. (1977). Knowing with cer-tainty: The appropriateness of extreme confidence.Journal of Experi-mental Psychology,3, 552–564.
Greenberg, J., Pyszczynski, T. T., & Solomon, S. (1982). The self-serving attributional bias: Beyond self-presentation. Journal of Experimental Social Psychology,18, 56–67.
Grimes, P. W. (2002). The overconfident principles of economics students: An examination of a metacognitive skill.Journal of Economic Educa-tion,33, 15–30.
TABLE 9
Gender£Good Grade Cross-Tabulation
Good grade
Gender Teacher taught well Easy course I work hard Not attentive Easy paper Lenient checking Total
Male
Count 16 11 22 11 4 0 64
% within gender 25.0% 17.2% 34.4% 17.2% 6.2% 0% 100.0%
% within good grade 39.0% 35.5% 41.5% 37.9% 44.4% 0% 38.8%
% of total 9.7% 6.7% 13.3% 6.7% 2.4% 0% 38.8%
Female
Count 25 20 31 18 5 2 101
% within gender 24.8% 19.8% 30.7% 17.8% 5.0% 2.0% 100.0%
% within good grade 61.0% 64.5% 58.5% 62.1% 55.6% 100.0% 61.2%
% of total 15.2% 12.1% 18.8% 10.9% 3.0% 1.2% 61.2%
Total
Count 41 31 53 29 9 2 165
% within gender 24.8% 18.8% 32.1% 17.6% 5.5% 1.2% 100.0%
% within good grade 100.0% 100.0% 100.0% 100.0% 100.0% 100.0% 100.0%
% of total 24.8% 18.8% 32.1% 17.6% 5.5% 1.2% 100.0%
206 V. SHARMA AND M. SHAKEEL
Heath, C., & Tversky, A. (1991). Preference and belief: Ambiguity and competence in choice under uncertainty.Journal of Risk and Uncertain-ity,4, 5–28.
Isley, P., & H. Singh. (2005). Do higher grades lead to favorable student evaluations?Journal of Economic Education,36, 29–42.
Johnson, D. D. P., McDermott, R., Barrett, E. S., Cowden, J., Wrangham, R., McIntyre, M. H., & Rosen, S. P. (2006). Overconfidence in wargames: Experimental evidence on expectations, aggression, gender and testoster-one.Proceedings of the Royal Society of London B,273, 2513–2520. Kennedy, E. J., Lawton, L., & Plummee, E. L. (2002). Blissful ignorance:
The problem of unrecognized incompetence and academic performance.
Journal of Marketing Education,24, 243–52
Keren, G. (1991). Calibration and probability judgment: Conceptual and methodological issues.Acta Psychologica,77, 217–273.
Koriat, A., Lichtenstein, S., & Fischhoff, B. (1980). Reasons for confi-dence. Journal of Experimental Psychology: Human Learning and Memory,6, 107–118.
Kruger, J., & D. Dunning. (1999). Unskilled and unaware of it: How difficulties in recognizing one’s own incompetence lead to inflated self-assessments. Journal of Personality and Social Psychology, 77, 1121–34.
Langer, E. J., & Roth, J. (1975). Heads I win, tails it’s chance: The illusion of control as a function of the sequence of outcomes in a purely chance task.Journal of Personality and Social Psychology,
32, 951–955.
Lee, J. W., Yates, J. F., Shinotsuka, H., Singh, R. H., Onglatco, M. L. U., Yen, N. S.,. . .Bhatnagar, D. (1995). Cross-national differences in
over-confidence.Asian Journal of Psychology,1, 63–68.
Millea, M., & Grimes, P. W. (2002). Grade expectations and student evalu-ation of teaching.College Student Journal,36, 582–591.
Miller, D. T., & Ross, M. (1975). Self-serving biases in attribution of cau-sality: Fact or fiction?Psychological Bulletin,82, 213–225.
Niederle, M., & Vesterlund, L. (2007). Do women shy away from competi-tion? Do men compete too much?Quarterly Journal of Economics,122, 1067–1102.
Nowell, C., & Alston, R. M., (2007). I thought I got an A! Overconfidence across the economics curriculum.Journal of Economic Education,38, 131–142.
O’Laughlin, E. M., & Brubaker, B. S. (1998). Use of landmarks in cogni-tive mapping: gender differences in self-report versus performance. Per-sonality and Individual Differences,24, 595–601.
Pajares, F., & Miller, M. D. (1994). Role of self-efficacy and self-concept beliefs in mathematical problem solving: A path analysis.Journal of Educational Psychology,86, 193–203.
Philips, L. D., & Wright, G. N. (1977). Cultural differences in viewing uncertainty and assessing probabilities. In H. Jungermann & G. de Zeeuw (Eds.),Decision making and change in human affairs(pp. 507– 519). Amsterdam, the Netherlands: Springer.
Pyszczynski, T., Greenberg, J., & LaPrelle, J. (1985). Social comparison after success and failure: Biased search for information consistent with a self-serving conclusion. Journal of Experimental Psychology, 21, 195–211.
Rabin, M., & Schrag, J. L. (1999). First impressions matter: A model of confirmatory bias.The Quarterly Journal of Economics,114, 37–82. Seifert, T. L. (2004). Understanding student motivation. Educational
Research,46, 137–149.
Taylor, J., & Reiss, M. (1989). “Self-serving” attributions to balanced causal factors: A field experiment.Personality and Social Psychology,
50, 974–991.
Yates, J. F. (1990).Judgment and decision making. Englewood Cliffs, NJ: Prentice Hall.
Yates, J. F., Lee, J. W., & Shinotsuka, H. (1996). Beliefs about overconfi-dence, including its cross-national variation.Organizational Behavior and Human Decision Processes,65, 138–147.
APPENDIX: QUESTIONNAIRE
Gender: Male: __________ Female: __________
Q1: How would you rate yourself on the ability to under-stand Management courses? (Please tick your response)
Highly able: __________ Moderately able: __________ Neither able nor unable: _____ Moderately unable: ______ Highly unable: __________
Q2(a): If you got bad grades/marks then the reason that you attribute to this is: - (Please tick only one option from the followings):
1. Teacher/s taught badly. 2. The course/s was difficult. 3. I did not work hard.
4. I was not attentive in the class. 5. The paper was tough.
6. Paper checking was strict.
(OR)
Q2(b): If you got good grades/marks then the reason that you attribute to this is (Please tick only one option from the followings):
1. Teacher/s taught very well. 2. The course/s was easy. 3. I worked hard.
4. I was attentive in the class. 5. The paper was easy. 6. Paper checking was lenient.
Please write down your commutative grades (CGPA) up to the last semester you passed.
Grades: __________