Energy
and
Air
Pollution
Energy
and
Air
Pollution
World
Energy
Outlook
INTERNATIONAL ENERGY AGENCY
The International Energy Agency (IEA), an autonomous agency, was established in November 1974. Its primary mandate was – and is – two-fold: to promote energy security amongst its member countries through collective response to physical disruptions in oil supply, and provide authoritative research and analysis on ways to ensure reliable, affordable and clean energy for its 29 member countries and beyond. The IEA carries out a comprehensive programme of energy co-operation among its member countries, each of which is obliged to hold oil stocks equivalent to 90 days of its net imports. The Agency’s aims include the following objectives:
n Secure member countries’ access to reliable and ample supplies of all forms of energy; in particular, through maintaining effective emergency response capabilities in case of oil supply disruptions.
n Promote sustainable energy policies that spur economic growth and environmental protection in a global context – particularly in terms of reducing greenhouse-gas emissions that contribute
to climate change.
n Improve transparency of international markets through collection and analysis of energy data.
n Support global collaboration on energy technology to secure future energy supplies and mitigate their environmental impact, including through improved energy
efficiency and development and deployment of low-carbon technologies.
n Find solutions to global energy challenges through engagement and dialogue with non-member countries, industry, international
organisations and other stakeholders.
IEA member countries:
Australia Austria Belgium Canada Czech Republic Denmark Estonia Finland France Germany Greece Hungary Ireland Italy Japan Korea Luxembourg Netherlands New Zealand Norway
Poland Portugal
Slovak Republic Spain
Sweden Switzerland
Turkey
United Kingdom United States
The European Commission © OECD/IEA, 2016
International Energy Agency 9 rue de la Fédération 75739 Paris Cedex 15, France
www.iea.org
Please note that this publication is subject to speciic restrictions that limit its use and distribution.
Together Secure
Foreword 3
Foreword
Around 18 000 people die each day as a result of air pollution. In fact, the number of deaths attributed to air pollution each year – 6.5 million deaths – is, according to the World Health Organization (WHO), much greater than the number from HIV/AIDS, tuberculosis and road injuries combined. Air pollution also brings major costs to the economy and damage to the environment. Energy production and use is the most important source of air pollution coming from human activity and so, for these reasons, the IEA has – for the first time – undertaken a major study on the role of energy in air pollution.
This study – released as a World Energy Outlook (WEO) Special Report – reflects the IEA’s new vision. An IEA that is truly international in its outlook must tackle the issues of greatest concern to developing, as well as developed, countries. No country can claim to have fully overcome the air pollution challenge, and the IEA is uniquely placed to bring decision makers together and provide evidence-based analysis and policy advice. In establishing itself as a global hub for clean and efficient energy, the IEA is seeking to help all countries of the world overcome the negative environmental impacts of energy use.
Our energy system contributes vitally to economic and social progress around the world. But there are costly side-effects. Millions of tonnes of energy-related pollutants are released each year, be it the harmful emissions from using traditional biomass for cooking, as is still common practice today for 2.7 billion people; or the emissions from cars and trucks, factories, power plants and other sources. This is not a problem that economies can expect to grow out of as they become wealthier, but one that will endure until concerted transformative action is taken.
Fortunately, there are solutions at hand. This is what this WEO Special Report demonstrates. It presents a strategy – in the form of a Clean Air Scenario – in which the energy sector pushes air pollution levels into a steep decline in all countries. The technologies for doing so exist and are in widespread use today. They can be applied at great net economic benefit. Concerted efforts, across areas of responsibility and between nations are required. First and foremost, a more concentrated effort needs to be made to tackle energy poverty in developing countries. Second, steps must be taken to reduce pollutant emissions through post-combustion control technologies. And third, emissions can be avoided entirely, through promoting clean forms of energy around the world. Such actions can help avoid millions of pollution-related deaths. Greenhouse-gas emissions would also be cut and fossil-fuel import bills reduced. To achieve all of this, cumulative investment in energy supply, end-use energy efficiency and pollution controls from now to 2040 needs to be no more that 7% higher than otherwise expected. This can be achieved.
One of the main conclusions of this study is that the energy sector must work closely with a range of stakeholders to tackle air pollution successfully. I am pleased to say that this WEO Special Report has been conducted in precisely this vein, with the co-operation of many
© OECD/IEA,
emerging countries, research institutions and distinguished experts from around the world helping to make this groundbreaking study possible. I would like to thank the WEO team at the IEA for their excellent work and Herculean effort.
Modern energy is hugely important, but clean air is our most precious resource.
Dr. Fatih Birol Executive Director International Energy Agency
Acknowledgements 5
Acknowledgements
This report was prepared by the World Energy Outlook (WEO) team in the Directorate of Sustainability, Technology and Outlooks (STO) in co-operation with several divisions of the IEA. The Director of STO, Kamel Ben Naceur, provided guidance throughout the project. The study was designed and directed by Laura Cozzi, Head of the WEO Energy Demand Outlook Division. Timur Gül led overall modelling, Chapter 2 and all the country profiles. Dan Dorner and Tim Gould, Head of the WEO Energy Supply Outlook Division, co-led Chapters 1 and 3. Principal contributors to the report were: Ali Al-Saffar, Elie Bellevrat, Philippe Benoit, Stéphanie Bouckaert, Pierpaolo Cazzola, Hannah Daly, Olivier Durand-Lasserve, Matthew Gray, Sixten Holm, Peter Janoska, Fabian Kęsicki, Claudia Pavarini, Kristine Petrosyan, Jacob Teter, Johannes Trüby, David Wilkinson and Shuwei Zhang. Other contributors were Zakia Adam, Liwayway Adkins, Carlos Andrade, Ian Cronshaw, Araceli Fernandez Pales, Nathan Frisbee, Vincenzo Franza, Bartosz Jurga, Markus Klingbeil, Atsuhito Kurozumi, Paul Hugues, Rodolfo Lobato, Christophe McGlade, Luis Munuera, Paweł Olejarnik, Rakyung Park, Andrew Seah, Toshiyuki Shirai, Benjamin Smith and Brent Wanner. Teresa Coon provided essential support.
Robert Priddle carried editorial responsibility.
The report benefited from valuable inputs, comments and feedback from the senior management and from several colleagues within the IEA: Paul Simons, Keisuke Sadamori, Rebecca Gaghen, Duncan Millard, Laszlo Varro, Paolo Frankl, Brian Motherway, Simon Bennett, Florian Kitt, Christina Hood, Joerg Husar, Cédric Philibert and Kevin Tu.
Thanks go to the IEA’s Communication and Information Office for their help in producing the final report, particularly Astrid Dumond for production and to Bertrand Sadin for graphics. Debra Justus was the copy-editor.
Experts from the International Institute of Applied System Analysis (IIASA) were key contributors to the report, particularly Markus Amann, Jens Borken-Kleefeld, Janusz Cofala, Chris Heyes, Gregor Kiesewetter, Zbigniew Klimont, Pallav Purohit, Peter Rafaj, Robert Sander and Wolfgang Schoepp.
A workshop of international experts was organised by the IEA to gather essential input to this study and was held on 10 March 2016 in Paris. The workshop participants offered valuable insights, feedback and data for this analysis.
This work could not have been achieved without the support provided by the Ministry of Economy, Trade and Industry, Japan; UNEP Clean Air Coalition; ClimateWorks and Toyota.
Many experts from outside of the IEA provided input, commented on the underlying analytical work and/or reviewed the report. Their comments and suggestions were of great value. They include:
Heather Adair-Rohani World Health Organization
Martin Adams European Environment Agency (EEA)
© OECD/IEA,
Shardul Agrawala OECD
Rosemary Albinson Castrol
Doug Arent National Renewable Energy Laboratory (NREL), US
Glynda Bathan Clean Air Asia
Markus Becker General Electric
Anshu Bharadwaj Center for Study of Science, Technology and Policy (CSTEP)
Daniel Bongardt GIZ
José Ignacio Botello Martinez REPSOL
Michael Brauer University of British Columbia
Nigel Bruce University of Liverpool
Lilian Busse German Environment Agency (UBA)
Emanuela Colombo Politecnico di Milano
Audrey de Nazelle Imperial College
Hem Dholakia Council on Energy, Environment and Water, India
Carlos Dora Department of Public Health and Environment, WHO
Jane Olga Ebinger Sustainable Energy for All (SE4ALL)
Mats Fredriksson International Gas Union (IGU)
David Hawkins Natural Resources Defense Council (NRDC), US
Kebin He Tsinghua University, China
Michael Holland Econometrics Research and Consulting (EMRC)
Florent Journet-Cuenot Total
Marlis Kees GIZ
Jiang Kejun Energy Research Institute (ERI), China
Michael Kelly World LPG Association
Shinichi Kihara Ministry of Energy, Trade and Industry (METI), Japan
Patrick Kinney The Earth Institute, Columbia University
Vincent Kitio UN-habitat
Takayuki Kusajima Toyota Motor Corporation
Johan Kuylenstierna Stockholm Environment Institute at York
Elisa Lanzi OECD
Francisco Laveron Iberdrola
Karine Leger Airparif
Sunday Leonard UNEP Climate and Clean Air Coalition
Magnus Lindgren Swedish Transport Administration
Christine Loh Ministry for the Environment, Hong Kong, China
Julio Lumbreras Technical University of Madrid (UPM), Spain
Rob Maas National Institute for Public Health and the Environment
(RIVM), Netherlands
Antonio Mediavilla-Sahagún Secretariat of Environment of Mexico City (SEDEMA)
François-Régis Mouton GasNaturally
Lauri Myllyvirta Greenpeace
Ted Nace CoalSwarm
Acknowledgements 7
Hermine Nalbandian Sugden IEA Clean Coal Centre
Anthony Nyong African Development Bank (AfDB)
Ari Rabl Ecole des Mines
Mark Radka United Nations Environment Programme (UNEP)
Veerabhadran Ramanathan University of California
Anil Razdan Former Secretary, Ministry of Power, Government of
India
Alan Reid Concawe
Teresa Ribera Institute for Sustainable Development and International
Relations (IDDRI) Matteo Vincenzo Rocco Politecnico di Milano
David Rodgers Global Environment Facility (GEF)
Deger Saygin International Renewable Energy Agency (IRENA)
Christoph Schmidl Bioenergy 2020
Jitendra Shah Asian Development Bank
Sumit Sharma Energy and Resources Institute (TERI), India
Jeb Stenhouse US Environmental Protection Agency
Jessica Strefler Potsdam Institute for Climate Impact Research
Brian Sullivan IPIECA
Kuniharu Takemata J-Power
Eddy Van Bouwel ExxonMobil
Thomas Verheye European Commission
Elisabetta Vignati EC Joint Research Centre (JRC)
Qiang Yao Tsinghua University, China
The individuals and organisations that contributed to this study are not responsible for any opinions or judgements it contains. All errors and omissions are solely the responsibility of the IEA.
Comments and questions are welcome and should be addressed to: Laura Cozzi
Head of World Energy Outlook, Energy Demand Outlook Division
Directorate of Sustainability, Technology and Outlooks International Energy Agency
9, rue de la Fédération 75739 Paris Cedex 15 France
Email: [email protected]
More information about the World Energy Outlook is available at
www.worldenergyoutlook.org.
© OECD/IEA,
Annexes
Country
Profiles
CONTENTS
TABLE
OF
PART A
PART B
Global
Energy
and Air
Pollution
Trends
8
9
10
1
2
3
5
7
4
Annexes
India
Southeast Asia
Africa
Energy and air pollution
Outlook for air pollution
Energy action for cleaner air
Mexico
China
United States
European Union
6
© OECD/IEA,
Foreword 3
Acknowledgements 5
Executive summary 13
Part A: Global Energy and Air Pollution Trends
17
Energy and air pollution
19
Introduction 20
Air pollution: causes, concentrations and effects 25
Causes 25
Concentrations 28
Effects 32
The role of energy in air pollution 39
Fossil-fuel production 40
Stationary sources 43
Transport 49
Buildings 55
Outlook for air pollution
57
Introduction: framing the scenarios 58
Policies to tackle energy-related air pollution 59
Scenario definitions 62
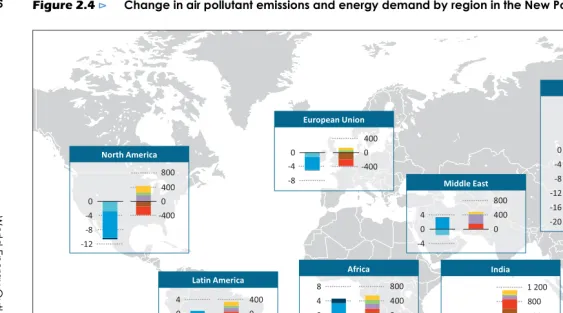
Outlook for energy-related air pollution in the New Policies Scenario 67
Air pollutant trends by region 69
Air pollutant trends by sector 72
Towards cleaner air: energy-related air pollution in the Clean Air Scenario 75
Air pollutant trends by region 78
Air pollutant trends by sector 81
Health benefits and costs of improving air quality 83
Health benefits of cleaner air 84
Cost of air pollution mitigation 92
Energy action for cleaner air
95
Three steps to cleaner air 96
Setting an ambitious long-term air quality goal 96 Putting in place a clean air strategy for the energy sector 101 Effective monitoring, enforcement, evaluation and communication 108
Aligning clean air policies with energy policy objectives 114
Clean air and climate change 114
Clean air and energy access 118
Energy security and import bills 121
1
2
3
Table of Contents 11
Part B: Country Profiles
123
United States
125
The energy and air quality context 125
The outlook for air quality to 2040: the New Policies Scenario 130 Improving the outlook for air quality to 2040: the Clean Air Scenario 138
Mexico
141
The energy and air quality context 141
The outlook for air quality to 2040: the New Policies Scenario 143 Improving the outlook for air quality to 2040: the Clean Air Scenario 149
European Union
153
The energy and air quality context 154
The outlook for air quality to 2040: the New Policies Scenario 157 Improving the outlook for air quality to 2040: the Clean Air Scenario 165
China
169
The energy and air quality context 170
The outlook for air quality to 2040: the New Policies Scenario 172 Improving the outlook for air quality to 2040: the Clean Air Scenario 184
India
189
The energy and air quality context 190
The outlook for air quality to 2040: the New Policies Scenario 193 Improving the outlook for air quality to 2040: the Clean Air Scenario 204
Southeast Asia
209
The energy and air quality context 209
The outlook for air quality to 2040: the New Policies Scenario 214 Improving the outlook for air quality to 2040: the Clean Air Scenario 224
Africa
229
The energy and air quality context 230
The outlook for air quality to 2040: the New Policies Scenario 233 Improving the outlook for air quality to 2040: the Clean Air Scenario 240
ANNEXES
243
Annex A. Definitions 245
Annex B. References 253
4
5
6
7
8
9
10
© OECD/IEA,
Executive Summary 13
Executive Summary
Air pollution is a major public health crisis, with many of its root causes and cures to be found in the energy sector. Around 6.5 million deaths are attributed each year to poor air quality, making this the world’s fourth-largest threat to human health, behind high blood pressure, dietary risks and smoking. Without changes to the way that the world produces and uses energy,the ruinous toll from air pollution on human life is set to rise. That is why this World Energy Outlook (WEO) Special Report is dedicated, for the first time, to the links between energy, air pollution and health. It sets out in detail the scale, causes and effects of the problem and the ways in which the energy sector can contribute to a solution.
Energy production and use, mostly from unregulated, poorly regulated or inefficient fuel combustion, are the single most important man-made sources of air pollutant emissions: 85% of particulate matter and almost all of the sulfur oxides and nitrogen oxides. These three pollutants are responsible for the most widespread impacts of air pollution, either directly or once transformed into other pollutants via chemical reactions in the atmosphere. They are emitted mainly as a result of:
Poverty: the wood and other solid fuels that more than 2.7 billion people use for cooking, and kerosene used for lighting (and in some countries also for cooking), create smoky environments that are associated with around 3.5 million premature deaths each year. These effects are felt mostly in developing Asia and sub-Saharan Africa, where incomplete burning of biomass accounts for more than half of emissions of particulate matter. Finer particles, whether inhaled indoors or outdoors, are particularly harmful to health as they can penetrate deep into the lungs.
Fossil fuel-intensive development and urbanisation: coal and oil have powered economic growth in many countries, but their unabated combustion in power plants, industrial facilities and vehicles is the main cause of the outdoor pollution linked to around 3 million premature deaths each year. Coal is responsible for around 60% of global combustion-related sulfur dioxide emissions – a cause of respiratory illnesses and a precursor of acid rain. Fuels used for transport, first and foremost diesel, generate more than half the nitrogen oxides emitted globally, which can trigger respiratory problems and the formation of other hazardous particles and pollutants, including ozone. Cities can easily become pollution hotspots, as they concentrate people, energy use, construction activity and traffic. The impact of urban vehicle emissions is heightened by the fact that they are discharged not from the top of tall chimneys but directly into the street-level air that pedestrians breathe.
The solutions are well known, but the problem is far from being solved
Growing attention to air pollution, together with an accelerating energy transition post-COP21, puts aggregate global emissions of the main pollutants on a slowly declining trend to 2040. Fuel combustion increases steadily in our main scenario, to help meet a one-third rise in global energy demand. But global emissions of particulate matter are projected to
© OECD/IEA,
14 World Energy Outlook 2016 | Special Report fall by 7%, sulfur dioxide by 20% and nitrogen oxides by 10% over the period to 2040. This de-coupling of trends is due, in roughly equal measure, to the application of air pollution control technologies and the broader global transition to cleaner energy. Pollution controls are applied with increasing rigour in the centres of rising energy demand, mostly in Asia, where air quality regulation has struggled to keep pace with rapid industrial development and urbanisation. In parallel, the broader transformation of the energy sector – boosted by the Paris climate agreement – means that more than one-third of the projected growth in energy use is met by sources that do not emit air pollutants: wind, solar, hydro and nuclear power. Another 30% comes from natural gas, which emits less air pollution than other fossil fuels or biomass.
Continued reductions in pollutant emissions across the industrialised world, and the onset of declines in China, are accompanied in our main scenario by modest growth in India and Southeast Asia and more rapid rises in parts of Africa. Emissions of most major pollutants are already falling in many OECD countries, and this trend continues as total energy demand falls, the growth of low-carbon alternatives accelerates and increasingly stringent combustion-control regulations take effect. In China, a strong policy focus on air quality bears fruit and the recent dip in pollutant emissions becomes a long-term trend: emissions of particulate matter are 40% lower by 2040, as energy consumption growth slows, the energy mix diversifies away from coal and strict pollution controls are enforced. In India, the air pollution outlook worsens to 2040 as energy demand rises by 150%, although tighter standards in the power and transport sectors, the replacement of traditional cooking fuels with LPG and ambitious targets for wind and solar, all help to limit the growth in pollutant emissions to around 10%. In the absence of stronger regulation, economic growth in sub-Saharan Africa (excluding South Africa) is set to be accompanied by a steady deterioration in air quality: per capita indicators for GDP and air pollutants in 2040 reach the levels of India today, even though the projected energy mix in sub-Saharan Africa is much less dependent on coal.
Despite the intensified policy efforts, regional demographic trends and rising energy use and urbanisation, especially in developing Asia, mean that the number of premature deaths attributable to outdoor air pollution continues to grow, from 3 million today to 4.5 million in 2040. Asia accounts for almost 90% of the rise in premature deaths: air pollution in a y of the regio ’s growi g cities continues to be a major public health hazard and, indeed, to affect a larger share of an increasingly urban population. In China, for example, an ageing population becomes more vulnerable to the effects of air pollution on human health, even though aggregate pollutant emissions are in decline. The health impacts from household air pollution improve somewhat, but remain severe. Provision of improved cookstoves and alternatives to solid biomass means that the number of people without access to clean cooking facilities is projected to fall by almost 1 billion, to 1.8 billion; as a result, the number of premature deaths attributable each year to household pollution falls from around 3.5 million today to under 3 million in 2040.
Executive Summary 15
A pragmatic, tailored alternative: a Clean Air Scenario
The IEA proposes a cost-effective strategy, based on existing technologies and proven policies, to cut pollutant emissions by more than half compared with our main scenario. This policy path is one in which the energy sector takes determined action, co-ordinated effectively with others, to deliver a comprehensive overall improvement. This WEO special report identifies three key areas for government action:
1. Setting an ambitious long-term air quality goal, to which all stakeholders can subscribe and against which the efficacy of the various pollution mitigation options can be assessed.
2. Putting in place a package of clean air policies for the energy sector to achieve the long-term goal, drawing on a cost-effective mix of direct emissions controls, regulation and other measures, giving due weight to the co-benefits for other energy policy objectives.
3. Ensuring effective monitoring, enforcement, evaluation and communication: keeping a strategy on course requires reliable data, a continuous focus on compliance and on policy improvement, and timely and transparent public information.
The scenario builds on the success already achieved in different parts of the world in improving air quality, by municipal and regional governments (which have often played a pioneering role in developing a policy response to air pollution) and through national and international efforts. It is also mindful of some cautionary tales: for example, the large gap between test data and the higher real-world pollutant emissions from diesel vehicles, which underlines the essential nature of adequate enforcement and compliance.
The measures proposed in the Clean Air Scenario are tailored to different national and regional circumstances, and include effective action to achieve full, universal access to cleaner cooking fuels and to electricity. Given the diversity of local circumstances there can be no uniform policy prescription to improve air quality. The Clean Air Scenario rests instead on a suite of policy measures that – adapted in tailored combinations to reflect different national and regional settings – can bring about the targeted improvement in air quality. Organised in a simple A-I-R typology, these measures:
Avoid pollutant emissions by providing energy services more efficiently or in a way that does not involve fuel combustion. Measures include higher efficiency standards, increased support to non-combustion renewable energy and alternatives to liquids fuels for transport, and improvements in public transport and urban planning.
Innovate to reduce pollution abatement costs via technology improvements that will also reduce costs for the post-Paris energy transition.
Reduce pollutant emissions to the atmosphere, via stringent emissions limits on combustion plants and vehicles, controls on industrial processes, fuel switching to less-polluting fuels and strict regulation of fuel quality.
© OECD/IEA,
16 World Energy Outlook 2016 | Special Report With only a 7% increase in total energy investment over the period to 2040, the Clean Air Scenario produces a sharp improvement in health compared with our main scenario: premature deaths from outdoor air pollution are 1.7 million lower in 2040 and, from household pollution, 1.6 million lower. Investment in the Clean Air Scenario includes an extra $2.3 trillion in advanced pollution control technologies (two-thirds of this to comply with higher vehicle emissions standards) and $2.5 trillion in a more rapid transformation of the energy sector. The resultant benefits are many times more valuable. In 2040, global emissions of sulfur dioxide and nitrogen oxides are more than 50% lower, while emissions of particulate matter fall by almost three-quarters. These reductions are largest in developing countries. As a result, the share of I dia’s populatio e posed to air with a high concentration of fine particles (higher than the least stringent of the World Health Organisation’s i teri targets) falls to less than 20% in 2040 from more than 60% today; in China, this figure shrinks below one-quarter (from well over half), and in Indonesia and South Africa it falls almost to zero. Access to clean cooking for all is instrumental in securing life-saving reductions in particulate emissions. The extra impetus to the energy transition means that global energy demand is nearly 15% lower in 2040 than in our main scenario, thanks to improvements in energy efficiency, while the use of renewables (except biomass) increases more quickly. Of the energy that is combusted, three-quarters is subject to advanced pollution controls by 2040, compared with around 45% today.
Well-designed air quality strategies will have major co-benefits for other policy goals: the Clean Air Scenario provides for an early peak in carbon dioxide emissions, a central objective of the Paris climate change agreement. Air pollution policy cannot be viewed in isolation: it is closely linked not only to policies for energy, but also to those dealing with climate, transport, trade, agriculture, biodiversity and other issues. Reducing pollutant emissions improves water and soil quality, crop yields and, in turn, food security. Improving air quality, via improved efficiency and increased deployment of renewables, goes hand-in-hand with the broader energy sector transformation agreed at COP21. Tackling household air pollution, via the provision of modern energy for cooking and lighting, promotes sustainable development goals dealing with poverty, education and gender equality. Policy makers have to co-ordinate their actions to take into account the potential impacts of action in one area on others and the benefits and disadvantages of the interactions. Measures to address climate change could, for example, lead in some instances to more air pollution: an isolated focus on reducing carbon dioxide emissions by encouraging the use of wood stoves, diesel cars or biofuels, could increase human exposure to fine particles. Similarly, an exclusive focus on direct emissions controls, rather than the package of measures proposed in the Clean Air Scenario, could result in increased commitments to high-carbon energy infrastructure, such as coal-fired power plants. A solutio to the world’s pressing air pollution problem is within reach, but it must be grasped in a way that avoids impeding progress in other domains. Integrated policy approaches are essential and will continue to be promoted by the IEA as it strengthens its role as a global hub for clean and efficient energy: a Clean Air Scenario will bring much more than clean air.
PART A
GLOBAL ENERGY AND AIR POLLUTION TRENDS
PREFACE
Part A of Energy and Air Pollution: World Energy Outlook Special Report presents three chapters.
Chapter 1 provides a concise primer on energy and air quality, first outlining the main causes and effects of air pollution and then focusing on the specific role and responsibilities of the energy sector. It covers the different sources and types of energy-related air pollution, the degree to which the pollutants disperse in different settings and the extent to which their concentrations in the air results in harmful exposure and measurable impacts and damages.
Chapter 2 examines the future prospects for energy and its related emissions, and concludes with an assessment of the costs of substantially eliminating energy-associated air pollutants, compared with the value in terms of human health. This reflects a first-of-a-kind assessment of the outlook for energy-related air pollution by country, sector and pollutant to 2040. The objective is to provide a clear and transparent picture of where the world is heading and guidance on possible areas for future improvement. The analysis is conducted on the basis of two scenarios: the New Policies Scenario, which includes the energy-related components of the Intended Nationally Determined Contributions pledged at COP21, and all existing and planned policies that directly or indirectly contribute to reducing air pollution; and the Clean Air Scenario, which offers a pragmatic set of measures to achieve significant additional reductions in pollutant emissions, using proven energy policies and technologies and tailored to national circumstances.
Chapter 3 builds on the analysis presented in previous chapters to highlight three key areas for action if energy-related air pollution is to be pushed into a steep decline around the world. It also explores the desirable co-benefits – in terms of climate change, energy poverty and energy security – that can be realised through positive action tackling air pollution.
© OECD/IEA,
Chapter 1 | Energy and air pollution 19
Chapter 1
Energy and air pollution
How are they linked?
Hi g h l i g h t s
Air pollution is the fourth greatest overall risk factor for human health worldwide, after high blood pressure, dietary risks and smoking. Latest estimates attribute 6.5 million premature deaths to air pollution. Among the major air pollutants, fine particulate matter is the most damaging to human health, and sulfur oxides, nitrogen oxides and ozone are associated with a range of illnesses. In addition to human health, air pollution poses risks to the environment, the economy and food security.
Air pollutants arising from human activity overwhelmingly derive from energy production and use, mainly the combustion of fossil fuels and biomass. Three key pollutants are examined in detail in this report. Almost all sulfur dioxide and nitrogen oxides emissions to the atmosphere are energy-related, as are some 85% of emissions of particulate matter. Within the energy sector, power generation and industry are the main sources of sulfur dioxide, mostly from coal use. Oil use in vehicles and power generation are the leading emitters of nitrogen oxides. Consumption of biomass, kerosene and coal in the buildings sector, along with industrial use, are responsible for the bulk of the particulate matter reaching the atmosphere.
The concentration of people, e o o i a ti ity a d e ergy de a d i the world’s growing cities means that poor air quality is often regarded as an urban problem. Yet poor air quality also affects many rural communities, particularly where households continue to rely on solid biomass for cooking and kerosene for lighting. Moreover, the major pollutants – including secondary pollutants formed by chemical reactions in the atmosphere – can be transported large distances from their sources.
As the predominant source of air pollution, the energy sector must be at the forefront of action to improve air quality around the world. A range of proven policies and technologies are available to do so. In the United States, European Union and Japan, regulations have helped to achieve a major drop in emissions in some sectors, although challenges remain. In developing Asia, less stringent regulations relating to fuel quality, energy efficiency and post-combustion treatment technologies generally mean that pollutant emissions have risen in line with very rapid growth in energy demand seen in recent years, though improvements in air quality are becoming an increasingly urgent policy priority in many Asian countries. No jurisdiction can claim that the task of tackling air pollution is complete.© OECD/IEA,
20 World Energy Outlook 2016 | Special Report
Introduction
More than eight-out-of-ten people in the world’s urban areas live where the concentration of air pollutants – whether chemicals, soot or other damaging substances introduced into the atmosphere (Box 1.1) – exceeds the World Health Organization’s (WHO) Air Quality Guidelines (WHO, 2006). The result is millions of premature deaths each year and huge costs to the global economy. The energy sector is a motor of economic and social progress, but it is also the largest source of air pollution resulting from human activity, mainly from the combustion of fossil fuels and bioenergy1 (Figure 1.1). Accordingly, the energy sector must be at the forefront of any strategy to improve air quality and, indeed, such considerations are increasingly motivating policymaking in many countries. In recognition of both the gravity of the problem and the importance of the energy sector in its resolution, the International Energy Agency (IEA) has devoted this World Energy Outlook Special Report to the exploration of all facets of this critical issue, working with energy and air quality experts from around the world. Major efforts have been taken to bring together harmonised data, policy assessments, modelling and analysis to provide critical insights for relevant decision makers, particularly in the energy sector.
Box 1.1 ⊳ What is air pollution?
Air pollution is the effect caused by concentrations of solids, liquids or gases in the air that have a negative impact on the surrounding environment and people. There are many such pollutants and they may occur naturally (from dust, wildfires and volcanoes) or from human activity, be visible or invisible, emit an odour or be odourless. Various air pollutants can stay in the atmosphere from minutes to years and, while often considered a local issue, may have a range that is local, national, regional or global.
Primary pollutants are those emitted directly as a result of human activity or natural processes, while secondary pollutants are created from primary pollutants, sunlight and components in the atmosphere reacting with one another. Some examples of air pollutants from human activity include:
Sulfur oxides (SOX), in particular sulfur dioxide (SO2): Fossil fuels, coal and oil contain sulfur to differing degrees and, if not removed beforehand, SOX are released at combustion such as in power generation or industrial processes. If not treated or captured, SOX emissions are released to the atmosphere. Such emissions are linked to adverse health and environmental effects, as well as being a precursor to the formation of secondary particulate matter.
Nitrogen oxides (NOX), nitrogen oxide (NO) and nitrogen dioxide (NO2): NOX stem from high-temperature combustion, mainly in transport and power generation, or from the oxidation of NO to NO2 in the atmosphere. NO2 is a toxic gas and can lead to the formation of particulate matter and ozone.
1
Bioenergy is energy content in solid, liquid and gaseous products derived from biomass feedstocks. It includes solid biomass (wood, charcoal, agricultural and animal waste etc.), biofuels and biogas.
Chapter 1 | Energy and air pollution 21
1
Particulate matter (PM) is a mix of solid/liquid organic and inorganic substances that may be a primary or secondary pollutant. PM is linked to major detrimental health impacts. Size is an important factor in determining these impacts: – oarse parti les are etwee 2.5 and 10 i ro etres (µ ) i dia eter a d fi e parti les are s aller tha .5 µm. The adverse health impacts of PM10 are less severe than those of the fine particles, however, there is a longer history of data on PM10 and even today many cities lack the equipment to monitor outdoor concentrations of PM2.5. Black carbon, a particular type of fine PM, is formed by the incomplete combustion of fossil fuels and bioenergy, and is a short-lived climate pollutant (SLCP).
Carbon monoxide (CO) is a colourless, odourless, toxic gas that comes from the incomplete combustion of road transport fuels, natural gas, coal or wood.
Volatile organic compounds (VOCs) are released from chemicals, solvents or fuels (as well as natural sources) as they evaporate or sublimate into the surrounding air; they are associated with a range of negative health effects. Methane (CH4), the main component of natural gas (also a SLCP), is often considered separately from other VOCs as its characteristics differ.
Ammonia (NH3) is released in relation to agricultural and waste management activities; once in the atmosphere ammonia reacts with oxides of nitrogen and sulfur to form secondary particles.
Ground-level ozone (O3) is formed from NOX and VOCs in the presence of sunlight. At high concentrations, ozone is a pollutant and a SLCP.
Other pollutants include heavy metals such as lead, emitted from industry, power generation, waste incineration and (in some countries) from transport fuels, and mercury, mainly from coal combustion.
Air pollution is often understood as an urban issue and it is true that cities concentrate economic activity and demand for energy services, and, so, tend to experience the most harmful concentrations of air pollution. The precise mix of pollutants and the severity of the health impacts are different from Paris to Delhi, Los Angeles to Lagos, Beijing to Mexico City, but all have air quality that reduces life expectancy. Air pollution does not stop at the city gate: the sources are widespread, sometimes rural in nature and, although some pollutants disperse only locally, others travel large distances in the atmosphere and have regional and global impacts. Many of the world’s poorest o u ities are hea ily e posed to toxic fumes when cooking, or heating and lighting their homes.
The type and level of energy-related air pollutio is ofte li ked to a ou try’s stage of economic development. At low-income levels, households tend to be heavily reliant on solid biomass (as in many developing African and Asian countries) the use of which usually leads to undesirable exposure to particulate matter, a leading cause of premature deaths. As economies industrialise, their use of fossil fuels in power generation and industry
© OECD/IEA,
generally rises, as do resulting emissions of sulfur dioxide and other pollutants. Modern agricultural techniques, which include mechanisation, intensified farming and the use of chemical fertilisers and pesticides, can result in higher levels of air pollution, as well as having other environmental impacts. As incomes rise further, household air pollution may subside (if consumers switch to cleaner sources of energy), but demand is unleashed for more energy services, including electricity for appliances and oil for transport, potentially resulting in higher emissions of sulfur oxides, nitrogen oxides and other pollutants. Demographic changes that often occur in parallel with the earlier stages of economic development, such as a growing and more urbanised population, can also boost and concentrate energy-related air pollution.
Figure 1.1 ⊳ Examples of sources of energy-related air pollution
Photo credits: (a) © Bankwatch,https://goo.gl/NYsznY, CC BY-NC-SA 2.0; (b) and (d) © GraphicObsession; (c) © Global Alliance for Clean Cookstoves; (e) © Roberto Venturini, https://goo.gl/FVGrfU, CC BY 2.0.
(a) Fossil-fuelled power plants (par cularly coal and oil)
(e) Non-road transport (airplanes, ships, trains)
(b) Road transport (cars, trucks and two-wheelers)
(d) Industry (combus on and industrial processes)
(f) Mining ac vi es
(c) Residential use of fossil fuels and bioenergy
Chapter 1 | Energy and air pollution 23
1
Box 1.2 ⊳ Which sources and pollutants does this report cover?
This report focuses specifically on the links between energy and air quality, which are complex and multi-faceted and therefore require the boundaries of enquiry to be carefully drawn. For the purposes of this report, it is important to note that:
The focus is on primary air pollution resulting from human activity, with data, analysis and projections in the report excluding emissions from natural sources (which are often very variable, uncertain and beyond the influence of policy makers).
Specifically, this report addresses the role of energy in air pollution. The scope covers energy production, transformation and use, i.e. the entire chain from extraction to final use.
The analysis concentrates on anthropogenic emissions of SO2, NOX and PM, which are predominantly derived from the energy sector and whose effects are among the most damaging.
Actions taken to tackle these pollutants can also help reduce other emissions in some cases, but these co-benefits are not quantified here. The synergies and trade-offs for policies relating to the energy sector, which address air quality and climate change are explored (see Chapter 3), but climate change and greenhouse gases are not a major focus here. (They were the focus in Energy and Climate Change: World Energy Outlook Special Report [IEA, 2015]).
While there is growing evidence of the health impacts from long-term exposure to ozone, specific modelling and analysis of ozone is beyond the scope of this study.
Both combustion and non-combustion emissions are covered (referred to collectively as energy-related emissions):
Combustion emissions are directly linked to fuel burning in boilers, transport and machinery engines, turbines, cookstoves, cement kilns, process heaters, etc.
Non-combustion emissions consist of process emissions in industry and non-exhaust emissions in transport. Process emissions in industry relate to the formation of emitted compounds from non-combustion chemical syntheses or dust production, and stem from activities such as iron and steel, aluminium paper and brick production, mining and chemical and petrochemical production. Non-exhaust emissions are very significant in transport, relating to emissions from the abrasion and corrosion of vehicle parts (e.g. tyres, brakes) and road surfaces, and are (in many cases) still relevant for those vehicles that have no exhaust emissions.
As with any quantitative study, the analysis and projections in this special report rely on the quality of underlying data. Data on air pollution are generally improving, but are still patchy, with incomplete coverage of some countries and pollutants, or reliance on data that are several years old. For this study, a major effort has been undertaken to
© OECD/IEA,
produce estimates of emissions in 2015 and to use them to underpin the energy projections of the IEA and the Greenhouse Gas and Air Pollution Interactions and Synergies (GAINS) model of the International Institute for Applied Systems Analysis (IIASA). This is a notable step forward, but it is important to highlight these estimates may vary from national estimates due to differences in methodology, and that there remains a need for significant further steps to improve the quality, coverage and frequency of air pollution data. That said, the remaining imperfections are not so severe as to undermine the analysis and conclusions of this report.
Governments, at all levels, are far from powerless to tackle this issue: proven policies and technologies are available to address energy-related air pollution. Many countries and parts of the energy sector have amassed, over several decades, considerable experience of how to respond to changing environmental challenges and have developed effective means of decoupling polluting emission levels from rising economic activity. While no jurisdiction can claim that the job is complete, the sort of air pollution disaster seen in London during the Great Smog of 1952 (when visibility was reduced to a few metres) has been relegated to history by environmental regulation and changes in the energy sector. Similarly, in the United States, there has been no return to the elevated pollution levels that characterised many of its cities in the years leading to the Clean Air Act of 1970 (with Los Angeles being the best example of dramatic change). Lower emission fuels, fuel switching, deploying various pollution control systems (for power generation, industry and transport), using more energy-efficient technologies, moving to combustion-free forms of energy supply, and new approaches to urban planning and waste management can all help to deliver benefits simultaneously to health, the quality of life, economic productivity and protection of vulnerable ecosystems. Importantly, retrospective analysis demonstrates that, typically, the benefits far outweigh the costs, offering reassurance that action on air quality need not hamper development. In many cases, policy interventions may simultaneously address air quality and climate change issues, though there can be cases where there are tensions and trade-offs that need to be considered (see Chapter 3).
This chapter aims to provide a concise primer on energy and air quality, first outlining the main causes and effects of air pollution and then focusing on the specific role and responsibilities of the energy sector. It covers the different sources and types of energy-related air pollution, the degree to which the pollutants disperse in different settings and the extent to which their concentrations in the air results in harmful exposure and measurable impact and damage. This report focuses on three key air pollutants: sulfur dioxide, nitrogen oxides and particulate matter (PM2.5 specifically) (Box 1.2). These are the most damaging of the air pollutants derived from energy activities and those for which the most reliable systematic data are available.
Chapter 1 | Energy and air pollution 25
1
Air pollution: causes, concentrations and effects
Causes
Mapping a pathway for air pollution, from sources to impacts, can be a useful way to expose what is, in practice, a complex and multi-faceted issue (Figure 1.2). This process encompasses the initial source of the emissions, how the emissions disperse in the air, any transformation that takes place, the extent to which the population/environment is exposed to the pollutants and at what concentration levels and, ultimately, the consequences that flow from this exposure.
Figure 1.2 ⊳ Mapping air pollution from sources to impacts
Source: IEA adapted from (EEA, 2016).
The energy sector is by far the largest source of air pollution emissions from human activity. They come primarily from the combustion of fossil fuels and bioenergy, but also from coal extraction and other forms of mining (oil sands, uranium) and industrial activities, the processing/washing of coal, transportation of coal and natural gas, oil refining and charcoal production, as well as non-exhaust emissions from the transport sector (mainly tyre and brake wear, and road abrasion).
Energy production and use not only accounts for most of the air pollution arising from human activity, it also accounts for a very high proportion of the human-related emissions
© OECD/IEA,
of some key pollutants. This is true of both sulfur dioxide (SO2) and nitrogen oxides (NOX), emissions of which are almost entirely attributable to energy production and use, and of some 85% of primary PM (Figure 1.3). These three categories of pollutants – SO2, NOX and primary PM – are the main focus of this report.
Figure 1.3 ⊳ Selected primary air pollutants and their sources, 2015
Source: IEA analysis based on IIASA data.
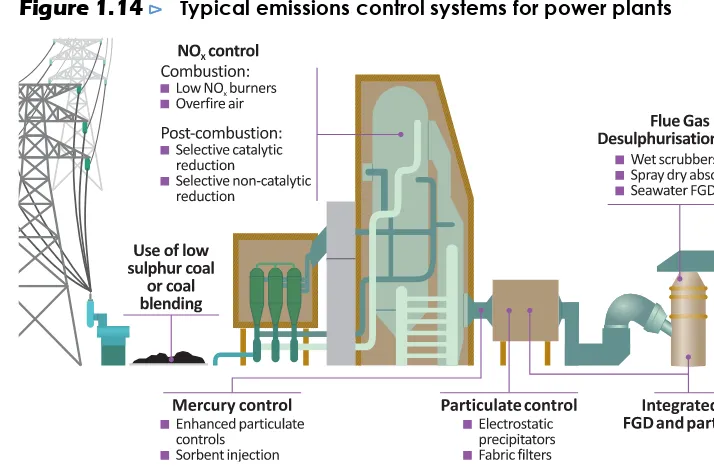
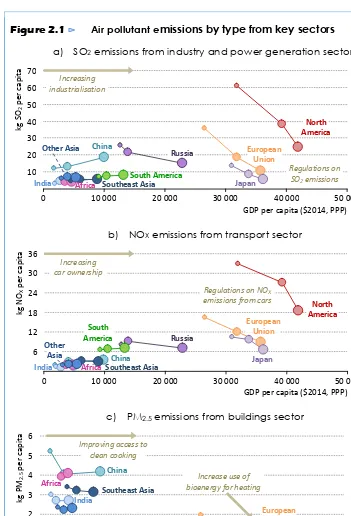
Taking each of the main pollutants in turn, we estimate that, in 2015, the energy sector was responsible for over 80 million tonnes (Mt) of SO2 emissions, with over 45% from industry and one-third from the power sector. Over one-quarter of total energy-related SO2 emissions arose in China (22 Mt), where industry accounts for nearly two-thirds of the total, the power sector having moved rapidly to install various forms of emissions abatement technology over the last decade (Figure 1.4). India was the next largest source of SO2 emissions (9 Mt); a development that is spurring increased regulatory efforts to tackle emissions from a coal-dominated power sector.
At the world level, energy-related emissions of nitrogen oxides continue to increase. They stood at 107 Mt in 2015, with transport accounting for the largest share (over 50%), followed by industry (26%) and power (14%). Increases in NOX emissions in many developing countries have been rapid and these increases have volumetrically outweighed the declines seen in a number of developed countries. China (23 Mt) and the United States (13 Mt) account for one-third of global NOX emissions. Transport is the largest source of such emissions in many world regions, but China is a notable exception with industry being the largest sour e. I dia’s NOX emissions are on an upward path, now having reached a level similar to that of Europe – albeit with a population that is more than twice as large.
Power Combusion of
coal, oil, gas, bioenergy and waste
Transport Exhaust, brake and tyre and
road wear, fuel evaporaion Buildings Cooking, heaing and lighing Industry Fuel combusion, process emissions Fuel supply Extracion, storage, transport and transformaion
of fossil fuels
Chapter 1 | Energy and air pollution 27
1
Figure 1.4 ⊳ Energy-related SO2 emissions by region and sector, 2015
Source: IEA analysis based on IIASA data.
Figure 1.5 ⊳ Energy-related NOX emissions by region and sector, 2015
Source: IEA analysis based on IIASA data.
More than half of global energy-related particulate matter emissions come from the residential sector. The regional picture is heavily skewed towards Africa and Asia (China and India, in particular), with 80% of the global total. PM emissions are due mainly to incomplete combustion of fuels in households, particularly for cooking (bioenergy), heating (bioenergy and coal) and lighting (kerosene). More so than many other major energy-related pollutants, emissions of PM are heavily concentrated in developing countries and in one sector.
© OECD/IEA,
Figure 1.6 ⊳ Energy-related PM2.5 emissions by region and sector, 2015
Source: IEA analysis based on IIASA data.
Concentrations
The main determinants of the concentration of pollutants are the scale and composition of local economic activity, population size and density, the energy mix, the strength of local pollution regulation, and geographic and meteorological conditions that affect pollutant dispersion in the atmosphere.2 Typically, pollutants have a lifetime of no more than a few days and high concentrations correlate with periods of high emissions. For example, transport-related emissions may peak in cities during rush-hour periods, household emissions during the cold seasons, power sector emissions at times of high electricity demand, industrial emissions during the working day and agricultural emissions at particular periods in the growing season. Climate and meteorological conditions (in particular, wind speed, the differences in temperature between atmospheric layers that trap pollutants at ground-level, and heat and sunlight, that contribute to ozone formation) play a major role in explaining the seasonal distribution of episodes of high pollutant concentrations. For instance, in the northern hemisphere, PM episodes happen mostly in winter, while ozone episodes happen in summer. Some persistent pollutants, e.g. toxic metals, get into the food chain and can affect us for years, decades or, in some cases, even centuries.
2
A useful distinction can be made between pollution that is emitted in households (from cooking and heating with traditional biomass or lighting with kerosene) and outdoors (power plants, cars, airplanes). While the pollutants are often the same, and may move from indoors to outdoors and vice versa, the distinction can be important when analysing their impacts (as concentration levels and exposure may be higher indoors) and potential policy interventions.
Chapter 1 | Energy and air pollution 29
1
The relationship between sources and concentrations of air pollution is far from straightforward, complicating the task of measurement and assessment. Primary pollutants can react in the atmosphere to form secondary PM and ozone. For instance, once released in the atmosphere, some of the SO2 and some of the NOX are converted into secondary PM: respectively sulfates and nitrates aerosols. Then, through chemical reactions, condensation or agglomeration, combinations occur with ammonia, black carbon, organic carbon or other substances to form other types of secondary PM of various sizes and chemical composition. In addition, in the presence of heat and sunlight, nitrogen oxide can react with methane, other VOCs or carbon monoxide to form ozone.
The impact of a pollution source depends strongly on the relation between the site, the stack height of the source (where appropriate) and the distribution of the affected population. Such variation with site and stack height is especially strong for primary pollutants, in particular PM. Most power plants and some industrial sources are outside cities and have tall stacks: their pollution is habitually diluted and dispersed before it reaches large population centres. Vehicles, by contrast, emit their pollution much more directly into the air that people breathe. For example, the impact of one kilogramme (kg) of PM2.5 emitted by cars in a metropolis like Paris is two orders of magnitude greater than that of the same kg of PM2.5 emitted from a tall stack in a rural zone. Variation with site and stack height is weaker in the case of ozone and much weaker in the case of sulfate and nitrate aerosols, because these pollutants are formed only gradually over tens (for ozone) to hundreds (for nitrates and sulfates) of kilometres from the source.
Primary pollutants are often characterised as local (though they can, in some instances, move over considerable distances) and secondary particles and ozone are often a transboundary phenomenon. The acidification of lakes across much of northern Europe in the 1970s was due in large part to transboundary emissions. Today, in a city like Paris, high PM episodes often reflect an increase in background concentrations originating from pollutant emissions in other parts of Europe. Global measurements taken at a number of remote sites, e.g. remote islands, with no local sources of pollutants, provide an increasing body of quantitative evidence on the amount of pollutants transported significant distances from where they were emitted, based on satellite and ground-based data. A substantial increase in ozone concentrations has been measured downwind of eastern Asia, while measurements at some locations on the western coasts of Europe and North America clearly show that transcontinental air flows can carry ozone concentrations that approach or exceed air quality standards or objectives (Convention on Long-range Transboundary Air Pollution, 2010).
Density of population and of energy use is a major factor, with many (but not all) types of energy-related activity giving rise to air pollution often being at its most intense in or around cities. More than 3.9 billion people – 54% of the global population – live in urban areas, accounting for around 80% of global economic activity. Cities often provide an efficient means to deliver access to energy services to a large population, but can also introduce challenges, such as road transport congestion and the concentrated emission of
© OECD/IEA,
air pollutants in a heavily populated area. Dense road networks and high volumes of traffic, insufficient mass transportation capacity, building density and building height, topographical and meteorological dynamics can all be air pollution risk factors.
Targets for air quality vary in their coverage and stringency in different countries and regions, but WHO Air Quality Guidelines provide a valuable international reference point for threshold and health risks (Box 1.3). However, today populations around the world live with air quality that consistently fails to meet the annual mean concentration standards for PM set out by the WHO. According to the WHO Global Urban Ambient Air Pollution Database,3 nearly 80% of the population living in those urban areas that monitor air quality are breathing air that does not comply with the WHO air quality guidelines (WHO, 2016a). Air pollution levels in many cities in high-income economies exceed the WHO guidelines. Around 90% of urban Europeans are exposed to levels of air pollutants exceeding WHO guidelines, but less than 10% of Europeans live in cities where air pollutant levels exceed the Europea U io ’s (EU) own (less stringent) air quality standards (European Environment Agency [EEA], 2015). The situation is even more acute in many urban areas of emerging economies, in particular in China and India (Figure 1.7), where concentrations may be many times higher than the WHO guidelines. Such levels are attributable to a combination of pollutants from a very wide variety of emission sources: industry, transportation, roads and construction work (dust), household biomass burning, power generation and open-air waste burning.
Figure 1.7 ⊳ Average annual outdoor PM2.5 concentrations in selected urban
areas
Sources: WHO (2016) Global Urban Ambient Air Pollution Database; Demographia (2015) for population; country groups per income based on World Bank (2016).
3
This database, published in 2016, includes ground-level particulate matter concentrations measured in 3 000 cities, www.who.int/phe/health_topics/outdoorair/databases/cities/en/.
New York Moscow Paris Tehran Bangkok Istanbul 30 60 90 120 150
0 5 10 15 20 25
Population (million inhabitants)
C o nc e nt rat io n ( µg p e r m 3) Karachi Shanghai Manila Mexico Mumbai Guangzhou New Delhi Beijing Seoul Sao Paulo Kolkata Dhaka Cairo Shijiazhuang Lima Patna WHO guideline
Chapter 1 | Energy and air pollution 31
1
Box 1.3 ⊳ How much is too much? WHO guidelines for air quality
The World Health Organization has issued Air Quality Guidelines for a number of air pollutants, including SO2, NO2, PM and ozone (Table 1.1). The guidelines apply worldwide and are based on expert evaluation of the scientific evidence. In the case of PM2.5, in addition to the air quality guideline of annual mean concentration of 10 µg/m3, the WHO has introduced a series of interim targets that are less stringent but represent an attainable set of milestones on the pathway towards better air quality (Table 1.2). In this report, refere e to WHO guideli es is to the ultimate recommended figures not the interim targets (unless otherwise specified).
Table 1.1 ⊳ WHO air quality guidelines for concentrations of PM, NO2 and SO2
PM2.5 PM10 NO2 SO2
Annual mean μg/ 3 μg/ 3 4 μg/ 3 -
24-hour mean 5 μg/ 3 5 μg/ 3 - μg/ 3
1-hour mean - - μg/ 3 -
10-minute mean - - - 5 μg/ 3
Notes: Air quality measurements are typically reported in terms of daily or annual mean concentrations of particles per cubic metre of air olu e, μg/ 3 = micrograms per cubic metre. The guideline values relate to defined time-periods, i.e. a SO2 concentration of 500 µg/m
3
should not be exceeded over an average period of 10-minute duration.
Source: WHO, 2006.
The US Environmental Protection Agency (US EPA) defines maximum values of concentration for six pollutants, including a target of maximum 12 µg/m3 on average for primary PM2.5. The EU standard is currently 25 µg/m
3
, with provision for attainment of the WHO guideline by 2030. China sets the maximum average PM concentration of 35 µg/m3, with time allowed to get this level in some of the most industrialised areas.
Table 1.2 ⊳ WHO air quality guidelines and interim targets for PM
PM2.5
(μg/ 3)
PM10
(μg/ 3) Basis for the selected level
Interim target-1 (IT-1)
35 70 These levels are associated with about a 15% higher long-term mortality risk relative to the ultimate guidelines.
Interim target-2 (IT-2)
25 50 These levels lower the risk of premature mortality by approximately 6% (2–11%) relative to the IT-1 level, in addition to other health benefits.
Interim target-3 (IT-3)
15 30 These levels reduce the mortality risk by approximately 6% (2-11%) relative to the IT-2 level, in addition to other health benefits
Air quality guideline
10 20 Below this level, there is no evidence (95% probability) of increased cardiopulmonary and lung cancer mortality in response to long-term exposure to PM2.5.
Note: Annual mean concentration.
Source: WHO, 2006.
©
OECD/IEA,
High concentrations of nitrogen dioxide affect cities in both high-income and lower/higher- middle-income economies. The very steep increase in NO2 concentrations in some urban areas of China, India and the Middle East observed from satellites since the mid-1990s is attributable to the increasing number of vehicles and to the growth of power generation and industry (Hilboll, Richters and Burrows, 2013). During the same period, NO2 concentrations tended to decrease in most of the cities of high-income economies, even though levels remained high. In 2013, annual NO2 concentrations above the WHO guideline level were reported in almost all EU cities with a population larger than 500 000 and were observed to significantly exceed the target in cities such as Paris, London and Milan (EEA, 2015). In addition, and particularly for NO2, there are significant variations in pollution levels within cities, with roads acting as pollution pathways4 and airports, ports and industrial zones (or areas downwind of them) proving to be hotspots. Episodes of high ozone concentrations, which are linked to an increase in the emissions of precursors (such as NOX, O3, CO and VOCs) and are relatively frequent in high-income economies in the summer season, now largely affect emerging lower and upper-middle economies, with, due to long-range ozone transportation, regional and global consequence (for Korea, Japan and even the west coast of the United States).
Sulfur dioxide concentrations have strongly declined in the high-income economies due to efficient pollution controls. Hotspots remain, however, for instance in some areas of Central and Eastern Europe (EEA, 2015). Cities in emerging and developing countries, especially those with high industrial activity, can experience very high SO2 concentrations. In coastal areas, and more particularly in ports, emissions from ships contribute to high SO2 concentrations (Merk, 2014).
Effects
Air pollution has many undesirable effects, the extent of which is determined by the levels of concentration of the different pollutants. There is a range of negative health impacts, adverse impacts on vegetation (leading to lower agricultural yields), acidification (leading to a id rai ) a d eutrophi atio .5 Some forms of air pollution also contribute to climate change. The characteristics of different pollutants define their particular health impacts: even relatively slight exposure may come with high health risks for vulnerable segments of the population.
4For e a ple, while Lo do is ot ited as o e of the world’s ost polluted ities, O ford Street (a usy
commercial street in central London) reported an annual mean NO2 concentration of 134 µg/m 3
in 2013 (more than three-times the WHO guideline) and nearly 1 600 hours when it exceeded the 200 µg/m3 WHO guideline for maximum hourly exposure, plus an outright maximum level of 489 µg/m3.
5
The process by which a body of water acquires a high level of nutrients promoting the growth of algae, which then results in the depletion of oxygen in the water, causing the death of fish and other organisms.
Chapter 1 | Energy and air pollution 33
1
Health impacts
Air pollution is the fourth-largest overall risk to health, after high blood pressure, dietary risks and smoking (WHO, 2014) (Box 1.4). It is an ongoing health crisis for which many of the causes and cures are to be found in the energy sector. Fine particulate matter (PM2.5), even at low concentrations, is associated with a range of serious illnesses and has the most significant effect on human health, due to its propensity to penetrate deep into the lungs. Ozone, nitrogen dioxide and sulfur dioxide also have negative health impacts.
Box 1.4 ⊳ Health impacts of air pollution
Damage to health can arise from both short-term (a few hours or days) and long-term (over months or years) exposure to air pollution. Particulate matter is linked to lung cancer, chronic obstructive pulmonary disease and heart diseases. The single biggest killer of children less than five-years old worldwide is pneumonia, with more than half of the almost one million premature deaths being caused by exposure to household air pollution (WHO, 2016c). Air pollution can also contribute to low birth weight, tuberculosis, cataracts and throat cancers. Ozone, nitrogen dioxide and sulfur dioxide are linked to asthma, bronchial disease, reduced lung function and lung disease.
The nature and extent of the health impact of air pollution depends primarily on the level of concentration the length of exposure to the pollution a person has and their profile, with the v