REPORT
Pipeline
Not Just a
Pipeline?
leadership team,
and deep industry
experience all along the
natural gas value chain
make us the nation’s
top choice for
natural gas.
20 Consolidated Statements of Comprehensive Income 21 Consolidated Statements of Financial Position 21 Financial Ratios
20 Financial Ratios 20 Net Revenue 20 EBITDA Margin 21 Current Ratio
21 Price to Earning Per Share Ratio 21 Liability to Equity Ratio Per Share 20 2015-2016 Stock Price Movement 22 Operational Highlights
22 Number of Customer 22 Gas Distribution Value 22 Length of Pipeline 22 Stock Highlights
22 2016 PGAS Share Price Information 22 2015 PGAS Share Price Information 22 Bond Highlights
22 PGN Bond Price and YTM (Yield to Maturity) Movement 2015-2016
REPORT TO THE SHAREHOLDERS
27 Report From The Board of Commissioners 33 Report From The Board of Directors
40 Statement Letter Members of The Board of Commissioners and The Board of Directors Regarding Responsibility For The Content of The Annual Report 2016
COMPANY PROFILE 43 Name and Address 44 The Company’s Logo 46 The Company’s Milestones 48 Line of Businesses
48 Business Activities
48 The Generated Products or Services 48 PGN Synergy, Integrated Solution 49 Business Units
50 one Pgn Synergy
52 Gas Sources and Natural Gas Infrastructures 54 organization Structure
56 Vision and Mission 58 Corporate Cultures
62 The Implementation of The Company’s Cultures 64 Proile of The Members of The Board of Commissioners
66 Proile of The Secretary of The Board of Commissioners
67 Proile of The Members of The Board of Directors 69 Proile of The Corporate Secretary
69 Proile of The Head of Internal Audit Division 70 Human Capital
70 Proile and Numbers of Pgn’s Employees 71 The Number of Employees Based on The Employment Status
71 The Number of Employees Based on The organization Level Group
71 The Number of Employees Based on Educational Background
71 The Competency Development 76 Expenses
77 Shareholders Information 77 The Shareholders Composition
77 List of Top 20 Shareholders 78 Major Shareholder Information
78 The 5% or More Shares Ownership Aws Per 31 December 2016
78 Shares Ownership By The Members of The Board of Commissioners and The Board of Directors As Per 31 December 2016
78 Information of Subsidiary and Afiliated Companies 84 PGN Group Structure
85 PT Saka Energi Indonesia 86 PT Gagas Energi Indonesia 87 PT PGN LNG Indonesia
88 PT PGAS Telekomunikasi Nusantara 89 PT Transportasi Gas Indonesia 90 PT PGAS Solution
90 PT Permata Graha Nusantara 91 PT Nusantara Regas 92 PT Kalimantan Jawa Gas 93 Stock Listing Chronology
93 Management and Employee Stock Option Plan (MSOP/ESOP) 93 Stock Split
93 Shares Buyback
94 The History of The Number of PGN’s Shares
95 The Chronology of Other Securities Listing and Securities Rating 95 Pgn’s Credit Rating
96 Names and Addresses of Capital Market Supporting Institutions or Professionals
97 Securities Administration Bureau 97 Public Accountant Firm 97 Indonesia Stock Exchange
97 Indonesian Central Securities Depository 98 Awards and Certiications
100 Names and ofice Addresses of Sales Area, Subsidiary and Afiliated Companies
104 Important Events
MANAGEMENT ANALYSIS AND DISCUSSION 113 Business Segments Operating Overview
114 Transmission/Transportation Business Segment
115 Operating Performance of Transmission / Transportation Business Segment
117 Transmission / Transportation Business Segment Revenue
117 Distribution / Trading Business Segment 118 Gas Distribution / Commerce Customers
119 Distribution/Trading Business Segment Operating Performance
121 Customer Proile 121 Number of Customers 122 Natural Gas Price Adjustment
123 Revenue of Distribution/Trading Business Segment 124 Oil and Gas Business Segment
124 Operating Performance of Oil and Gas Business Segment
125 Revenue of Oil and Gas Business Segment 125 Other Business Segments
126 Operating Performance of Other Business Segment 130 Description of The Financial Performance
130 Net Revenues 131 Cost of Revenues 133 Gross Proit
133 Distribution and Transmission Expenses 133 General and Administrative Expenses 133 Other Income
133 Other Expenses
134 Impairment of Oil and Gas Properties 134 Operating Proit
135 Finance Income 135 Finance Cost 135 Bargain Purchase
135 Loss on Foreign Exchange-Net
135 Loss on Change In Fair Value of Derivativesnet 135 Share In Proit of The Joint Ventures
1
3
2
137 Proit For The Year Attributable To Noncontrolling Interests
137 Total Comprehensive Income For The Year Attributable To Owners of The Parent Entity 137 Total Comprehensive Income For The Year Attributable To Non-Controlling Interests 138 Asset
138 Current Assets 140 Short Term Investments 141 Trade Receivables 141 Other Receivables
141 Current Maturity of Advances 143 Trade Receivables (Long Term) 143 Other Long Term Receivables 143 Investments In Shares of Stock 143 Fixed Assets
143 Exploration and Evaluation Assets 143 Oil and Gas Properties
143 Estimated Claims For Tax Refund 143 Goodwill and Other Intangible Assets 144 Liabilities
144 The Composition of Short Term Liability 145 Trade Payables
145 Short-Term Bank Loan 145 Accrued Expenses 145 Other Payables
145 The Composition of Long-Term Liabilities 146 Deferred Tax Liabilities
146 Long Term Loans 146 Bonds Payables
146 Assets Abondenment and Restoration Obligations and Other Provisions
146 Equity 147 Cash Flow
147 Cash Flows From Operating Activities 147 Cash Flows From Investing Activities 147 Cash Flows From Financing Activities 147 Debt Service Ratio
148 Receivables Collectibility 148 Capital Structure
149 Sei’s Syndicated Loan
149 The Basic of Management Policy of Capital Structure 149 Material Commitments For Capital Investments 149 Realization of Capital Investment
150 Target Achievement In 2016 151 Target Achievement In 2017
152 Material Information After The Reporting Year 154 Business Development
154 LNG Mini/Medium Scale 154 Compressed Natural Gas (CNG)
154 Powerplant & Petrochemical Plant (Value Creation) 155 Integrated Industrial Zone
155 Marketing Aspect 155 Market Share 156 Marketing Strategy 161 Dividend Distribution Policy
161 Employee Stock Ownership Program and/or Management Stock Ownership Program (Esop/Msop)
162 Use of Public offering Proceeds
162 Information on Material Transaction Involving Conlict of Interest and Transaction With Afiliates 162 Grant of Loans To Subsidiaries
176 The Implementation of Good Corporate Governance 177 The Objective of Good Corporate Governance 178 Assessment Result on Good Corporate Governance 186 Recommendation on Assessment Result &
Rationale For Non Implementation
188 Strengthening The Implementation of GCG In PGN 191 General Meeting of Shareholders (Gms)
191 Shareholders Composition 191 Shareholders Rights
192 Information Access To Shareholders 194 Gms Decision Result 199 Board of Commissioners
199 Board of Commissioner’s Composition 199 Board of Commissioner’s Responsibility 200 Board of Commissioner’s Guideline and Code of Conduct
200 Dual Position and Conlict of Interest 201 Training Program In order To Improve Board of Commissioners Competency
201 Board of Commissioner’s Tasks Implementation 202 Independent Commissioner
202 Independent Commissioner’s Determination Criteria
203 Independency of Independent Commissioner 203 Board of Commissioners Meeting and Board of Commissioners and Director’s Joint Meetings 206 Board of Commissioners Kpi Assessment 207 Board of Commissioner’s Performance Assessment Result
207 Board of Commissioner’s Remunuration Stipulation Procedure
208 Board of Commissioner’s Remuneration Stucture 209 Board of Directors
209 Board of Director’s Composition
209 Board of Director’s Scope of Work and Responsibilities
210 President Director
210 Direktur of Infrastruture and Technology 210 Director of Commere
211 Direktur of Finance
211 Director of Human Capital and General Services 211 Director of Strategy and Business Development 212 Assessment on The Performance of Committee Under The Board of Directors
212 Board of Director’s Guidelines and Conduct 212 Board of Director’s Dual Position and Conlicts of Interest
213 Training Program In order To Improve The Competence of Directors
214 Board of Director’s Meeting and Decision 218 Board of Director and Corporate Performance Assesment
219 Board of Director’s Remuneration
222 Diversity on Board of Commissioners and Board of Directors Composition
223 Afiliate Relations Between Members of The Board of Directors, Board of Commissioners, and Major Shareholders and / or Controlling
224 Assessment on Board of Commissioners and Board of Directors
224 Board of Commissioners and Board of Director’s Performance Assessment Process
224 Board of Commissioners and Board of Director’s Performance Assessment Criteria and Indicator
224 GCG Assessment Result For Board of Commissioners and Board of Directors
229 Tasks and Responsibilities of The Audit 230 Audit Committee’s Authority
230 Implementation of Audit Committee Activities 230 Audit Committee Meeting Frequency
231 Nomination, Remuneration and Good Corporate Governance Commitee
231 Training Program For Members of The Nomination, Remuneration and GCG Committee
231 Proiles of Members of Nomination, Remuneration, and GCG Committee
233 Nomination, Remuneration, and GCG Committee Independency
233 Nomination, Remuneration, and GCG Committee Tasks and Responsibilities
233 Nomination, Remuneration, and GCG Committee Authorities
234 Nomination, Remuneration, and GCG Duties 234 Nomination, Remuneration, and GCG Meeting Frequency
235 Director Succession Policy
235 Risk Management and Business Development Committee
235 Training Program For Risk Management Monitoring and Business Development Committee 236 Members of Risk Management Monitoring and
Business Development Committee Proiles
237 Independency of Risk Management and Business Development Monitoring Committee 238 Tasks and Responsibilities of Risk Management
and Business Development Monitoring Committee 238 Authority of Risk Management and Business
Development Monitoring Committee 238 Tasks and Activities Implementation of Risk
Management and Business Development Monitoring Committee
239 Risk Management and Business Development Monitoring Committee Meeting Frequency 239 Board of Commissioners Secretary
239 Appointment Legal Basis of and Service Period 239 Tasks of Secretary of The Board of Commissioners 240 Corporate Secretary
240 Appointment Legal Basis and Service Period
240 Functions and Responsibilities of Corporate Secretary
240 Corporate Secretary 2016 Tasks Implementation 241 Corporate Secretary Proile
241 Corporate Secretary Training Program 241 Internal Audit Division
242 Proile of Internal Audit Division Head
242 The Position of Internal Audit Division Within The Company’s Structure
243 Internal Audit Division Charter 243 Authority of Internal Audit Division 243 Tasks of Internal Audit Division 243 Responsibilities of Internal Audit Division 243 Personnel Number of Internal Audit Division
244 Internal Audit Division Human Resources Competency Development and Audit Professional Certiication
244 Implementation of Audit Division Internal Activities During 2016
245 Internal Control System
245 Compatibility of Internal Control System With Coso 245 Evaluation Towards Effectiveness of Internal Control
System 245 Risk Management
246 Vision, Mission 246 Role
249 Corporate Top Risk
250 Company’s Risks and Its Management 253 Implementation of Risk Management Program 254 Major Legal Cases Faced By Pgn
257 Information on Administrative Sanctions 258 Company Code of Ethics
258 Fundamentals of Code of Ethics
262 Code of Ethics Application To Entire organization Level
262 Deployment of Code of Ethics
263 Code of Ethics Implementation and Enforcement Form 263 Whistleblowing System
264 Reporting Violation Report 265 Protection For Whistleblower 266 Report Handling
266 Parties Managing Violation Report 267 Result of Report Handling
267 Reporting Through Whistleblowing System In 2016
267 Preparation of Financial Statements 268 External Auditor
268 External Auditor Appointment Process 269 Other Services
269 Access To Company’s Information and Data
CORPORATE SOCIAL RESPONSIBILITY 274 Contribution To The Society
276 Environment 276 Policies
278 The Undertaken Activities Program 283 Environmental Certiication and Awards 283 Activities Expenses
284 Labor Practices 284 Policies
284 The Undertaken Activities Program 291 Activities Expenses
292 Occupational Health and Safety 292 Policies
300 Employees Health Program
302 Certiications and Awards of K3 In 2016 303 Activity Expenses
304 Social and Community Development 304 Policies
306 The Undertaken Activities Program 306 Partnership Program
306 Environmental Development Program 308 Activities Expenses
310 Product Liability and Consumer 310 Policies
310 Activities Program In 2016 316 Activities Expenses
CONSOLIDATED FINANCIAL STATEMENTS
321 Directors Statement Letter Relating to The Responsibility on The Consolidated Financial Statements
322 Independent Auditor’s Report To The Shareholder 324 Consolidated Financial Statements
REGULATORY CROSS REFERENCE
510 Cross Reference of OJK No.29/POJK.04/2016 dan SEOJK No 30/SEOJK.04/2016
522 Glossary
6
not Just
energy?
burning
natural gas.
Indonesia’s National Energy Policy
is focused on making natural gas the
nation’s primary energy source. And
with good reason. Natural gas is more
energy eficient than coal, oil or diesel.
It’s also the cleanest burning fossil fuel—
producing half the carbon emissions of
coal or oil. Along with virtually no sulfur
oxides, mercury or ash. Without question,
Indonesia has the natural gas reserves to
ensure our energy future. As the nation’s
experts in transporting and natural gas
trading, PGN is playing a leadership role
When it’s made
to a PGN
customer.
just a promise?
and “service excellence” are the ones
in developing Indonesia’s energy future.
So, building good relationships with them
is a top priority. Our focus is on meeting
customers’ needs and expectations—
more energy eficient or handling a
problem in less than 24 hours. At PGN,
every employee acts with integrity.
Here, a customer promise is a
When it’s a rapidly
expanding market.
Indonesia’s cities are growing. Rapidly.
According to The World Bank, Indonesia
is undergoing a historic transformation
from a rural to an urban economy.
The country’s cities are growing faster
of its population living in urban areas.
And much of that population will be
young and middle class—increasing the
demand for electricity and stimulating
we’re developing new infrastructure in 11
growing cities, including Dumai, Gresik,
subsidiary PT Saka Energi Indonesia
continues to explore and discover new
gas reserves that will help us meet future
demand. Most our revenues, however,
are derived from our midstream
and downstream transmission and
household customers, a 54% increase
over 2015.
When it’s
connected to PGN’s
Natural Gas value
chain.
an energy company?
Indonesia’s future.
PGN does more than just
supporting the Indonesian
government’s choice of natural
gas to fuel of the nation’s
growth—we help make it happen.
With our expanding infrastructure,
engineering expertise, deep industry
experience and proven capabilities
in the upstream, midstream and
downstream sectors, PGN is
2.5 6.6 23.2 41.6 44.4 65.4 64.5 16.5 6.9 49.3 68.2 50.5 47.9 28.3
Source: Alvara Research Center, Boston Consulting Group Analysis Indonesia population,
2012 (millions)
Monthly household expenditure (IDR millions)
74 million MACs in 2012
MAC population includes middle, upper middle, affluent and elite consumers
142 million MACs in 2020 Elite 7.5 and more
Affluent 5.0-less than 7.5
Upper middle 3.0-less than 5.0
Middle 2.0-less than 3.0
Emerging middle 1.5-less than 2.0
Aspirant 1.0-less than 1.5
Poor less than 7.5
Indonesia population 2020 (millions)
India China People Republic of Indonesia Pakistan Bangladesh Philipine Vietnam Thailand Malaysia Nepal Usbekhistan Cambodia Sri Lanka Kazakhstan xxxxx Aljazair Tajikistan Georgia Mongolia Armenia Timor Leste Papua New Guinea
Cambodia India Vietnam Georgia xxxx China, People’s Republic of Bangladesh Usbekhistan Indonesia Tajikistan Sri Lanka Pakistan Sri Lanka Timor Leste Mongolia Nepal Philipines Papua New Guinea xxxxx Thailand Malaysia Armenia
2010
0 200 400 600 800 1.000 1.200 0 10 20 30 40 50 60
2010 - 2020 2020 - 2010 2010 - 2020 2020 - 2010
Source: ADB 2010
Source: Alvara Research Center, Asian Development Bank
CHINA
Upper middle class, in millions (bars) and as a share of the total population (ovals)
Middle class, in millions (bars) and as a share of the total population (ovals)
Source: BCG’s Center for Customer Insight; The Economist Intelligence Unit; BCG analysis.
Note: See the sidebar, “Where ‘Upper Middle Class’ Begins in Different Part of Asia.” for definitions of middle and upper middle class in the countries shown. Data for 2020 are estimates
INDONESIA INDIA THAILAND MALAYSIA VIETNAM
53
2015 2020
11% 20% 17% 27% 8% 12% 25% 31% 27% 32% 6% 11%
2015 2020 2015 2020 2015 2020 2015 2020 2015 2020
2015 2020 2015 2020 2015 2020 2015 2020 2015 2020 2015 2020
102 44 73 22 32 17 21 8 11 5 10
165 201 52 68 38 48 25 28 15 16 15 23
35% 40% 20% 25% 14% 17% 36% 41% 48% 49% 16% 23%
INDONESIA’S POPULATION IS GROWING AND BECOMING MORE AFFLUENT
Source: Badan Pengkajian dan Penerapan Teknologi (BPPT) Outlook Energy Indonesia 2016 1000 900 800 700 600 500 400 300 200 100 0 20 0 0 Ju ta SBM /M ill ion B O E 20 0 1 20 0 2 20 0 3 20 0 4 20 0 5 20 0 6 20 0 7 20 0 8 20 0 9 20 0 0 20 0 1 20 0 2 20 0 3 20 0 4
556 564 561 596
514 510 511 545
558 589 782 815 866 910 962
2014
H e
12%
Co oec
4%
Ta t ta
32% Ia t 48% O te 2% Ote Ta t ta Co oec H e Ia t Tt
Greater Jakarta
MA
2012
MA w
2012-2020
MA
2020
Rest of Java
Sumatra
Kalimantan
Sulawesi
Rest of Indonesia
Total = 74 million Total increase = 67 million Total = 141 million
Source: BCG Population and Household Expenditure Database 2012; BCG Analysis. Source: Boston Consulting Group Analysis
+69% +96% +100% +87% +109% +99%
PERFORMANCE
PERFORMANCE
OVERVIEW
echnolog !"asurement
P# $%&'(()"* +echnology to
simplify and improve the accuracy of gas utilization measurement. Regularly P# $%&,ficers check the safety aspect
FINANCIAL RATIOS
2015
–
2016
PGAS SHARES VALUE MOVEMENT
CONSOLIDATED STATEMENTS OF COMPREHENSIVE INCOME
2016
USD(A- ./1 3.)
2015** USD(A- . /1 3.)
2014* USD(A- ./13.)
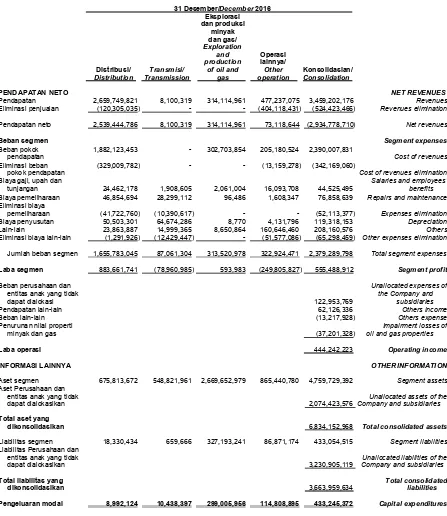
Net Revenues 2,934,778,710 3,068,790,845 3,253,388,634
Cost of Revenues (2,047,838,771) (2,105,680,228) (1,967,906,099)
45oss Proit 886,939,939 963,110,617 1,285,482,535
Other Income 62,126,336 94,536,121 48,492,738
Distribution and transmission expenses (220,401,617) (201,231,465) (224,976,796)
General and administration expenses (234,003,179) (190,418,733) (208,194,851)
Other expenses (50,419,256) (108,753,637) (43,483,142)
Operating Proit 444,242,223 557,242,903 857,320,484
Other Income (Expenses) (59,257,077) (119,878,320) 70,845,685
Income before inal tax beneits (expenses) 384,985,146 437,364,583 928,166,169
Tax Expense – Net (76,401,230) (34,605,679) (217,142,701)
Proit for the year 308,583,916 402,758,904 711,023,468
Other comprehensive incomes
Changes in fair value of available for sale inancial 3,921,377 (2,297,573) 7,258,618
Remeasurement of post-employment 1,858,302 21,281,308 (4,219,314)
Difference in foreign currency translation of 885,148 (3,131,231) (1,118,323)
Total other comprehensive income 6,664,827 15,852,504 1,920,981
Total comprehensive income for the year 315,248,743 418,611,408 712,944,449
Proit for the year attributable to:
Owner of the parent entity 304,324,421 401,199,880 711,179,798
Non-controlling interests 4,259,495 1,559,024 (156,330)
Total 308,583,916 402,758,904 711,023,468
Total comprehensive income for the year attributable to:
Owner of the parent entity 310,669,477 416,193,057 712,932,890
Non-controlling interests 4,579,266 2,418,351 11,559
Total 315,248,743 418,611,408 712,944,449
EBITDA 807,374,809 951,221,280 1,114,474,001
*restated **reclassiied
6
7-Jan-8 9 7-Apr-8 9 7-Jul-8 9 7-Oct-8 9 7-Jan-8 : 8,666
7,666
3,666
4,666 9,666 :,666
7,666
Price Per Share (rupiah)
0 1,500 500 1,000 2,500 2,000 3,000 3,500
NET REVENUES (MILLION USD)
2014* 3,253 2015** 3,069 2016 2,935 0 30 10 20 40
EBITDA MARGIN (%)
2016 28 2014* 34 2015** 31
TOTAL ASSETS (MILLION USD)
2016
USD(Audited)
2015**
USD(Audited)
2014*
USD(Audited)
Total Assets 6,834,152,968 6,495,022,261 5,689,567,974
Total Liabilities 3,663,959,634 3,472,218,207 2,814,097,930
Total Equity 3,170,193,334 3,022,804,054 2,875,470,044
Capital Expenditure 433,245,372 789,756,429 1,891,326,349
Net Working Capital 1,309,302,342 1,055,210,656 1,065,840,731
Total Investments in Associated 427,438,815 387,948,711 403,517,140
*restated **reclassiied
FINANCIAL RATIOS
2016 2015** 2014*
Gross Proit Ratio (%) 30.22 31.38 39.51
Proit (loss) to revenues ratio (%) 10.37 13.07 21.86
EBITDA Margin (%) 27.51 30.67 34.26
Net Debt/EBITDA (X) 1.89 1.60 0.56
EBITDA/Interest Expense (X) 6.10 8.81 16.03
EBITDA/Interest Expense + Principal (X) 3.18 5.03 8.51
Current Ratio (%) 260.58 258.12 259.28
Debt to Equity Ratio (%) 91.56 89.61 64.44
Debt to Asset Ratio (%) 42.47 41.71 32.57
Proit (Loss) to Asset Ratio (%) 11.81 14.49 19.59
Proit (Loss) to Equity Ratio (%) 10.62 15.30 32.86
ROCE (%) 7.32 11.57 18.90
Price to Net Earning per Share Ratio (X) 15.89 12.18 16.65
Price to Book Value Ratio (X) 1.56 1.62 4.12
*restated **reclassiied
SHARES DATA
2016
USD(Audited)
2015**
USD(Audited)
2014*
USD(Audited)
The Weighted Average Number 24,241,168,169 24,239,658,196 24,239,658,196
The Outstanding Common Shares (shares) 24,241,508,196 24,241,508,196 24,241,508,196
Net proit (loss) per share 0.01 0.02 0.03
*restated **reclassiied
PGAS IHSG VOLUME
2 -Apr-16 2 -Jul-16 2 -Oct-16 31-Dec-16 50,000,000 100,000,000 150,000,000 200,000,000 250,000,000 300,000,000 350,000,000
Closing Price Rp2,700
TRANSACTION VOLUME (SHARES)
0 300
100 200
CURRENT RATIO (%)
2014* 259.28 2015** 258.12 2016 260.58 0 15 5 10 20
PRICE EARNING PER SHARE
2015** 12 2014* 17 2016 16 0 50 100
DEBT TO EQUITY RATIO (%)
PGAS shares movement In 2016 was opened at Rp2,370 level and closed at Rp2,700. PGAS was at its highest point at Rp3,520 level on August 2,2016 and reached the highest closing price at Rp3,430 level on August 1, 2016. Per
December 30, 2016, PGAS was the 15th largest capitalization share on the Indonesia Stock Exchange and the 5th largest capitalization among the SOE in Indonesia with the market capitalization value amounted to Rp65.45 trillion.
2016 PGAS SHARE PRICE INFORMATION
Q4 Q3 Q2 Q1
Number of Outstanding Shares (shares) 24,241,508,196 24,241,508.196 24,241,508.196 24,241,508,196
Market Capitalization (Rp) 65,452,072,129,200 69,573,128,522,520 56,725,129,178,640 63,391,543,932,540
Highest Price (Rp) 2,940.00 3,520.00 2,860.00 2,770.00
Lowest Price (Rp) 2,200.00 2,340.00 2,170.00 2,350.00
Closing Price (Rp) 2,700.00 2,870.00 2,340.00 2,615.00
Average Trading Volume (Lot) 336,031.00 713,460.76 414,884.49 370,761.87
2015 PGAS SHARE PRICE INFORMATION
Q4 Q3 Q2 Q1
Number of Outstanding Shares (shares) 24,241,508,196 24,241,508,196 24,241,508,196 24,241,508,196
Market Capitalization (Rp) 66,542,939,998,020 61,331,015,735,880 104,602,107,865,740 116,359,239,340,800
Highest Price (Rp) 3,160.00 4,350.00 4,890.00 6,050.00
Lowest Price (Rp) 2,310.00 2,150.00 3,855.00 4,600.00
Closing Price (Rp) 2,745.00 2,530.00 4,315.00 4,800.00
Average Trading Volume (Lot) 316,740.00 382,169.00 301,928.00 317,773.00
STOCK HIGHLIGHTS
BOND HIGHLIGHTS
Type of Shares Value Interest Rate Due Date 2015 & 2016 Ratings
Guaranteed Notes USD1,350,000,000 5.125% May 16, 2024 Standard & Poor BB+
Moody’s Baa3
Fitch
BBB-30,000 180,000
80,000 130,000
NUMBER OF CUSTOMERS
2015** 2014* 96,049 111,076 168,973 2016 0 1,800 600 1,200
GAS DISTRIBUTION VOLUME (MMscfd) 2015** 2014* 1,716 1,591 1,598 2016 5,000 7,500 6,000 5,500 6,500 7,000
LENGTH OF PIPELINE (KM)
2015** 2014*
6,067
7,026 7,278
2016
PGN BOND PRICE AND YTM (YIELD TO MATURITY) MOVEMENT
20
15 - 2016
YTM (%) MARKET PRICE (%)
6-JAN-2015 1 0 2 3 4 5 6 7 90 85 95 100 105 110 115
16-APR-2015 6-JUL-2015 2-NOV-2015 30-MAR-2016 10-AUG-2016
REPORT TO THE
02
REPORT TO THE
SHAREHOLDERS
FSRU Lampung
REPORT FROM THE BOARD OF COMMISSIONERS
Fajar Harry Sampurno
President Commissioner
Dear Shareholders,
Energy customers therefore perceived a substantial weakening of natural gas’s competitive advantage against oil, and adjusted their price expectations accordingly.
Despite these unfavorable operating conditions, the Company achieved solid results, exceeding its sales volume targets in distribution business segment with growth of 0.1% to 803 BBTUD resulting USD2,539.44 million of revenue in 2016. Although lower transmission volumes contributed to a decline in revenue, a series of breakthroughs on eficiency enabled the Company to maintain its proitability and surpass its net proit target.
We appreciate the Board of Directors’ actions to sustain demand during the year. The Company’s access to LNG, the price of which is linked to the Indonesia crude price, gave the Board the lexibility
ASSESSMENT OF MANAGEMENT PERFORMANCE
The slow pace of Indonesia’s recovery from its economic downturn and the ongoing pressure on the price of crude oil continued to pose signiicant challenges for the Company in 2016. Although some much-needed stability was restored on several macroeconomic indicators, persistent deicit concerns led the government to curtail its infrastructure development spending, including the planned expansion of power generating capacity. For PGN’s key customers in the power and industry sectors, the constrained economic conditions prolonged the weak demand environment for their output, with the result that their demand for natural gas remained stagnant. After plunging to a dramatic low in January 2016, the Indonesia crude oil price recovered steadily, but remained around the US40/bbl mark for much of the year.
Fajar Harry Sampurno
Kiswodarmawan Tirta
Hidayat
Mohamad Ikhsan
IGN Wiratmaja Puja
to respond to customers’ expectations of lower-priced gas, despite an aggregate increase in the purchase price of conventional natural gas. Despite a slight scale-back of planned capex plans in response to the subdued macroeconomic environment, the Company continued to invest in infrastructure development and optimization to increase customer connections in existing and emerging economic zones. The government has also continued to entrust PGN to implement its program to expand residential customers’ access to low-cost, safe energy, assigning the Company to develop and operate the infrastructure. This was carried out alongside the Company’s ‘Sayang Ibu’ initiative to connect to households. These to program resulting 57,702 additional residential connection in 2016.
The Board of Directors has also ensured continued investment in the Company’s upstream strategy. Although the weak crude prices have adversely affected the revenue performance of PGN’s E&P operator, PT Saka Energi Indonesia, the company has continued to perform efficiently, and we believe that this is an opportune time to invest in further strategic acquisitions.
As PGN continues its journey towards becoming an integrated energy group, it continues to strengthen its comparative advantage: the synergy generated by the deepening capabilities of the Company and its subsidiaries in the upstream and downstream sectors, which give PGN the unique ability to offer existing and potential customers a widely differentiated range of products and services to address their energy needs on a sustainable and cost-eficient basis.
SUPERVISION OF THE BOARD OF DIRECTORS
The Board of Commissioners has a primary responsibility to exercise oversight over the management actions of the Board of Directors and to provide regular feedback and guidance. The strongly collaborative relationship between PGN’s two Boards facilitates a frequent and open communication that allows for a rapid response to emerging challenges. Much of the supervisory work takes place through our monitoring visits to the ield with the Directors, which take place more frequent. Decisions are then taken at the joint meetings with the Board of Directors, which are held at a minimum once a three month. A total of 7
joint meetings were held in 2016, with more than 12
special meetings with Directors to discuss speciic concerns of Board of Commissioners. We also exercise supervision through the work of the Audit Committee, Risk Committee and Nomination and Remuneration Committee.
ASSESSMENT OF GCG IMPLEMENTATION AND COMMITTEE PERFORMANCE
The Company recognizes that doing business responsibly is central to its vision of becoming a world-class gas company. We have overseen a number of improvements in the governance framework that will provide greater assurance to shareholders and stakeholders that their interests are being fully protected.
To address the increased exposure to risk as the scope of the business grows, we are taking a more proactive approach to risk management with more frequent meetings of the Risk Management and Business Development Monitoring Committee (Risk Committee). The Committee also made several site visits during the year to monitor the implementation of risk management directly at the operational level.
Following a thorough review of the Company’s governance framework, we decided to dissolve the GCG committee and assign its functions to the Risk Committee. This will allow for more coherent and effective scrutiny of governance that will be more responsive to any issues that arise. The Committee is fully independent, comprising three professionals from outside PGN and one of our Independent Commissioners as chair.
The Audit Committee has continued to provide valuable support by exercising rigorous and independent supervision over the Company’s inancial disclosures and internal controls. We have followed up all their recommendations with the Board of Directors.
We were pleased to note that the Company’s score on its annual external GCG audit has continued to improve and is among the highest of all the state-owned enterprises (score 93.94). We believe that this is a fair relection of the concerted efforts to strengthen corporate governance over the year.
OPINION ON BUSINESS PROSPECTS
The economic outlook for Indonesia in 2017 is generally positive, with the recovery expected to continue, albeit at a slow pace. The proceeds from the tax amnesty program in 2016 have given the government some iscal space to resume its infrastructure spending, and we are now beginning to see some of the delayed projects come online. This will drive demand for electricity, particularly for the new and expanded airports that are scheduled to be built around the country, which offers an opportunity for PGN to continue to increase the role of gas in the power sector. We also expect to see an upturn in industry demand for both electricity and gas as the pace of economic activity picks up.
Fajar Harry Sampurno
President Commissioner
drive demand for natural gas by drawing on the Company’s synergies to meet customers’ needs more effectively; and to grow new markets, particularly in the power generation sector, by leveraging the Company’s capability to supply natural gas to off-pipeline locations. At the same time we urge the Board of Directors to continue to exercise strict inancial discipline.
We are pleased with the progress PGN has made towards becoming an integrated energy company, but given the Company’s ambition to be a world-class operator in the natural gas sector by 2020, there is still much work to be done. We hope to see more aggressive growth, both upstream and downstream, to enable PGN not only to play a more prominent role in Indonesia’s energy mix but also to take its place among global players.
The government is currently considering various options for the implementation of its strategy to consolidate several state-owned enterprises by creating a single holding company in each major economic sector. This could potentially increase synergies and reduce duplication and fragmentation in the sectors concerned, making them more competitive. However, the implications for each of the companies concerned must also be considered. PGN has
commissioned an independent assessment of the potential impact and the results will be presented to the government. We will also continue to engage constructively with the government to ensure that the interests of all the shareholders are equally protected going forward.
CHANGES IN THE COMPOSITION OF THE BOARD OF COMMISSIONERS
The General Meeting of Shareholders on April
8, 2016 honorably discharged Mr. Iman Sugema and Mr. Muhammad Zamkhani from their positions as Chairman and member of the Board of Commissioners, respectively. In their place, Mr. Kiswodarmawan was appointed as an Independent Commissioner and I was appointed as Chairman. I would like to take this opportunity to express the Board’s appreciation for their contribution to the Company.
REPORT FROM THE BOARD OF DIRECTORS
Hendi Prio Santoso
President Director
Dear Shareholders,
in their activities. In addition, we were also facing expectation from the customers to deliver a lower cost of gas but in the meantime our cost was not able to decline to follow the proportion of the expectation. These conditions also impact the Company’s revenue. Yet we manage to compensate some of this expectation by utilizing our LNG Facility, since as commonly applicable in oil and gas industry, LNG price is formed based on crude oil price.
Through the lens of this unfavorable market backdrop, PGN delivered a relatively solid
performance with growth within our target range.
The Company continued to demonstrate its resilience, with solid cash low and an uptick in the rating relecting its robust fundamentals.
PERFORMANCE IN 2016
For the energy sector, the slight upturn of the global economic condition and particularly in Indonesia which is seen in the GDP growth to
5.01% in 2016 was largely offset by the continued pressure on the crude oil price, which has remained volatile after dropping dramatically from the USD100-120 range some 18 months ago to USD40/barrel in average in 2016. This has signiicantly eroded the price competitiveness of natural gas.
The global economic slowdown also resulting in the hampering the increasing of gas
consumption by many industries and other gas users. At the same time, demand for natural gas from the power generation and industry sectors has remained subdued as the slow pace of recovery failed to drive a signiicant resumption
Hendi Prio Santoso
Nusantara Suyono
Dilo Seno Widagdo
Muhammad Wahid Sutopo
Danny
Addressing the challenges
In 2016 the crude oil price sank to its lowest level for the last decade, averaging USD40 per barrel for much of the year. Despite a slight adjustment to the USD55 level towards the end of the year, energy prices are still struggling to ind a new equilibrium. This has had a profound impact on the gas industry, not least on the expectations of our customers.
We were able to minimize the impact of the adverse market conditions on sales volume by driving eficiencies, maintaining a responsive and proactive relationship with our customers and continuing to seek out new opportunities.
Our company-wide eficiency programs have already yielded a reduction in operational expenditure and have begun to give us better visibility as well as a more rational allocation of costs. This has been supported by PGN’s transformation as we reorganize our operational activities more eficiently through our subsidiaries.
Customer expectations that the lower energy prices would be passed on to them in the form of lower gas prices were not matched by the reality that our production costs did not decline
commensurately. We addressed this by increasing the proportion of LNG, the price of which is linked to the crude price, which enabled us to lower costs to meet some of the expectations. Recognizing the importance of stepping up our responsiveness during this challenging period, we increased the quality of our engagement with customers through gatherings, site visits and our centralized contact center that operates 24/7.
We also worked hard to communicate PGN’S proposition more effectively, particularly to the power sector, by highlighting the beneits of capability our network. PGN delivers not only a commodity that is clean, eficient and still relatively cheap, but also the lexibility to adjust to a wide range of customer demands. PGN believes that these attributes deliver a tremendous value-add for our customers.
STRATEGY EXECUTION
Optimizing Infrastructure Assets
The weak market conditions prompted us to review our infrastructure development strategy in 2016. In response to the contraction in
demand, particularly from our major customer, PLN, we sought greater eficiency in our capital expenditure and focused on optimizing existing assets. We therefore developed a series of
initiatives, which included reconiguring existing pipelines to expand sales, and monetizing pipeline-related capabilities to create new revenue streams, to improve the eficiency and proitability of our pipeline networks.
We also continued to address the issue of last mile connections, recognizing that bridging the gap between the pipeline and the end user is the key to growing sales. To expand the market for CNG, we introduced our new CNG ‘cradle’ technology, which provides customers with a cheaper, safer and more environmentally friendly alternative to LPG. Encouraged by the response to its limited roll-out in the restaurant sector, we are now developing the systems and infrastructure to support its expansion to a wider market. We also maintained our focus on innovation to accelerate the penetration of natural gas products and services in new markets.
SECURE SUPPLY THROUGH UPSTREAM AND LNG DEVELOPMENT
In 2016 PGN continued to participate effectively in the upstream sector through our subsidiary, PT Saka Energi Indonesia. Although Saka’s revenues were negatively impacted by the declining oil price, it achieved its production targets, and an aggressive efficiency program ensured that the company did not make an operating loss. In addition to being one of the few upstream companies to continue exploration drilling in 2016, Saka acquired a new participating interest in the Sanga Sanga block in Kalimantan.
LNG from PGN’s loating storage and receiving units (FSRU) helped to ensure that we had suficient supply to fulil demand. In 2016 we delivered eight cargoes of natural gas from LNG Tangguh to the market in West Java through FSRU Lampung. PGN believes that the majority of Indonesia’s gas needs will be supplied by LNG in future as most of the country’s remaining reserves are far from the existing pipeline
network. In anticipation of this, we continue to explore initiatives and prepare the infrastructure that will further raise the proile of LNG in our portfolio and in the market.
REACH MORE HOUSEHOLD CUSTOMERS
We continued to expand our natural gas
distribution infrastructure to enable households to beneit from cheap, clean energy. In 2016, we have connected 57,702 households through our ‘Sayang Ibu’ program in six cities and through assignment from the government’s residential gas initiative, for which PGN is constructing and operating the infrastructure. In 2016, PGN managed a total of
165,392 residential customers.
ADVOCATE FOR MORE SEAMLESS ENERGY POLICY PLANNING
PGN’S TRANSFORMATION
PGN’s transformation continued in 2017 as the Company made two major changes in the holding structure. Firstly, the Household Gas Network Service Unit was established to manage the construction, operation and maintenance of distribution pipelines, and optimize gas sales of the Distribution Pipeline Network of Households that assigned by the Government. Secondly, PGASCOM was reassigned from the Director of Strategy and Business Development to the Director of Human Capital and General Services in order to facilitate the reorientation of the ICT business management to a group services function.
The vision for 2020 is for PGN to be an integrated energy solutions provider. By this date, PGN will have transitioned to a full holding company role, performing overall strategic and control functions to coordinate the operational business, which will be carried out entirely by the subsidiaries. Our expectation is that this will create ‘One PGN’, which will unlock more of the potential synergies within the PGN group and result in a more agile, streamlined and responsive business. The current external situation has highlighted the necessity of the transformation and given us a clearer perspective of the way forward as we adjust to the ‘new normal’.
HUMAN CAPITAL
As the corporate transformation progresses, PGN is realigning the management and development of the workforce to meet the new demands of the business. We have mapped out the critical capabilities and qualities needed to meet PGN’s mid- to long-term strategic objectives and put in place an ambitious succession and talent
management program to ensure that the Company has a strong pipeline of future leaders at various levels of management.
To move towards the ‘One PGN’ goal, we have prioritized efforts to embed a unified PGN culture and mindset among the subsidiaries by creating change agent teams in each business unit to engage employees in the fully in the process. Employee engagement is critical to the success of the transformation, and creating regular opportunities for meaningful dialog between management and employees on the purpose and implications of the changes has been high on the agenda.
GCG IMPLEMENTATION
Earning the trust of our stakeholders by doing business responsibly is crucial to the long-term sustainability of our Company. PGN’s corporate governance framework clearly deines the roles, responsibilities and processes that govern all our operations in order to provide assurance on the accountability and integrity of the business and its management.
The implementation and eficacy of this framework is reviewed every year by independent assessors in an audit of the Company’s good corporate governance compliance, based on the indicators set out in Minister of State-Owned Enterprises Regulation SK-16/MBU/2012 dated June 6th, 2012. We
have registered an improvement each year since the audit was introduced in 2009, raising our score in 2016 to 93.94%, one of the highest scores of all the SOEs that were audited.
structure and intensify controls relating to ethical conduct. We worked with the Indonesian Anti-Corruption Commission to develop and roll out policies on conlict of interest and gratuities, including a rule that makes asset disclosure compulsory at several levels of the organization beyond senior management, and links it to promotion and annual bonuses.
We continued the development of
comprehensive guidelines for various critical aspects of governance, including PGN’s whistleblower system, and updated the Board manual to relect the redistribution of responsibilities introduced as part of our ongoing transformation.
Over the last few years, PGN has taken a lead among SOEs in embracing its responsibility to make a positive impact on the communities in and around which we operate; PGN’s CSR program was recently commended by Indonesia’s House of Representatives as being one of the best of its kind. Through our comprehensive community development initiatives we seek not only to improve access to quality health and education facilities, but also to promote local economic development through support to small enterprises, such as an initiative in 2016 to develop sustainable tourism in several villages close to Yogyakarta.
BUSINESS PROSPECTS
Most economic growth forecasts for 2017 indicate a slight uplift in the economy. The government has projected a GDP growth rate of 5.3%. The anticipated acceleration of infrastructure spending, alongside increasing conidence in the economy on the back of the government’s economic reform packages and the relative stability of 2016, is expected to stimulate investment over the year. This scenario will see a resumption of economic activity and an increase in demand for electricity; however, it will take time for this to ilter through the economy, and natural gas demand is expected to remain relatively lat throughout most of 2017.
Over the longer term, the outlook is positive: there is still tremendous scope for growth in Indonesia, given the country’s size, its relatively robust economic growth and expanding population. PGN will therefore continue to pursue our key strategic objective of growing demand for natural gas by improving our product and service offer.
We will also continue to increase the role of LNG in the energy mix. Going forward we will inevitably see a decline in the production of conventional pipeline gas, leaving a gap that should be illed increasingly by LNG. We believe that to ease the transition, a hybrid pricing mechanism should be implemented. We will also continue to invest behind the development and application of CNG and other unconventional gas fuels.
A central priority will be to underpin these strategies by optimizing the synergies between our subsidiaries so that we can deliver seamless solutions to all our customers.
We will continue to engage with the
government on energy policy issues in support of the development and implementation of a coordinated, long-term energy vision aligned with the country’s development objectives.
CHANGES IN THE COMPOSITION OF THE BOARD OF DIRECTORS
There was a change in the composition of the Board in April 2016 as three of our Directors, Mr. Mochtar Riza Pahlevi Tabrani, Mr. Djoko Saputro and Mr. Jobi Triananda Hasjim, came to the end of their terms. All three have been appointed to CEO positions in other state-owned enterprises, which is a strong endorsement of their capacity
as individuals and relects the Government’s conidence in the way our business has been managed. We would like to express our sincere thanks to them for their signiicant contributions to PGN and wish them well for the future.
In their place we welcomed Mr. Nusantara Suyono as Director of Finance, Mr. Dilo Seno Widagdo as Director of Infrastructure and Technology and Mr. Danny Praditya as Director of Commerce. All bring with them considerable capabilities and experience, both from within the PGN group and outside, that will beneit the development and implementation of our strategies going forward.
This has been a challenging year. On behalf of the Board I would like to extend my thanks to all our employees for their commitment to our vision, which is relected in the hard work they have put in to address the challenges. Our thanks are also due to all our stakeholders, particularly our customers, business partners and the Government, for their ongoing support. We believe that PGN continues to present a strong proposition in Indonesia’s current and future energy landscape, as an integrated gas company with the end-to-end capabilities and infrastructure to supply clean energy to the nation. We look forward to continuing to create value for our stakeholders by strengthening the role of natural gas in Indonesia’s development over the year ahead.
Hendi Prio Santoso
We the undersigned declare that all the information included in the Annual Report 2016 of PT Perusahaan Gas Negara (Persero) Tbk has been fully disclosed and we are responsible for the truthfulness of the content of the Company’s Annual Report.
This is our declaration, which has been made truthfully.
Jakarta, April 10th, 2017
President Director
HENDI PRIO SANTOSO
Director of Human Capital and General Services
HENDI KUSNADI Director of Commerce
DANNY PRADITYA
Director of Infrastructure and Technology
DILO SENO WIDAGDO
Director of Finance
NUSANTARA SUYONO
Director of Strategic and Business Development
MUHAMMAD WAHID SUTOPO
STATEMENT LETTER
MEMBERS OF THE BOARD OF COMMISSIONERS
AND THE BOARD OF DIRECTORS
REGARDING
RESPONSIBILITY FOR THE CONTENT OF
THE ANNUAL REPORT
2016
PT PERUSAHAAN GAS NEGARA (PERSERO) Tbk
President Commisioner
FAJAR HARRY SAMPURNO
Independent Commisioner
KISWODARMAWAN
Commisioner
MOHAMAD IKHSAN Commisioner
TIRTA HIDAYAT
Commisioner
IGN WIRATMAJA PUJA
Independent Commisioner
COMPANY
NAME
PT Perusahaan Gas Negara (Persero) Tbk
BUSINESS FIELDS
Natual gas transmission and trading
OWNERSHIP
The Republic of Indonesia 56.96% Public 43.04%
DATE OF ESTABLISHMENT 13 May 1965
LEGAL BASIS OF ESTABLISHMENT PP No.19/1965
AUTHORIZED CAPITAL Rp7,000,000,000,000
ISSUED AND FULLY PAID-UP CAPITAL Rp2,424,150,819,600
LISTING IN STOCK EXCHANGE
The shares of the Company have been listed on the Jakarta Stock Exchange and the Surabaya Stock Exchange on 15
December 2003 with Stock Code: PGAS
CONTACT CENTER Phone : 1500645
Email : [email protected]
HEAD OFFICE
PT Perusahaan Gas Negara (Persero) Tbk Jl. K.H. Zainul Ariin No. 20, Jakarta 11140, Indonesia
T. (62-21) 6334838, 6334848, 6334861
F. (62-21) 6333080
PO BOX 1119 JKT www.pgn.co.id
CORRESPONDENCE ADDRESS:
The Manhattan Square Building, Mid Tower,
26th Floor,
Jl. T.B. Simatupang Kav. 1S, Jakarta 12560, Indonesia
T. (62-21) 80641111
F. (62-21) 6333080
THE COMPANY’S LOGO
1859-1965
The logo that was used when the Company was still named the L.J.N. Eindhoven & CO Gravenhage Firm.
1965-1994
Represent the nature of gas utility service, with earth as its source and the company’s mission in production, instalation, transmission and distribution.
1994-2003
A ire lame that represent a dynamic, spirit, and innovation which were the determination of the Company in providing its services. The black circle represents earth and also pipe as the facility to deliver natural gas.
2003-2011
THE MEANING
PGN’s logo symbolizes ire consisted of ive elements that represented ive main stakeholders, namely consumers, investors, employees, the state and PGN itself. The ire has three dimension nuance that implies a company that is fully integrated which goes beyond natural gas transportation and trading business to provide comprehensive energy solutions for consumers. The blue color represents the clean gas, self-conidence, clarity and stability, as well as its intensity. The degraded blue color represented the movement, growth, and ability to adapt.
TAGLINE
‘ENERGY’
• Identify the important role of PGN which is not only engaged in the area of gas distribution but also participates in the crucial energy supply.
PGN’s corporate brand is a symbol that represents PGN to the world. Therefore, it is very important to maintain and establish the value of that corporate brand. The corporate brand also serves as an afirmation so that the use of PGN’s name always consistent, that is called as PGN and not with other names such as PGAS or Perusahaan Gas Negara.
‘FOR LIFE’
• Signiies the important role run by PGN through the natural gas in moving and improving the quality of life in Indonesia ranging from cooking for daily meals to powering the power plant.
PGN formed 2 subsidiary companies that respectively engage in
the natural gas upstream and downstream businesses. The subsidiary company in the
upstream business is PT Saka Energi Indonesia (SEI) while the subsidiary company in the downstream business is PT Gagas Energi Indonesia (GEI).
2011
PGN is a state-owned companythat was initiated on 1859 when it was named
L.J.N. Eindhoven & CO Gravenhage Firm.
On May 13 1965, based on the Government Regulation Number
19 Year 1965, PGN was deined as a State Company and known as “Perusahaan Gas Negara”.
Based on the Government Regulation Number 37 Year
1994, the status of PGN changed followed by the addition of a broader business scope, namely other than in the area of natural gas trading also in the area of transmission, where PGN serves as the transporter.
The shares of PGN have been listed in the Jakarta Stock Exchanges and the Surabaya Stock
Exchange on December
15, 2003 with the trading transaction code ”PGAS”.
On October 25, 2007, the gas pipeline of SSWJ II
Grissik – Pagardewa segment was inaugurated by the Minister of State for State-Owned Enterprises (SOE) for PT Krakatau Daya Listrik from Pertamina ield in Pagardewa. In the same year, PGN established a subsidiary company that engages in the telecommunication industry, namely PT PGAS Telekomunikasi Nusantara (PGASCOM). PGASCOM manages the operation and maintenance of iber optic cable networks.
1859
1965
2003
1994
2007
2008
2012
PGN established a Subsidiary Company PT PGN LNG Indonesia (PLI). The PLI’s scope of business among others engages in the supply of LNG and natural gas, storage activities including regasiication to buyers, as well as in other LNG business activities.
2010
Conducted the SOE Synergy with Pertamina through the establishment of a joint venture company, PT. Nusantara Regas that operates the Floating Storage & Regasiication Unit (FSRU) in West Java with a capacity of 400 MMscfd. This FSRU is the irst LNG Receiving Facility in Indonesia.
PGN exercised the split of PGAS shares par value (stock split) with a ratio of 1 (one) share exchanged with 5 (ive) shares with a nominal value of Rp100 per share so that the number of shares is 22,967,185,965
PGN succeeded in completing the Transmission Pipeline of Grissik – Duri which then followed by the establishment a Subsidiary Company in the ield of Transmission that is PT Transportasi Gas Indonesia (TGI).
1998
2015
2016
At the end of August 2015, PGN through its afiliated company PT Kalimantan Jawa Gas (KJG) succeeded in completing the construction of the Kalija I Transmission pipelines from Kepodang gas ield to Tambak Lorong Gas Power Plant in Semarang for 201 km long and continued with the commercialization of that pipelines.
With the operation of that infrastructure, then PGN becomes the only natural gas downstream Company that serves to all Customer sectors (Household. Commercial, Industry, and Power Plant) in Central Java.
In accordance with the Government’s assignment, PGN started the construction and management of household natural gas network project in Batam, Surabaya, and Tarakan, after earlier in 2015 PGN was assigned to manage the household natural gas network that was built by the Central Government in 11 regions, i.e among others Jabodetabek, Palembang, and Surabaya.
PGN had an organization transformation to adjust the company’s development and encounter the business competition in oil and gas sector. Together with its subsidiaries and afiliations in the form of ONE PGN, established its stride to the next level towards the world-class company in the gas industry. To optimize the power and competence
that have been built over the years by utilizing the future business development opportunities, PGN re-established a subsidiary company with a name of PT PGAS Solution that relates with
engineering, operation, and maintenance, EPC contractor, as well as trading
LINE OF BUSINESSES
BUSINESS ACTIVITIES
Pursuant to the PGN’s Articles of Association as lastly amended by the Deed No. 23 dated April 6th 2015, made
before Notary Fathiah Helmi, SH., Notary in Jakarta, the business activities of PGN are as follows:
1. Planning, construction, and development of the natural gas downstream business that covers the activities of processing, transportation, storage, and commerce.
2. Planning, construction, development of the
artiicial gas (hydrocarbons gas) production, supply, and distribution.
3. Other than the main business activities, PGN may conduct other supporting business activities that directly related and or support the main business activities in accordance with the prevailing laws and regulations.
THE GENERATED PRODUCTS OR SERVICES
As a State-Owned Enterprise that engages in the natural gas downstream business, PGN conducts its business activities in the areas of natural gas transportation and trading.
In the business of natural gas transportation, PGN has pipeline networks in North Sumatera, Southern part of Sumatera, Riau Islands, and Java Sea to connect the natural gas sources location with the natural gas end user location through the transmission pipelines mode.
In the business of natural gas trading, PGN bought the natural gas from various natural gas Producers and then sold it to various natural gas end user segments, for instance Household Customers, Commercial Segment Customers, Industrial-Manufacture Customers, Power Plants and Transportation Sectors, either distributed through pipelines, CNG or LNG.
PGN provide an integrated natural gas infrastructures to support natural gas trading and ensure the quality of the natural gas (natural gas composition, pressure, temperature) and the service (customers contacts, disruption handling) that PGN serve for our end customer.
PGN divided its business activities into 4 (four) principal business segments, which are:
1. Natural gas transmission businesses
2. Natural gas trading business
3. Natural gas and oil business
4. Other businesses, i.e telecommunication, services, constructions and maintenance of pipeline networks, building management, and inancial lease align with the company’s business strategy.
In 2011, the Company developed its capability in the activities of natural gas and oil upstream, and based on the PSAK No. 5 (as revised in 2009) concerning the operational business segments and for the purpose of management appraisal as well as reporting, in
2013, the Company also reported the natural gas and oil upstream business activities as the company’s business segment.
PGN SYNERGY, AN INTEGRATED SOLUTION
BUSINESS UNITS
GTA (Gas Transportation Agreement)
GSA (Gas Sales Agreement)
PGN and TGI role as the gas carrier through transmission pipelines by charging toll fees
In the trading busines, PGN bought natural gas from various natural gas Producers which then sold to various natural gas end user segments, for instance Household Customers, Commercial Segment Customers, Industrial-Manufacture Customers, Power Plants to Transportation Sector, either via modes of gas distribution pipelines, CNG, or LNG.
Transmission Pipelines 2,283 km
Compressor Station
Distribution Pipelines
4,994 km
Pipeline gas supply sources
LNG supply sources
Power Plant, Industry, Commercial, Residential, Gas Filling Station (SPBG)
Off-Taker
LNG
HOTEL
GTA (Gas Transportation Agreement)
ONE PGN SYNERGY
SPBG HOTEL
Gas Station
Natural gas reserves in Indonesia in sizeably bigger than oil reserves. Saka Energi is PGN’s subsidiary has business in Upstream sector
Compressor Station
Increasing gas pressure in delivering natural gas. Compressor Station located in Sumatera Island.
Power Plant
Power plant which is powered by natural gas can operate more eficiently and environmentally more friendly than fuel and coal.
Commercial Customers
Eficiency and reliability is important factors on delivering energy to commercial customer. PGN natural gas could provide it.
Gas Filling Station (SPBG) and Mobile Refueling Unit (MRU) PGN operating 15 SPBG and MRU to customer in
transportation sector in 8 big city thorough out Indonesia.
Residential Customers PGN served more than 160,000 residential customer in Indonesia which make PGN the biggest natural gas operator.
Floating Storage Regasiication Unit (FSRU) FSRU convert the LNG to high quality natural gas. FSRU Lampung is located on offshore of South Sumatera
PGN has 2 LNG regassiication facilities, that is FSRU Lampung and FSRU Jawa Barat.
UPSTREAM
In order to meet the customers’ expectations and improve the customers’ satisfaction, PGN provide an integrated services to customers that supported by the expertise from each Subsidiary Company. Our subsidiary Company’s expertises are natural gas distribution through transmission pipelines, ICT Solution supply, network/gas equipment maintenance supplies and services, assets and building management, as well as energy solutions through CNG.
Gaslink
Gas Transport Module (Gas Link)
Gas Link is the solution for delivering natural gas to location that not connected to natural gas pipelines.
Asset Management Engineering, Procurement, Construction Information, Communication, and Technology Solution Gas Transmission
Business
Telecommunication Companies Gas Source
Oil and Gas Companies
Mobile Refueling Unit (MRU)
MRU is the solution for gas illing station for transportation with CNG technology.
PGN Contact
Center (1500 645)
Operation & Maintenance
Supporting
P;P<= >? @?ABD ? @a LBEF=GJP<=>?KDJ?
P<=>?KDJ?N PFss< >Q PRSGAGuD<iU
DURI
SDJ@apor<
P?J?=?JS>? >D VJW
X? >?K
47YZ [
;r?JAKDA AD VJPD\<iDJ< E=D AAD]^SDJ@apor<
E _` SS`b
S;F;`d B 53fb K
;r?JAKD AAD VJPD\<iDJ< E=D AA D ]^g G=D
19fb K
;r?JAKDA AD VJPD\<iDJ< E=D AAD]^PagarU<wa
26hbK
;r?JAKDA AD VJPD\<iDJ< PagarU<w?^L? jGk ?Jl ?=DJ@gai mVJV nVPkDiiD\A
mV =DUV=PSm
`J>Dg?y?L?>GPrima pE?A<x^q?KjDl<=?J@ r
u S_sL?K\ GJ@
PagarU<wa S>? >DVJ
P< = >?KDJ?N P
Fss< >v Pr<KD<=VDi B ?>GJ?S< ?
10yb K
;r?JAKDA AD VJPD\<iDJ< L? jG?Jl ?= DJ@g?D^XVzVJ<gara
16yb K
;r?JAKD AAD VJPD\<iDJ<
L? jGk ?Jl?=DJ@g?D^lG?= ?X< ]asi
L?jG?J
l?=DJ@gai S>?>DVJ P<= > ?KDJ?N PFss< >Q
X<J@gala^Q{<i i
MEDAN
GAS SOURCES AND NATURAL GAS
INFRASTRUCTURES
| }~
w
A
2 ¡
K¡¢£¤¥¦§ ¨© ¢¢¨
L¡ £ ¢ }ª
«¬ ¨ª® ¯¯ª
° £¬ } }ª }¢
° £¬ ¯±±²¢}ª ³´µ ®¶ ·}® ~
¸³ ¹-¦}º
«µ°¯
W° £¬ ¯±±²¢}ª ³ ¤ ¤ £ ¢
¸³ - ¹µ°¯}ª º
® ¬ ³ ~¢¬» °°}» ±¼,00°°¦ ½³ «¾¼,00¦/}ª|
³ } ¢ ¦ ¢¡
· §¬¢¡
ORGAN
IZATION STRUCTURE
HOLDING COMPANY
BUSINESS UNITS
GOVERNMENT RELATIONS
Santiaji Gunawan LEGAL
Rachmat Hutama
BUSINESS UNIT INFRASTRUCTURE OPERATIONS
Antonius Aris Sujatmiko
PROGRAM MANAGEMENT OFFICE INFRASTRUCTURE
Danu Prijambodo
UNIT LAYANAN JARINGAN GAS RUMAH TANGGA
Manangap Napiptulu
GAS SUPPLY
Ivanna Laksmini Devi
MARKETING AND PRODUCT DEVELOPMENT
Adi Munandir CENTER OF TECHNICAL
EXCELLENCE
Raka Haryo Indro STRATEGIC PLANNING
Hertyasmawan Ery Fitriadi
BUSINESS AND TECHNOLOGY DEVELOPMENT
Sri Nanda Parwati
PORTOFOLIO AND
PERFORMANCE MANAGEMENT
Amanarita
CORPORATE COMMUNICATION
Irwan Andri Atmanto
CORPORATE SUPPORT AND SERVICES Desima E. Siahaan
PRESIDENT DIRECTOR
Hendi Prio Santoso
DIRECTOR OF STRATEGIC AND BUSINESS DEVELOPMENT
Muhammad Wahid Sutopo
DIRECTOR OF INFRASTRUCTURE AND TECHNOLOGY
Dilo Seno Widagdo
DIRECTOR OF COMMERCE
Danny Praditya
CORPORATE SECRETARY Heri Yusup
BUSINESS UNIT GAS PRODUCT
Gambar
Dokumen terkait
Toha, Suherman, et.al., 2013, Penelitian Hukum tentang Perbandingan Tujuan dan Pola Kerja Yayasan di Beberapa Negara dan Kemungkinan Penerapannya di Indonesia,
3 Kepada para penyedia jasa / perusahaan yang telah mengikuti Pemilihan Langsung pada paket pekerjaan tersebut diatas, yang keberatan dengan Pengumuman ini dapat
[r]
Bahwa sesuai dengan Peraturan Presiden Republik Indonesia 4 Tahun 2015 tentang Perubahan Ke empat Atas Peraturan Presiden Nomor 54 Tahun 2010 Tentang Pengadaan Barang/Jasa
Dokumen Pengadaan yang dirubah (addendum) adalah pada Bab IV Lembar Data Pemilihan (LDP) terutama pada Huruf N Jaminan Sanggahan Banding Angka1 Besar Jaminan Sanggahan
Sehubungan dengan telah dilakukan evaluasi administrasi, teknis dan harga serta evaluasi dokumen kualifikasi, maka sesuai dengan jadwal LPSE akan dilakukan
Pada hari ini Kamis tanggal Delapan Belas bulanAgustus tahun Dua Ribu Enam Belas, kami yang bertanda tangan di bawah ini POKJA Dinas Pekerjaan Umum Sumber Dana Alokasi Umum (DAU)
Di dalam kegiatan penelitian dan cara untuk memperoleh data maupun keterangan yang dibutuhkan oleh penulis dalam penyusutan skripsi ini, dapat dijelaskan
