Robinson, D., Yu, H., Zeller, W. P., & Felten, E. W. (2009). Government data and the invisible hand. Yale Journal of Law & Technology, 11, 159–175.
Rose, W. R., & Grant, G. G. (2010). Critical issues pertaining to the planning and implemen-tation of E-government initiatives. Government Information Quarterly, 27, 26–33.
Tapscott, D., Williams, A. D., & Herman, D. (2008). Government 2.0: Transforming govern-ment and governance for the twenty-first century. Austin, TX: nGenera Corporation. Re-trieved February 20, 2011, from http://wiki.dbast.com/images/a/aa/Transforming_govt.pdf. The Knight Commission. (2009). Informing communities: Sustaining democracy in the dig-ital age. Report of the Knight Commission on the information needs of communities in a democracy. Washington, DC: The Aspen Institute. Retrieved February 20, 2011, from http://www.knightcomm.org/wp-content/uploads/2010/02/Informing_Communities_ Sustaining_Democracy_in_the_Digital_Age.pdf.
U.S. Department of Health and Human Services, Substance Abuse and Mental Health Services Administration. (2011). Prevention and public health fund grants. Washington, DC: U.S. Department of Health and Human Services. Retrieved January 27, 2012, from http://info.samhsa.gov/Dissemination/Prevention-and-Public-Health-Fund-Grants/khmp-n2xu.
U.S. Department of State, U.S. Agency for International Development. (2010). Global pulse 2010. Washington, DC: U.S. Department of State. Retrieved May 10, 2011, from http://www.globalpulse2010.gov.
DOES MEASURING PERFORMANCE LEAD TO BETTER PERFORMANCE?
Mary Bryna Sanger
Performance measurement—documenting whether an organization is reaching its goals—has become a growth industry in the United States. But it is not clear what the current vogue for performance measurement has actually produced, especially for municipal governments. In fact, our research suggests that performance mea-surement rarely leads to improved government performance or more efficient and accountable municipal management.
Calls for the demonstration of governmental performance have become ubiqui-tous in the United States in recent years (Kelman, 2007; Marr, 2009; Radin, 2006; Van Dooren & Van de Walle, 2008). Citizens are demanding better results from gov-ernment at a time when resource constraints are increasing, and the level of trust in government at all levels is at an historic low (National Performance Management Advisory Commission, 2010). The recent downturn of the U.S. economy and the decline in revenue for cities and states have only increased the demand for more efficient governance.
that is geared to learning, and also a culture1 that not only measures perfor-mance, but also uses the information to improve administrative performance (Behn, 2003).
The hope is that collecting performance data will create a virtuous circle: perfor-mance measurement will bolster and promote efficient perforperfor-mance management, by improving how an organization accomplishes its tasks and strives to achieve its goals. Better information ought to enable elected officials and managers to demon-strate success, identify poor performance,2and apply the lessons to improving mu-nicipal management.
For example, if a major performance outcome of a city’s department of finance is to maximize the collection of taxes, an annual measure of the proportion of taxes due that were actually collected would be an important measure of the agency’s performance. The department can compare annual measurements and report on how the agency is doing. They can also compare that performance with the finance departments of other cities to benchmark their performance. But knowing how they are doing does not always tell them how they could be doing better. For example, suppose there is a unit that is responsible for send-ing out tax bills. If those bills go to bad addresses, are incorrect, or otherwise confusing to taxpayers, recipients may fail to pay the correct amount at the right time.
A good performance-managed system would measure the bill preparation and mailing units on the multiple dimensions that influence the agency’s outcome. In order to use data to improve performance, one would need to measure continuously over the year to evaluate the impact that operational changes (more timely mailings, clearer bills, improved address checking) have on the timeliness, accuracy, and proportion of payments that are collected. This would require relentless follow-up. Measuring aggregate agency performance once a year for overall accountability would never capture the right data over the appropriate timeframe to help with this kind of learning (Behn, 2003, 2006). Learning requires access to frequent, timely, operational measures and regular meetings where leadership can ask questions and follow up on the results of previous management decisions. Thus, organizational learning requires both structural and cultural elements that are mutually supportive (Moynihan & Landuyt, 2009).
Committed leadership is key (Behn, 1991; Khademian, 2002; King, Zeckhauser, & Kim, 2004; Kotter & Heskett, 1992; Kouzes & Posner, 1987; Levin & Sanger, 1994; Moynihan & Ingraham, 2004). Leaders are able to make informed decisions, develop strategy, and communicate key ideas to an organization’s members. Ulti-mately leadership can coordinate organizational components for cultural change necessary for creating a performance-managed operation (Behn, 1991, 2006; Kot-ter, 2001; Levin & Sanger, 2004; Moynihan, 2008, p. 78; Spitzer, 2007, p. 125). Leadership needs to reinforce the value of learning and setting goals, and to em-phasize their relationship to enhancing performance and targeting performance deficits (Behn, 2006). An effective performance management effort requires re-sources, training, support, and rewards for improvement (Marr, 2009). Leadership must develop a culture where organizational units see the value of measurement
1A supportive culture for a learning organization is one that is based on shared experiences, norms, and
understandings that foster intelligent behavior (Senge, 1990). Specifically, motivated leaders provide strong messages about the organizational values, purposes, and support behaviors that use performance data to learn about what drives outcomes and what operation changes might improve them (Behn, 2003, 2006; Sanger, 2008b).
2Behn (2011) sees the identification and targeting of performance deficits as a key leadership challenge
and the relationship between their work and organizational outcomes. The culture needs to provide the opportunity for managerial discretion, risk-taking and some tolerance for well-conceived failures to encourage learning, innovation, and prob-lem solving (Behn, 1991, 2006; Levin & Sanger, 1994; Moynihan & Pandey, 2010; Sanger, 2008a).
But elected leaders and their appointees come and go while public employees re-main for years. Unelected officials may pay lip service to the aspirations of a mayor or a commissioner, while waiting for the next election (Larkin & Larkin, 1996; Sanger, 2008b, p. 625). For performance measurement to have a sustained impact on performance management, a municipal organization has to be forged that takes learning seriously. For a performance culture to endure, it must create and imbed values and routines that reinforce common purpose, accountability for results, and truth about performance results sufficient to produce trust. Organizational mem-bers need a clear definition of performance-driven culture (Marr, 2009, p. 241). Performance measurement alone says little about what is good or bad performance, or how to make it better.
At the same time, advocates of performance measurement assume that the col-lected information will facilitate accountability and transparency, by telling the public, in principle, how well its government officials are doing in accomplish-ing their goals and meetaccomplish-ing public demands. As one expert writes, performance measurement promises “more sophisticated systems [that] will undergird manage-ment processes, better inform resource allocation decisions, enhance legislative oversight and increase accountability”3 (Ammons, 1995, p. 37), but it also plays a political role (de Lancer Julnes, 2008; Johnsen, 2008).
While most public officials who collect performance data claim to use it in prac-tice, recent research that has looked beyond self-reports has raised doubts on this score (Behn, 2002; Berman & Wang, 2000; de Lancer Julnes & Holzer, 2001; Melkers & Willoughby, 2005; Moynihan, 2008). Recent research has raised similar doubts about the real impact of measurement on public opinion. Without effective outlets for active oversight,4 citizens have to rely on the professional judgment of elected officials and managers to evaluate the results of performance measurements (Ho, 2008, p. 195; Sanger, 2004). Selective reporting is a constant temptation (Dixit, 2002; Lynn, Heinrich, & Hill, 2001; Marr, 2009; Moynihan, 2008, p. 5; Propper & Wilson, 2003), and fear of exposure provides incentives for gaming, manipulating, or misrepresenting results (Marr, 2009; Radnor, 2008; Smith, 1995; Van Dooren, Bouckaert, & Halligan, 2010, p. 158).
In fact, our research shows that the current use of performance measurement for improving management performance is surprisingly limited, even in cities that have invested a great deal of time and energy in gathering the relevant information (Behn, 2002; de Lancer Julnes, 2008; de Lancer Julnes & Holzer, 2001). Instead of integrat-ing measurement with management strategies designed to improve administrative performance, most cities use performance measurement in a limited way. Rarely do citizens demand that officials take heed of data the city has collected. As a result, performance measurement is perversely disconnected from actual decisionmaking (de Lancer Julnes, 2008).
Performance measurement continues to be widely used in a large number of American municipalities. Most cities that systematically measure performance see
3Hatry (2008, p. 231) provides a complete taxonomy of all the uses of performance measurement. 4Public participation and citizen involvement in performance measurement has become an important
it as a mark of “good government.” In this way, measurement fulfills an essential political purpose, even if the data are generally ignored by officials in practice.
Performance measurement ought to change behavior. Data should lead to ques-tions about what drives performance and an understanding of the value of mea-surement for organizational learning. Results from hypothesis testing ought to alter managerial operations and improve performance. Thus, performance management should be promoted by a culture of performance measurement and best practice. This research is an effort to investigate that relationship.
ANALYTIC APPROACH
The research began by searching for a comprehensive list of U.S. cities likely to mea-sure the performance of their service delivery. We generated the list of study cities by, first, a search of the literature where research had revealed cities that measure their service delivery performance, and second, contact with multiple organizations that track, support, and reward U.S. cities for their efforts.5This search revealed 198 jurisdictions, for which we were able to locate data on performance measurement efforts in 190 (See list of cities in Appendix A).6
For each of the 198 cities, we undertook a search for public documents that would reveal evidence of citywide performance data for any of four service areas. We chose service areas where we expected the greatest probability of measurement: police, fire, parks and recreation, and public works.7We reviewed all the city doc-uments we found on the web to uncover whether performance data were visible and reported, where it appeared, and the nature of performance measures used. We sought performance reports, city and agency budgets, strategic plans, annual reports on service efforts and accomplishments, and other public documents. From our measures, we ranked cities on the character and quality of their reporting and use of performance data, according to the best practice commonly identified by a number of organizations that promote performance measurement (See endnote 5 and Hatry, 2006).
We characterized the nature of their performance measurement effort by the qual-ity of their measurement and distinguished cities with more developed measures of performance as more mature.8We reviewed the relevant documents and collected data on the character of their measures. We then ranked the cities on the kinds of performance measures we found: whether they measured outcomes and efficiency (as well as outputs, inputs, or workload); whether the measures were benchmarked by time period, compared to comparable cities, and subdivided by precincts or other subunits; and whether they set performance targets against which reported out-comes were compared. All of these characteristics are associated with best practice
5This includes the Government Accounting Standards Board (GASB), the International City/County
Management Association (ICMA), the Urban Institute, the Public Performance and Measurement Re-search Network and the National Center for Public Performance at Rutgers, the Fund for the City of New York’s Center on Government Performance and their awardees, and the Association of Governmental Accountants Service Efforts and Accomplishments Award Program.
6All appendices are available at the end of this article as it appears in JPAM online. Go
to the publisher’s Web site and use the search engine to locate the article at http://www3. interscience.wiley.com/cgi-bin/jhome/34787.
7These are common service areas where the output and outcome measures are relatively straightforward
and least controversial. They top the list for ICMA’s completed surveys reported by jurisdictions.
8We use the concept of maturity because measuring performance well takes time, resources, and
(Hatry, 2006).9 Cities with evidence of all of these characteristics were considered mature or exemplary, but there was a great deal of variation on these and other characteristics that we tracked.
Using this approach clearly has some limitations. For example, our goal was in part to see if cities that are measuring performance well would ultimately see its value for management. Some cities are well known for managing for performance, either for a few or for many service areas (e.g., Baltimore and New York). Several of these cities did not appear on our list, most likely because they were not identified by the sources we used, or because their performance data were not visible in documents we could find on their websites. So we might have missed cities that actually do measure their performance, manage for performance, or both. Further, if the performance measurement system we could observe in any of the public documents online did not exhibit all the dimensions we thought would be most important, they did not appear in our list of the best measurement cities, and thus were not considered when evaluating which were managing for performance. As a result, we may have missed some cities with good measurement systems because we could not find the evidence online. We may also have missed some cities that manage for performance because their measurement systems did not exhibitonline all the dimensions we sought.10
RELATIONSHIPS BETWEEN A CITY’S CHARACTERISTICS AND ITS PERFORMANCE MEASUREMENT SYSTEM
Twenty-seven of the 190 cities we studied met all the characteristics of exemplary performance measurement systems. These were the cities we selected to study sepa-rately in our qualitative analysis. Initially, we explored many bivariate relationships for the 190 cities to see whether there were other factors that might explain vari-ation in the character and quality of their performance measurement efforts. The vast majority of these relationships did not generate statistical significance. Those relationships we did observe were weak.11As a result, we concluded that our origi-nally planned multiple regression analysis was unnecessary. Even so, we were able to rank cities on key factors described above and their measurement efforts, and compare those that were more robust and mature to less developed systems.
We sought to learn more from semistructured interviews with city officials in those 27 cities. We requested three types of interviews: with city and agency leaders, data collectors, and operators. First, we sought mayoral or city manager leadership responsible for performance, and those charged with leadership for collecting or
9Use of citizen surveys and regular public reporting are additional characteristics of best practice, and
though important for accountability and transparency, they are not necessarily required for performance management. Thus, though we tracked these characteristics, we did not include them here.
10We know from other research (Behn, in press; Bratton & Smith, 2001; Sanger 2008a, 2008b) that
Baltimore and New York are two such cities where leadership manages for performance, but they did not appear on our list of exemplary measurement cities.
11We found statistical significance in the relationships between household income and whether the
analyzing the data, or both. In cities where particular agency efforts rather than citywide efforts were observed, we interviewed agency heads or performance mea-surement leadership within them, using a semistructured instrument to determine their initial motivation for measuring performance and the support for organiza-tion, resource commitments, and measurement practices of their efforts. Finally, we sought managers or operators in the agencies that used measurement to man-age. From them, we sought to understand the impact of their measurement efforts on management and their operations.12Specifically, we asked if and how they were managing for performance, the distribution of the results, and the impact of the per-formance management effort. Finally, we did follow-up interviews on the impact of the recession on their commitments. The range of interviewees in each jurisdic-tion allowed for a comprehensive and contextual understanding that would have been absent if only one role was sought. Leadership, for example, could seldom ex-plain operations practices in the agencies. Further, the development, location, and management of the effort varied by jurisdiction, and the relevant players would not have been identified if there had been strict adherence in the interview design to contacting the same job titles in each city.13
A semistructured instrument was used in one-hour telephone interviews with the city officials. Of the 27 cities with highly ranked performance measurement efforts, we were able to interview leadership in 24 (see list of cities in Appendix A).14 We repeated interviews in 10 cities one year later, after the effects of the recession began to be felt, to understand how measurement efforts were influenced by the budget environment and to follow up if we had any missing data.
COMPARING CITIES THAT MEASURE THEIR PERFORMANCE
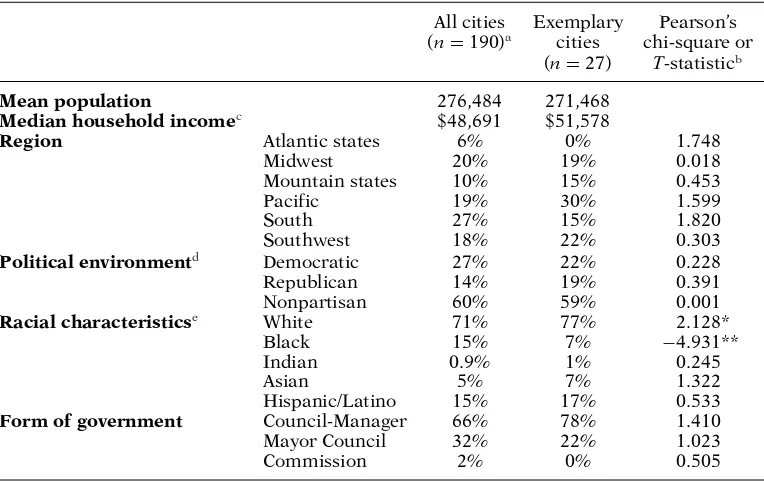
The 190 cities that we found to be measuring performance varied by size, region, type of government, dominant party, and population composition, but the differ-ences were only statistically significant for race, with exemplary cities having a slightly higher proportion of whites and a lower proportion of blacks. We provide descriptions below (see Table 1).
Exemplary cities were not distinguished by size or income, and while they were less likely to be in the Atlantic or Southern region, regional differences were not meaningful. We hypothesized that nonpartisan cities and cities with a professional manager might be more likely to characterize exemplary cities, but none of these differences were statistically significant. Only race mattered. Exemplary cities were more likely to have a smaller proportion of blacks than all cities. But while signifi-cant, the proportional differences are still small.
Cities also varied significantly by the characteristics and maturity of their perfor-mance measurement systems and transparent publishing of data. Some cities have citywide efforts, but for many more we found evidence for the use of performance measurement only in particular service areas, especially police (see Table 2).15These
12While we asked them if they were using performance data to manage, we also asked them how they
used it. Where their responses did not conform to commonly understood practices central to performance management, we did not evaluate them as managing for performance, consistent with their response.
13Similar job titles can have different responsibilities in different cities.
14All appendices are available at the end of this article as it appears in JPAM online.
Go to the publisher’s Web site and use the search engine to locate the article at http:// www3.interscience.wiley.com/cgi-bin/jhome/34787.
15States, cities, and counties generally comply with federal reporting standards (Uniform Crime
Table 1.Characteristics of cities that measure performance.
All cities Exemplary Pearson’s (n=190)a cities chi-square or
(n=27) T-statisticb
Mean population 276,484 271,468
Median household incomec $48,691 $51,578
Region Atlantic states 6% 0% 1.748
Midwest 20% 19% 0.018
Mountain states 10% 15% 0.453
Pacific 19% 30% 1.599
South 27% 15% 1.820
Southwest 18% 22% 0.303
Political environmentd Democratic 27% 22% 0.228
Republican 14% 19% 0.391
Nonpartisan 60% 59% 0.001
Racial characteristicse White 71% 77% 2.128*
Black 15% 7% −4.931**
Indian 0.9% 1% 0.245
Asian 5% 7% 1.322
Hispanic/Latino 15% 17% 0.533
Form of government Council-Manager 66% 78% 1.410
Mayor Council 32% 22% 1.023
Commission 2% 0% 0.505
Sources:American Community Survey 2006, International City/County Management Association, Gov-ernmental Accounting Standards Board, and city Web site accessed 2008 to 2011.
aData could not be located for all cities on every variable.
b*Significance at the 0.05 level. **Significance at the 0.01 level. Pearson’s chi-square test was used
for region, political environment, and form of government. One-sampleT-tests were used for racial characteristics.
cn
=189. American Community Survey 2006 income data not available for Centennial, CO as the city was incorporated in 2001.
dn
= 185. Political environment could not be determined for Farmington, NM; Highland Park, IL; Maryland Heights, MO; and Raytown, MO.
eThis represents the average percentage of each race across cities, not the cumulative racial percentages
of all cities. Means were compared using theT-test.
differences were expected since the variables we selected to do our ranking included many of these best practices specifically.
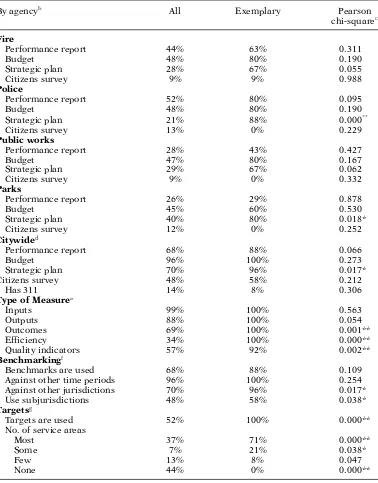
Table 2 shows the differences between all performance measurement cities and those we identified as exemplary based on the characteristics of their measurement systems. When we could not find evidence of citywide performance measurement, we looked at four common service areas: police, fire, public works, and parks and recreation. Exemplary cities were selected by whether they exhibited the charac-teristics that we thought would predispose them to using data to manage. But we were also interested in seeing whether those that had such characteristics would be
Table 2.Performance measurement maturity measures.a
By agencyb All Exemplary Pearson
chi-squarec
Fire
Performance report 44% 63% 0.311
Budget 48% 80% 0.190
Strategic plan 28% 67% 0.055
Citizens survey 9% 9% 0.988
Police
Performance report 52% 80% 0.095
Budget 48% 80% 0.190
Strategic plan 21% 88% 0.000**
Citizens survey 13% 0% 0.229
Public works
Performance report 28% 43% 0.427
Budget 47% 80% 0.167
Strategic plan 29% 67% 0.062
Citizens survey 9% 0% 0.332
Parks
Performance report 26% 29% 0.878
Budget 45% 60% 0.530
Strategic plan 40% 80% 0.018*
Citizens survey 12% 0% 0.252
Citywided
Performance report 68% 88% 0.066
Budget 96% 100% 0.273
Strategic plan 70% 96% 0.017*
Citizens survey 48% 58% 0.212
Has 311 14% 8% 0.306
Type of Measuree
Inputs 99% 100% 0.563
Outputs 88% 100% 0.054
Outcomes 69% 100% 0.001**
Efficiency 34% 100% 0.000**
Quality indicators 57% 92% 0.002**
Benchmarkingf
Benchmarks are used 68% 88% 0.109
Against other time periods 96% 100% 0.254
Against other jurisdictions 70% 96% 0.017*
Use subjurisdictions 48% 58% 0.038*
Targetsg
Targets are used 52% 100% 0.000**
No. of service areas
Most 37% 71% 0.000**
Some 7% 21% 0.038*
Few 13% 8% 0.047
None 44% 0% 0.000**
more likely to report their performance to citizens through performance reports, and elicit citizen’s preferences and needs through the use of citizen surveys and 311 reporting efforts. With the exception of police, exemplary cities were more likely to have a strategic plan. This is not surprising since strategic planning identifies goals and targets and presumably measures their achievement over time.
Table 2.Continued.
By agencyb All Exemplary Pearson
chi-squarec
Frequent reportingh
Performance report 5% 5% .830
Strategic plan 0% 0%
-Sources:American Community Survey 2006, International City/County Management Association, Gov-ernmental Accounting Standards Board, and city Web sites accessed 2008 to 2011.
aTotal possible ofn
=190 for “all” cities,n=27 for “exemplary” cities.
bAll:Performance report: firen
=70; policen=83; public worksn=67; parksn=65. Budget: firen= 32; policen=32; public worksn=35; parksn=34. Strategic plan: firen=56; policen=56; public worksn=58; parksn=68. Citizens survey: firen=78; policen=80; public worksn=79; parksn= 78.Exemplary:performance report: firen=8; policen=10; public worksn=7; parksn=7. Budget: firen=4; policen=5; public worksn=5; parksn=5. Strategic plan: firen=6; police:n=8; public worksn=6; parksn=10. Citizens survey: firen=11; police, public works, and parksn=10.
cCategories with * are significant at the 0.05 level, ** at the 0.01 level.
dAll:Performance reportn
=188; Budgetn=190; Strategic plann=188; Citizens surveyn=189; Has 311n=190.Exemplary:n=27 on all measures.
eAll:Inputs, Outputs, and Outcomesn
=190; Efficiency and Qualityn=189.Exemplary:n=27 on all measures.
fAll:Benchmarks are usedn
=186; Against other time periods and jurisdictionsn=178; Use subjuris-dictionsn=179.Exemplary:n=27 on all measures.
gAll:Targets are used n
=189; No. of service areasn=180.Exemplary:n=27 on all measures.
hRepresents the percent of public reports conducted more frequently than annually.All:Performance
reportn=139; Strategic plann=75.Exemplary:Performance reportn=24; Strategic plann=16.
frequently. Most of these are statistically significant. This was expected since they were ranked and selected because their measurement practices were characterized by best practice.
MATURE PERFORMANCE MEASUREMENT SYSTEMS CAN CREATE THE CAPACITY FOR PERFORMANCE MANAGEMENT
consistent with the requirements for performance management.16 We were inter-ested in the potential that any performance measurement effort had to use data in these ways. And if they did, we recognized the increased likelihood that they would be managing for performance, or at least have more capacity to do so.
Cities varied significantly on the characteristics of their performance measure-ment efforts. Most cities (68 percent) were found to measure citywide performance efforts, even if most of them did not exhibit all of the characteristics we associated with a mature system (See Table 2). Even for those whose performance measure-ment was mature, few report their performance publicly more regularly than an-nually or collect and report data on a subjurisdictional level. The great majority of cities do not collect data often or disaggregate what they do collect in ways likely to induce hypotheses about what drives differential performance. Indeed, most cities simply do not measure the differential performance of operating units within their agencies (See Table 2).
WHAT CHARACTERIZED THE CITIES WITH MATURE SYSTEMS?
Cities with mature systems were, in general, not very different from the larger sample (see Table 1). They were more likely to have a manager-council form of government and more likely to have a nonpartisan system, but these differences are not statisti-cally significant. The cities where we conducted interviews were slightly more likely to be from the Southwest and the Pacific coast, but again, these differences were not statistically significant. One statistically significant difference, however, is that ma-ture cities or their agencies were more likely to have a strategic plan. Strategic plans call for an agency to identify its important public purposes and to lay out a plan to accomplish them. Performance information that is generated through strategic planning and resulting performance measurement routines can connect informa-tion to decision venues (Moynihan, 2008, p. 5). Thus, we would expect the existence of strategic planning to be associated with mature performance measurement efforts and perhaps be more likely to support performance management.
In almost all the cities with the most mature performance measurement efforts, collection and distribution of performance data reside in the city’s budget office or is formalized as part of the budget process; in a few cities, including Minneapolis, Minnesota; Tacoma, Washington; and Westminster, Colorado, the effort resides instead, or in addition, in the city manager’s office, and in one city, in the auditor’s office. Most cities said they were motivated to invest in performance measurement for accountability, that is, to demonstrate their openness to scrutiny about their operations. Some were motivated to report to the public (to report to citizens in Alexandria, Virginia, and Ankeny, Iowa), and others for internal purposes. They also frequently reported that they were motivated by a desire to adopt a best practice or to use a cutting edge approach.17 As an official from Westminster, Colorado, reported, “sophisticated governments are engaged in performance measurement.” An official in Corvallis, Oregon, said they began because “everybody was doing it.” Some, however, saw the potential for improved management at the outset. The
16Behn (2011) identifies recognizing performance deficits as critical for improving performance. Targets
are an explicit recognition that an operation can do better.
17Performance measurement is promoted in professional organizations for public managers, where
promotion of Compstat in New York City and Citistat18 in Baltimore, Maryland, had popularized the notion and methods of managing for performance, and that motivated some jurisdictions to explore measurement’s value. A councilman in Long Beach, California, we learned, persuaded the council and city manager to adopt a performance measurement system on that basis.
As in Long Beach, California, performance measurement was typically the brain-child of a key city leader, usually the city manager or mayor, but sometimes the city council or some champion within it. In a few cases, citizen efforts supported adop-tion, such as in Ankeny, Iowa, where a number of cities in the state had funding from the Sloan Foundation to undertake citizen-centric performance measurement. The budget office, however, remained the champion of the effort inside city government. A variety of factors are thought to influence the development, maintenance, and use of performance measurement (de Lancer Julnes, 2008; Kelly, 2002; King, Zeck-hauser, & Kim, 2004; Moynihan, 2008; Moynihan & Landuyt, 2009). Willingness and the ability to undertake the effort generally derives from leadership that understands and communicates the value, allocates the resources, and insures system integrity. Organizational culture is also important to create and support a learning organiza-tion that invests in performance data and can see the value of its use (Khademian, 2002; Moynihan, 2008; Sanger, 2008b). While a citywide culture of measurement and evidence-based decisionmaking is occasionally apparent—and we observed a few examples, such as Charlotte, North Carolina, and Tacoma, Washington—rarely is the effort uniform across agencies. More often, we observed pockets of real energy and other areas of city government with little enthusiasm.
Given the importance of leadership in developing robust performance measure-ment systems, we expected to find that active and enduring leadership that supports performance measurement efforts would be associated with maintenance of effort; the loss of that leader correlates with waning investment. Further, in cities with existing performance measurement systems, changes in leadership were often as-sociated with changes in investment in performance measurement. Long Beach, California, is instructive. With a long history of performance measurement, a com-mitted city council and city manager, and a performance management office that originally resided in the city manager’s office, a former budget official and perfor-mance management staffer we interviewed reported a declining commitment. The effort has been rolled into the budget office and “the new city manager is not as fervent as the last one, and the city council is not as ‘sold’ either,” she said.
Finally, the fiscal crisis of U.S. cities associated with the recent national recession has depleted local treasuries around the country, resulting in reductions in staff and personnel. In annual surveys by the National League of Cities, city finance officers reporting on the condition of their cities confirmed increasing rates of hiring freezes, salary and wage reductions, layoffs among municipal employees, and service cuts in their jurisdictions from 2009 through 2010 (National League of Cities, 2009, 2010). Indeed, in 2009, nine of 10 reported that they were making spending cuts and predicted further cuts in 2010.
While we may theorize that performance measurement is particularly well suited to a resource-constrained environment when the need to demonstrate that the re-sults of investments is emphasized, our interviews painted a very different picture. Indeed, in our follow-up interviews, officials in cities with a history of investment in measurement frequently reported reduced efforts. The program management
18A citywide, data-driven performance management system for all city agencies based on the New York
coordinator in the Office of Management and Budget in Alexandria, Virginia, for example, reported that they “dropped their quarterly performance report last year because of other pressures, and cancelled this year’s performance report entirely.” The internal auditor in Reno, Nevada, reported that interest had dwindled, particu-larly once the prior city manager left, and they “dropped out of ICMA [International City/County Management Association] to save the annual $5,500 fee.” Scottsdale, Arizona, reported that they also dropped out of ICMA; a senior advisor for re-sults tracking and reporting remarked that performance measurement “could be the casualty of the budget climate.” A follow-up interview with the city manager of Corvallis, Oregon, revealed pressure to cut $2.5 million from a $118 million budget. He reported delays in posting “this year’s report card . . . I would not say that there have been cuts to monies allocated to performance measurement, but simply that we have fewer staff resources to absorb ongoing performance measurement work on a timely basis.” Urbandale, Iowa, reported that “the data generated had become overwhelming. We are moving even more toward an annual report format.”
The experience of Lynnwood, Washington, also illustrates larger trends we ob-served. Early in 2000, a councilman proposed and spearheaded passage of a “per-formance management results act” that mandated the collection and dissemination of performance-related data. Consultants hired to help in system development be-gan with two service areas: parks and recreation and courts. Agencies collected and analyzed their own data, which was challenged by the budget office only when it aroused curiosity.19While expanding the system to additional agencies, the budget coordinator began to deemphasize its use. Ironically, the councilman who originally spearheaded the effort was elected mayor and now pays it little attention. While we can only speculate, his neglect of a strongly held commitment following his election may suggest his lack of appetite for the increased scrutiny and the political risks that performance measurement and management would pose. Now, leadership has waned almost entirely, the effort has no teeth, and the value and potential of its use for management has been largely abandoned. The only support for the effort is car-ried by a part-time budget coordinator, who reported that she is charged largely with collecting ICMA benchmarking data. “The departments,” she reported, “don’t even have their own budget analysts.” We have found that 10 of 24 cities with initially robust efforts now report that efforts are waning.
FROM MEASUREMENT TO MANAGEMENT
Performance measurement efforts, however initially popular, are inherently fragile. Even in places where the performance measurement system was robust, contin-ued support is subject to changing leadership and priorities; further, these efforts sometimes fall victim to the politics of transparency where the risk of exposure to failure can create internal resistance to accountability. Without a strong culture of measurement where employees deep in the organization see and value the contribu-tion of measuring performance, internal sabotage is possible and often predictable (Radnor, 2008; Sanger, 2008a; Smith, 1995; Van Dooren, Bouckaert, & Halligan, 2010, p. 158).
Fear of exposure to failure may create pressures to distort or even corrupt the data, so auditing of data is crucial. However, when we asked how data reliability is ensured, only two cities actually reported that they audit (Scottsdale, Arizona, and Sunnyvale, California). Another reported that they did “spot checks” (Olathe,
19It appeared that no formal auditing effort was in place. This would seem to encourage data
Kansas). An internal auditor in Reno, Nevada, when asked if the city’s performance data were audited, reported that several years ago, a deputy at the fire department who had been responsible for submitting their ICMA data was fired. They went in and checked his files to pick up his methodology and discovered that he had simply been making up his numbers all along.20
Due to these inherent liabilities, we see the survival of robust performance mea-surement systems in far fewer jurisdictions than we expected. Even so, we sought to determine how many of them had moved from performance measurement to performance management. Here, we will distinguish in our discussion those who claimed to be using measures to manage, from those who we consider to be truly employing performance management. There were more cities whose officials said they use performance data to manage than those for whom we could find evidence that they did. For example, if they reported that they did not collect, review, and analyze data more frequently than quarterly, it was our judgment that they were not managing for performance, because they could not be using timely operational data to test hypotheses about what is driving changes in performance. Only eight of 24 cities claimed to be analyzing data as often as monthly; only three reported that they met weekly to analyze the data. Finally, only five of 24 thought they had sufficient resources committed to performance management.
We were also interested in exploring whether there was a learning orientation at the city or agency level. This was a condition we thought was essential for building and sustaining a performance management system. We explored in our interviews how data were used by managers and executives to promote learning in the orga-nization. Typically, a learning environment would be reflected in what happened in regular meetings where managers are required to report on their performance and the impacts of operational changes they make in response to it from meeting to meeting.
We asked all 24 jurisdictions if they used data to manage. While eight cities re-ported that they analyzed data monthly, only seven of 24 definitively responded that they used performance data to manage. Several others claimed to be moving in that direction, but among our high-performing cities, only Charlotte, North Car-olina; Corpus Christi, Texas; Minneapolis, Minnesota; and perhaps Long Beach, California, have the necessary culture and preconditions to support performance management according to our parameters. Some jurisdictions talked about perfor-mance management as an “evolutionary process.” Others, such as Las Cruces, New Mexico, and Fort Collins, Colorado, see the value of managing for performance and have it as a goal, but are not there yet. As the budget analyst we interviewed in Fort Collins reported when asked if anyone is sitting down on a weekly or monthly basis to look at the data, “we are trying; it’s our goal, but I do not know anyone who really does it.”
A line manager we interviewed in the street maintenance division in Charlotte, North Carolina, captured the necessary learning and management process, but we failed to see this in most of the other cities. When we asked the deputy street super-intendent about their process for using performance data to manage, he described it this way
We meet once a month on a regular basis . . . in the meeting we talk and compare our three maintenance facilities with each other and to other standard outputs in the field.
20Marr (2009) provides data from the largest performance management study internationally conducted
We are looking for data that stands up and then looking at why it stands up. It can be on both sides of the coin, areas that we are doing something better or worse; we compare our facilities and between them with standards in the industry. We aren’t looking to find failures in each facility; we want to improve. We have a corporate view approach; we are looking if someone is doing better and trying to learn why, how, what are they doing? We use this as a learning process and we try to capitalize on success.
Corpus Christi, Texas, another city that manages for performance, is using a balanced scorecard (Kaplan & Norton, 1996) and developing a performance man-agement effort where each agency’s performance scorecard rolls up into a city score-card. They began their measurement effort more than 10 years ago, and there has been enormous personal investment by the city manager, use of outside consultants, and even retreats with the city council. Support is reported to be strong for both performance measurement and management. When queried about how he uses per-formance measures to manage, the assistant city manager described an electronic data system that uploads data on a daily basis, with reminders placed on managers’ computer screens to check their data daily. Reports are run monthly, and the city manager has monthly meetings with agencies to review the data. Agency heads meet with their supervisors prior to the monthly meetings. All measures have set targets, but they are realistic and set in collaboration with the departments. “The environment is supportive of learning, so there are no sanctions used for missing a target . . . where instead, missing a target provokes questions and a learning op-portunity,” said the interim assistant city manager. She reported that the data are disseminated only internally, although the aggregate agency performance findings appear in the annual report and budget documents. This level of scrutiny and use of performance data to manage performance, she reported, has only developed over the last two years, even though the effort began over 10 years ago. A culture of measurement and evaluation reflects itself in the data collection, analysis practices, and expectations of managers and line workers throughout the organization. Fur-ther, learning cultures subject these data to scrutiny by regularly asking questions. These cultures are more likely to generate hypotheses about what drives perfor-mance and to encourage hypothesis testing and innovation in operations to improve it.
When asked about the lessons from their efforts, most of our high-performing cities emphasized the need to go slow and to move toward performance manage-ment stepwise. But few, as we have seen, are using performance measuremanage-ment to manage, and even in efforts with a long history, leadership, predisposing cultures, and significant investment, systemic and imbedded performance management rou-tines were hard to find.
DISCUSSION AND CONCLUSION
Our findings were disappointing but instructive. We hypothesized that having a more mature measurement system might lead to efforts to manage for performance. Our analysis found no clear link between demographic and governance characteris-tics of cities and the robustness of performance measurement systems. More trou-bling, even among jurisdictions with exemplary performance measurement efforts, we found only a few who used performance data to manage.
lead to better management. Many researchers, good government groups, and advo-cates see the value of measuring performance as a desirable end in itself, promoting accountability and improving transparency to citizens. If outcomes and efficiency are also measured, public officials have some evidence of program performance that is useful to justify budget requests, and the literature has shown increasing use of performance data for that purpose. But performance data, even appropriate and sophisticated outcome measures, do not tell why the outcome occurred. A perfor-mance management system is necessary to generate the management structures and the kind of useful data that allows organizations to learn what operational elements drive performance. We have seen that this requires leadership, a learning organiza-tion, and a culture that both supports innovation and experimentaorganiza-tion, and tolerates well-conceived failures (Sanger 2008b). These organizations collect the right kind of data in a timely fashion, analyze the data, meet regularly, and follow-up relent-lessly.21As we have seen in Charlotte, North Carolina, and Long Beach, California, for example, managers have the right kind of data and management structures to do this.
Why do good performance measurement systems so rarely lead to robust per-formance management systems? For the most part, cities do not use perper-formance measurement to manage, and those that do are vulnerable to obstacles from within agencies and from external stakeholders. The effects of shifting political and agency leadership, unstable resources, the changing political fortunes of champions, re-sistant public employees, and varying levels of citizen engagement tend to alter forces that sustain efforts (Bourdeaux, 2006; de Lancer Julnes & Holtzer, 2001; Moynihan & Ingraham, 2004; Sanger 2008a; Van Dooren, Bouckaert, & Halligan, 2010). Interviews with those we thought most likely to have embraced performance management provide support for these views.
This research has looked at cities that measure their performance; the evidence came directly from what we found in their public documents. We looked at citywide efforts as documented in city reports and budgets, and where they were absent, at agency documents. This approach may have missed everything happening on the ground and perhaps our methodology biased our results. What is publicly reported or available may not fully capture what managers collect and use. Some of the cities where we did not find all the elements of a mature system on the web may be using performance management approaches in their agencies and may be manag-ing for results, but these may not have been online or derived from an exemplary performance reporting system. Further, some have argued that the use and value of performance measurement may be more indirect and thus less observable (de Lancer Julnes, 2008).
There can be mandates for performance reporting, but “the other factors are difficult to legislate (culture, leadership, worker beliefs, the nature of clients and stakeholders)” (Moynihan, 2008). The vigor with which performance mea-surement is embraced and exploited for management is subject to a complex set of conditions, many of which are beyond the control of legislatures, city mayors, managers, and agency heads (Moynihan & Pandey, 2005). Even so, evidence continues to support the notion that success is most evident at the agency level when leadership is strong and stable, a learning culture is built with imbedded routines, and managerial discretion and external political sup-port is available. Even within our most exemplary jurisdictions, the level of polit-ical, resource, and managerial investment varies by agency, over time, and with
21These are key elements of the successful PerformanceStat models that are growing in popularity
changing agency and city leadership. The ability to bring about performance-driven change is thus highly constrained, subject to multiple and powerful ob-stacles, and more likely to be successful where more organizational autonomy is possible.
Great expectation has accompanied the performance movement both in the United States and internationally (Kettl, 2000; Kelman, 2007; Marr, 2009; National Performance Management Advisory Commission, 2010; Van Dooren, Bouckaert, & Halligan, 2010). Significant accomplishment can be identified (Behn, n.d.; Ingra-ham, Joyce, & Donahue, 2003; Moynihan, 2008; Sanger, 2008a, 2008b). An abun-dance of “good government” groups continue to promote, support, and fund best practice efforts for governments at all levels to measure and report their perfor-mance, and enormous amounts of resources are devoted to these activities. Most of those we interviewed cited these influences as the compelling reasons that launched their systems. But we have also seen that even cities with the best intentions have failed to fully realize the promise of these methods. Measuring performance and improving it are two different activities, and our research highlights the many questions that remain. Whether we have oversold the performance movement is clearly one question (Van Dooren, Bouckaert, & Halligan, 2010). If we cannot link the performance measurement movement to improved management, and if we cannot demonstrate the performance returns to performance management, we are by necessity weakening the case for continued investment and strength-ening the case for improved research on the cost effectiveness and value of these efforts.
We know little about the returns to performance-managed systems and how much they actually work to improve performance.22Thus, as we see reduced investment in both performance measurement and management with contracting budgets, even in our exemplary cities, we may need to ask ourselves how much it matters and how much effort should continue to be placed in promoting it.23 More and better research will be necessary to answer those questions, but in the face of the evidence to date, our expectations should be modest.
MARY BRYNA SANGER is Deputy Provost and Senior Vice-President of Academic Affairs, Professor of Urban Policy and Management, New School, 66 West 12th Street, New York, NY 10011.
ACKNOWLEDGMENTS
This research was funded by the Einhorn Research Award from the Academy for Governmen-tal Accountability of the Association of Government Accountants. I am grateful to a group of research assistants and interviewers who helped over several years with the data collection effort: Margaret Goodwin, Jackie Moynahan, Kelly Johnstone, Sierra Stoneman-Bell, Andrew French, and Roy Abir.
REFERENCES
Ammons, D. N. (1995). Accountability for performance: Measurement and monitoring in local government. Washington, DC: ICMA Press.
22None of the jurisdiction we interviewed could tell us what the performance returns were from their
investments, no less the resource savings. No one was even asking those questions.
23This is not to say that measuring performance and reporting on it does not have an important value
Behn, R. D. (1991). Leadership counts. Cambridge, MA: Harvard University Press.
Behn, R. D. (2002). The psychological barriers to performance management: Or why isn’t everyone jumping on the performance-measurement bandwagon? Public Performance & Management Review, 26, 5–25.
Behn, R. D. (2003). Why measure performance? Different purposes require different mea-sures. Public Administration Review, 63, 586–606.
Behn, R. D. (2006). Performance leadership: 11 better practices that can ratchet up perfor-mance. Washington, DC: IBM Center for the Business of Government.
Behn, R. D. (2008). The seven big errors of PerformanceStat. Cambridge, MA: John F. Kennedy School of Government, Harvard University.
Behn, R. D. (2011, November). PerformanceStat is a leadership strategy, not a model or a system: Or why MimicStat can’t really work. Paper prepared for the Annual Research Conference of the Association for Public Policy Analysis and Management, Washington, D.C.
Behn, R. D. (n.d.) The PerformanceStat potential: A leadership strategy for producing results. Unpublished manuscript.
Berman, E., & Wang, X. (2000). Performance measurement in U.S. counties: Capacity for reform. Public Administration Review, 60, 409–420.
Bourdeaux, C. (2006). Do legislatures matter in budgetary reform? Public Budgeting & Fi-nance, 26, 31–43.
Bratton, W., & Smith, D. (2001). Performance management in New York City: Compstat and the revolution in police management. In D. Forsythe (Ed.), Quicker, better cheaper: Performance management in American Government. Albany, NY: Rockefeller Institute Press.
De Lancer Julnes, P. (2008). Performance measurement beyond instrumental use. In W. Van Dooren & S. Van de Walle (Eds.), Performance information in the public sector: How it is used. Basingstoke, UK: Palgrave Macmillan.
De Lancer Julnes, P., & Holzer, M. (2001). Promoting the utilization of performance measures in public organizations: An empirical study of factors affecting adoption and implementa-tion. Public Administration Review, 61, 693–708.
Dixit, A. (2002). Incentives and organizations in the public sector. Journal of Human Re-sources, 37, 696–727.
Hatry, H. (2006). Performance measurement: Getting results (2nd ed.). Washington, DC: The Urban Institute Press.
Hatry, H. (2008). Epilogue: The many faces of use. In W. Van Dooren & S. Van de Walle (Eds.), Performance information in the public sector: How it is used. Basingstoke, UK: Palgrave Macmillan.
Ho, A. (2008). Reporting public performance information: The promise and chal-lenges of citizen involvement. In W. Van Dooren & S. Van de Walle (Eds.), Perfor-mance information in the public sector: How it is used. Basingstoke, UK: Palgrave Macmillan.
Ingraham, P. W., Joyce, P. G., & Donahue, A. K. (2003). Government performance: Why management matters. Baltimore, MD: Johns Hopkins University Press.
Johnsen, ˚A. (2008). Performance information and educational policy making. In W. Van Dooren & S. Van de Walle (Eds.), Performance information in the public sector: How it is used. Basingstoke, UK: Palgrave Macmillan.
Kaplan, R., & Norton, D. (1996). The balanced scorecard: Translating strategy into action. Boston: Harvard University Press.
Kelly, J. M. (2002). If you only knew how well we are performing, you’d be highly satisfied with the quality of our service. National Civic Review, 91, 283–292.
Kettl, D. F. (2000). The global public management revolution: A report on the transformation of governance. Washington, DC: Brookings Institute Press.
Khademian, A. (2002). Working with culture: The way the job gets done in public organiza-tions. Washington, DC: CQ Press.
King, D. C., Zeckhauser, R. J., & Kim, M. T. (2004). The management performance of the U.S. states. Faculty Research Working Papers Series. Cambridge, MA: Kennedy School of Government, Harvard University.
Kotter, J. P. (2001). What leaders really do. Harvard Business Review, 79, 85–96.
Kotter, J. P., & Heskett, J. L. (1992). Corporate culture and performance. New York: Macmil-lan.
Kouzes, J., & Posner, B. (1987). The leadership challenge: How to get extraordinary things done in organizations. San Francisco, CA: Jossey-Bass.
Larkin, T. J., & Larkin, S. (1996). Reaching and changing frontline employees. Harvard Business Review, 74, 95–105.
Levin, M. A., & Sanger, M. B. (1994). Making government work: How entrepreneurial execu-tives turn bright ideas into real results. San Francisco, CA: Jossey-Bass.
Lynn, L. E., Jr., Heinrich, C. J., & Hill, C. J. (2001). Improving governance: A new logic for empirical research. Washington, DC: Georgetown University Press.
Marr, B. (2009). Managing and delivering performance: How government, public sector, and not-for-profit organizations can measure and manage what really matters. Oxford, UK: Butterworth-Heinemann.
Melkers, J. E., & Willoughby, K. G. (2005). Models of performance-measurement use in local governments: Understanding budgeting, communication, and lasting effects. Public Administration Review, 65, 180–191.
Moynihan, D. P. (2008). The dynamics of performance management: Constructing informa-tion and reform. Washington, DC: Georgetown University Press.
Moynihan, D. P., & Ingraham, P. W. (2004). Integrative leadership in the public sec-tor: A model of performance information use. Administration & Society, 36, 427– 453.
Moynihan, D. P., & Landuyt, N. (2009). How do public organizations learn? Bridging struc-tural and culstruc-tural divides. Public Administration Review, 69, 1097–1105.
Moynihan, D. P., & Pandey, S. K. (2005). Testing how management matters in an era of government by performance management. Journal of Public Administration Research and Theory, 15, 421–439.
Moynihan, D. P., & Pandey, S. K. (2010). The big question for performance management: Why do managers use performance information? Journal of Public Administration Research and Theory, 20, 849–866.
National League of Cities. (2009). Research brief on America’s cities: City fiscal conditions in 2009. Washington, DC: Author.
National League of Cities. (2010). Research brief on America’s cities: City fiscal conditions in 2010. Washington, DC: Author.
National Performance Management Advisory Commission. (2010). A performance manage-ment framework for state and local governmanage-ment: From measuremanage-ment and reporting to management and improving. Chicago: Author
Propper, C., & Wilson, D. (2003). The use and usefulness of performance measures in the public sector. Oxford Review of Economic Policy, 19, 250–267.
Radin, B. A. (2006). Challenging the performance movement: Accountability complexity and democratic values. Washington, DC: Georgetown University Press.
Sanger, M. B. (2004, November). Bringing citizens back in: Performance measurement and government accountability. Paper presented at the Annual Research Conference of the Association for Public Policy Analysis and Management, Atlanta, GA.
Sanger, M. B. (2008a). From measurement to management: Breaking through the barriers to state and local performance. Public Administration Review, 68, 70–85.
Sanger, M. B. (2008b). Getting to the roots of change: Performance management and orga-nizational culture. Public Performance and Management Review, 31, 620–652.
Senge, P. (1990). The fifth discipline: The art and practice of the learning organization. New York: Doubleday.
Smith, P. (1995). On the unintended consequences of publishing performance data in the public sector. International Journal of Public Administration, 18, 277–311.
Spitzer, D. (2007). Transforming performance measurement: Rethinking the way we measure and drive organizational success. New York: American Management Association.
Van Dooren, W., & Van de Walle, S. (Eds.). (2008). Performance information in the public sector: How it is used. Basingstoke, UK: Palgrave Macmillan.
Appendix A: Performance Measurement Cities
1. Abilene, TX 2. Albany, GA 3. Albuquerque, NM 4. Alexandria, VAa
5. Alpharetta, GAb
6. Anchorage, AK 7. Ankeny, IAa
8. Ann Arbor, MI 9. Arlington, TX 10. Asheville, NC 11. Auburn, AL 12. Aurora, CO 13. Austin, TX 14. Baltimore, MD 15. Bellevue, WA 16. Billings, MT 17. Bothell, WA 18. Bowling Green, KY 19. Bridgeport, CT 20. Broken Arrow, OK 21. Bryan, TX
22. Carlsbad, CA 23. Casper, WY 24. Centennial, CO 25. Chandler, AZ 26. Charlotte, NCa
27. Charlottesville, VA 28. Chattanooga, TN 29. Chesapeake, VA 30. Cleveland, OH 31. College Station, TX 32. Collinsville, IL 33. Colorado Springs, CO 34. Columbus, OH 35. Concord, NH 36. Coral Springs, FL 37. Corpus Christi, TXa
38. Corvallis, ORa
39. Dallas, TX 40. Danville, VA 41. Davenport, IA 42. Dayton, OH 43. DeKalb, IL 44. Denver, CO 45. Des Moines, IA 46. Detroit, MI
47. District of Columbia 48. Duluth, GA
49. Duncanville, TX 50. Durham, NC 51. East Providence, RI 52. Elgin, IL
54. Eugene, OR 55. Evanston, IL 56. Farmers Branch, TX 57. Farmington, NM 58. Fishers, IN 59. Fort Collins, COa
60. Fort Worth, TX 61. Franklin, TN 62. Fresno, CA 63. Fullerton, CA 64. Gainesville, FL 65. Gladstone, MO 66. Goodyear, AZ 67. Greensboro, NC 68. Hampton, VA 69. Harrisonburg, VA 70. Hartford, CT 71. Hayward, CA 72. Henderson, NV 73. Highland Park, IL 74. Hillsboro, OR 75. Houston, TX 76. Indianapolis, IN 77. Irving, TXa
78. Jacksonville, FL 79. Johnson City, TN 80. Kansas City, MO 81. Keller, TXb
82. Kennesaw, GA 83. Kennewick, WA 84. Kent, WA 85. Kirkland, WA 86. Kirkwood, MO 87. Laredo, TX 88. Las Cruces, NMa
89. Las Vegas, NV 90. Lauderhill, FL 91. Long Beach, CAa
92. Longmont, CO 93. Longview, TX 94. Los Angeles, CA 95. Loveland, CO 96. Lynchburg, VA 97. Lynnwood, WAa
98. Marietta, GA
99. Maryland Heights, MO 100. McAllen, TX
101. McHenry, IL 102. Mesa, AZ 103. Milwaukee, WI 104. Minneapolis, MNa
169. Sunnyvale, CAa
170. Tacoma, WAa
171. Tallahassee, FL 172. Tigard, OR 173. Tucson, AZ 174. Tyler, TX
175. University Place, WA 176. Urbandale, IAa
177. Vallejo, CA 178. Vancouver, WA 179. Virginia Beach, VA 180. Vista, CA
181. West Hartford, CT 182. West Jordan, UT 183. Westminster, COa
184. Winchester, VA 185. Winston-Salem, NC 186. Winter Garden, FL 187. Woodbury, MN 188. Worcester, MA 189. Yakima, WA 190. Yuma, AZ
aCities that we ranked as exemplary.