http://dx.doi.org/10.17503/Agrivita-2012-34-2-p127-135
GENETIC DIVERSITIES IN THE SIXTH - GENERATION OF SELECTION (S6)
OF SOME INBRED LINES OF MAIZE
BASED ON THE PHENOTYPIC CHARACTERS AND SSR
Heri Kustanto1*), Nur Basuki1), Arifin Noor Sugiharto1) and Astanto Kasno2) 1)
Faculty of Agriculture University of Brawijaya Jl. Veteran Malang 65145 East Java Indonesia 2)
Indonesia Legume and Tuber Crops Reseach Institute
Jl. Raya Kendalpayak Km 8 P.O. Box. 66 Malang 65101 East Java Indonesia *) Corresponding author Phone: +62-341-551665 E-mail: [email protected]
Received: February 2, 2012/ Accepted: June 9, 2012
ABSTRACT
The main objective of this research was to study the diversity of maize inbred lines based on phenotypic characters and SSR markers. The research, which was conducted from February to June 2011, was divided into field and laboratory research for molecular analysis. The molecular analysis was conducted at the Biotecnology Laboratory, Faculty of Agriculture, Brawijaya University Malang. The field trial was done in Kandat, Junrejo, Batu. Materials of the research were 35 genotypes of maize. Steps for molecular analysis included: (1) DNA isolation, (2) DNA-quality test, (3) PCR SSR, and (4) Visualization of the amplification result. The field trial was done by planting genotypes using a RCBD with 2 replications. Result of the dendogram analysis showed that 35 genotypes of maize were divided into 2 main clusters, A and B, that having 35% similarity level. Result for the analysis of variance showed significant difference among genotypes of maize on the entire of the observed phenotype characters. Heritability (H) ranged from 61.8% to 98.1%. Coefficient of variance ranged from 0.71 to 7.20%. Analysis on the genotypic correlation ranged from 0.06 to 1.0. Numbers of rows per ear showed significant correlation, in which Jaccard’s similarity coefficient (rs) = +0.43.
Keywords: genetic diversity, phenotype, molecular, inbred line, maize.
INTRODUCTION
It is important to recognize the genetic diversity of inbred lines particularly in maize breeding program. Higher genetic diversity in basic
population is an important material in creating superior variety (Srdic et al., 2007; Sofi et al., 2011). Basic population that has higher genetic diversity provides greater opportunities to obtain more cross-combinations and better response to selection.
The genetic diversity of maize inbred lines was tested by observing the phenotypic characters. Along with the development of plant molecular biology, the genetic diversity was tested using molecular marker on DNA level. The important DNA-markers include RFLP (Restriction Fragment Length Polymorphism), RAPD (Randomly Amplified Polymorphic DNA), AFLP (Amplified Fragment Length Polymorphism), STS (Sequence Tagged Sites), SCARs (Sequence Characterized Amplified Regions), SSRs (Simple Sequence Repeats) or microsatellites, and SNPs (Single Nucleotide Polymorphism) (Ye-yun et al., 2005; Azrai, 2006). Those markers are used in accordance with the need of plant breeding (Azrai, 2006; Ye-yun et al., 2005). SSR marker is used to identify and verify a plant variety. Yamasaki et al. (2005) used SSR marker to study the genetic diversity in maize inbreds, landraces and teosintes, and as a result, they found significant genetic difference among those 3 populations. Yashitola et al. (2002) detected the purity of paddy hybrid using microsatellite marker and STS (Sequence Tagged Sites) and the result showed that microsatellite was better than STS in determining the germplasm purity in paddy hybrid.
accurate conclusion cannot be drawn without any phenotypic data supports. Therefore, some comprehensive research on molecular and phenotypic testing is required to use the SSR marker efficiently, particularly in exploiting the genetic diversities of germplasm and setting the heterotic groups.
Besides studying the genetic diversities in a population, the molecular marker can be used as Marker Assisted Selection (MAS), such as: to identify the parent lines accurately in order to improve specific character, to find the trace of appropriate alleles in each generation, and to identify the individual according to both favored quantitative and qualitative characters (Azrai, 2005; Lee et al., 2008). The molecular marker can be used for Marker Assisted Selection and to choose the targeted genes in selection correctly. The use of molecular marker will be effective for Marker Assisted Selection when strong relationship exists between the molecular data and the specific sixth-generation of selection (S6), such as: 01, 02, 03, 04, 05, 06, 08, 11, 13, 14, 15, 17, 18, 19, 20, 21, 23, 24, 26, 34, 35, 36, 38, 40, 42, G-44, G-46, G-49, G-51, G-BO,G-T00, G-T14, G-T15, G-T22, G-T37, which derived from selfing and sibmating of both commercial and local varieties in Indonesia. As comparison, 2 open pollinated varieties (OPV) wereapplied: Bisma and Lamuru. SSR Analysis
Samples of the research were 10 plants from each genotype. Samples were taken from young leaves, 25-35 days after planting. DNA isolation was applied using CTAB method (Doyle and Doyle, 1987; Kostava et al., 2006) which was modified using an active carbon (Krizman, 2006). submerged in the electrophoresis chamber. The sample used 2 µl DNA and 1 µl loading dye, which were put into wells. The electrophoresis was performed under 100 volt for about half an hour. The result of such electrophoresis was visualized over the ultraviolet light.
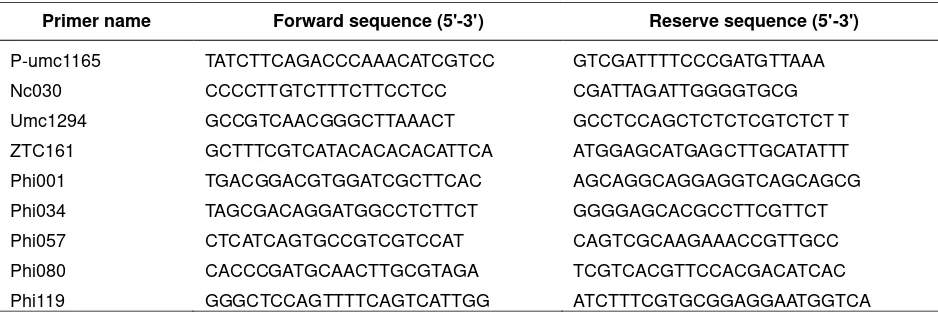
PCR reaction optimization program was performed before amplification. Optimization was performed to obtain PCR optimum condition for DNA amplification using primer microsatellite, which had been previously determined. Also, it was performed to choose primer, which had higher polymorphism. PCR reaction optimization program was: 1 initial denaturation cycle under 94 oC for 4 minutes, followed by 37 denaturation cycles under 94 oC for 50 seconds and annealing temperature of 55 oC for 1 minute. PCR cycle was completed by 1 final extension cycle under temperature of 72 oC for 1 minute. This optimization used 9 pairs (Table 1). Electrophoresis was applied to study the DNA amplification using PCR. One percent of agarose was dissolved in 40 ml buffer TBE 0.5x, then it was electrophoresized under 100 V for 30 hours. Then, the gel wassubmerged in EtBr (Ethidium Bromide) for 15 minutes. The visualization was performed over ultraviolet.
Field Trial
Table 1. Primer names used in study (Wu et al., 2006)
Primer name Forward sequence (5'-3') Reserve sequence (5'-3')
P-umc1165 TATCTTCAGACCCAAACATCGTCC GTCGATTTTCCCGATGTTAAA Nc030 CCCCTTGTCTTTCTTCCTCC CGATTAGATTGGGGTGCG Umc1294 GCCGTCAACGGGCTTAAACT GCCTCCAGCTCTCTCGTCTCT T ZTC161 GCTTTCGTCATACACACACATTCA ATGGAGCATGAGCTTGCATATTT Phi001 TGACGGACGTGGATCGCTTCAC AGCAGGCAGGAGGTCAGCAGCG Phi034 TAGCGACAGGATGGCCTCTTCT GGGGAGCACGCCTTCGTTCT Phi057 CTCATCAGTGCCGTCGTCCAT CAGTCGCAAGAAACCGTTGCC Phi080 CACCCGATGCAACTTGCGTAGA TCGTCACGTTCCACGACATCAC Phi119 GGGCTCCAGTTTTCAGTCATTGG ATCTTTCGTGCGGAGGAATGGTCA
33 inbred lines and 2 comparative varieties were grown in polybags. The medium was fine sands mixed with manures. Polybags were used to eliminate the plant loss and avoid any disease and pest attack during the initial growth since the planting was conducted during rainy season. The plantlets transferred to the field within 10 days after planting. Nine agronomic characters of the maize were observed, such as: the plant height (cm), leaf length (cm), days of pollen emergence (day), harvest time (day), kernel weight per plant (kg), diameter of the ear (cm), number of rows per
Data from photo-documentation was DNA band pattern as a result of PCR amplification using primers SSR. DNA band resulting from amplification wasinterpreted as qualitative data by observing the presence and absence of such DNA band, which wastransferred to binary data through scoring on one position of the equivalent band row. Scoring is taken according to the band, for instance: if there was a band, the score wasone (1) and if there was no band, the score was zero (0). This data was used to calculate genetic similarity coefficient and to construct dendogram.
Genetic relationship was determined by Jaccard’s similarity coefficient with the formula: Sj = A/(A+B+C), where Sj: Jaccard’s similarity coefficient, A: numbers of the DNA band (allele)
which belongs to both genotypes 1 and 2, B: numbers of specific band belonging to genotype 1, and C: number of specific band belonging to genotype 2 (Sneath and Sokal (1973) in Cordeiro et al., 2003). Relationship of the inbred lines correlations was determined by genetic similarity analysis. Those inbred lines were categorized according to the genetic similarity matrix through UPGMA (Unweighted Pair Group Method Using Arithmetic Average) using NTSYSpc (Numerical Taxonomic System) program version 2.02i.
Analysis of Variance Based on Phenotype Characters
(x1.x2)/√
Correlation Analysis between Molecular Data and Phenotype Data
Relationship between molecular and phenotype data wasanalyzed using Spearman’s rank correlation coefficient 1904 (Singh and Chaundhary, 1979; geographyfieldwork, 2011; udel. edu.2011) by the formula as follows: rs = 1-[(6di
2
)/n(n2-1)], where rs = Spearman’s Rank correlation coefficient value, d = difference between ranking on the first and the second data, and n = numbers of treatment.
RESULTS AND DISCUSSION
Genetic Variability Based on The Molecular Marker
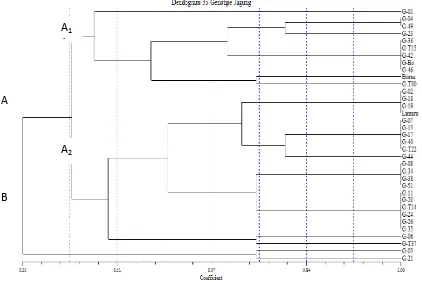
Three out of 9 primers used had higher polymorphism, such as: umc1294, ZCT161 and phi080. Senior et al. (1998) applied the microsatellite marker in maize and it showed higher polymorphism. Those three primers were used to estimate the genetic distance of 33 cluster A2 comprised 22 genotypes (Figure 1).
In cluster A and B, genetic similarity of 35% was obtained, in sub-clusters B1 and B2, the genetic similarity was about 42%. Sub-cluster A1 comprised 6 groups: Group I (G-01), II ( 04 and 49), III (23), IV (36, 15, G-42, G-B0, G-46), V (Bisma), and VI (G-T00). Sub-cluster A2 comprised 7 groups: VII(G-02, 18, 19, Lamuru), VIII (07, 13, 17, 40, T22), IX (44), X (08, 34, 38, G-51), XI (G-11, G-20, G-T14, G-24, G-26, G-35), XII (G-06), and XIII (-T37). Cluster B comprised 2 groups in which each genotype just had one genotype: Group XIV (G-03) and XV (G-21) (Figure 1).
Lamuru was an open pollinated variety and belonged to group (VII), along with 02, G-18 and G-19 that had genetic similarity level of 100%. It was estimated that 02, 18 and G-19 were inbred lines which were developed from Lamuru variety so that they have higher genetic similarity. Bisma and G-T00 were included in one sub-cluster B1, in which the genetic similarity was 75%. Both genotypes, which were suggested having close relationship due to G-T00, were developed from commercial variety in Indonesia, which possibly had identical genealogy with Bisma. Mohammadi et al. (2008) reported that the success in using molecular marker to observe the genotype variability and estimate the genetic distance was determined by numbers of primer, hereditary pattern, uniformity distribution in genome and specific information on each used primer. Dhliwayo et al. (2009) stated that categorization was based on molecular marker which can be used as utilization directory of germplasm in smaller group or as initial grouping of germplasm from uncharacterized accessions.
Genetic Variability Based on the Phenotype Characters.
Result of the variance analysis showed significant difference among genotypes of maize in the entire observed phenotype characters. Heritability (H) showed higher value in all observed phenotype characters. Variability coefficient ranged from 0.71 – 7.20% and showed that the experiment was accepted (Table 2).
Figure 1. Dendogram of 35 genotypes of maize based on SSR marker using UPGMA method and constructed based on Jaccard’s similarity coefficient
Table 2. Analysis of variance on phenotype characters of maize, Coefficient of Variance (CV) and Heritability (H)
Characters in maize Degree of freedom
Replication Genotype Pooled error (%) CV H
1 34 34
Plant height 274.6 813.6* 78.82 4.90 82.3
Leaf length 0.2 154.1* 13.17 4.00 84.3
Days of pollen emergence 0.3 33.8* 0.32 0.98 98.1 Days of harvest time 1.2 36.5* 0.51 0.71 97.2 Kernel weight plant-1 0.0001 0.0025* 0.00006 7.20 95.3 Diameter of ear 10.3 58.1* 6.04 6.40 81.2 Number of rows ear-1 0.2 3.4* 0.31 4.30 83.3 Kernel Water content in harvest time 5.6 10.0* 2.36 6.90 61.8 Grain yield 99094.9 9267548.6* 169242.62 6.30 96.4 Remarks: * Significant at P<0.05, respectively
B
A
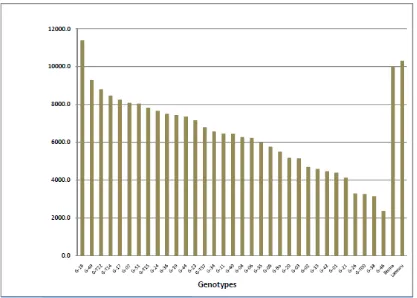
Figure 2. Grain yield in 35 genotypes of maize
Genotypic Correlation among the Observed Phenotypic Characters
Genotypic correlation analysis showed significant and strong relationship from one phenotype character to another phenotype character of the plant (Table 3).
The result of the research showedthat the grain yield had genotypic correlation with the leaf length, days of pollen emergence, harvest time, kernel weight plant-1, diameter of the ear, number of rows ear-1, kernel water content in harvest time, and the grain yield in harvest time. The highest genotypic correlation was in the kernel weight plant-1 and the grain yield. Number of rows ear-1 showed significant correlation with leaf length, days of pollen emergence, harvest time, kernel weight plant-1, diameter of the ear, and the grain yield. Salami et al. (2007) stated that significant correlation was apparent on
several phenotype characters of some tested genotypes of maize.
Correlation between Molecular Data and Phenotype Data
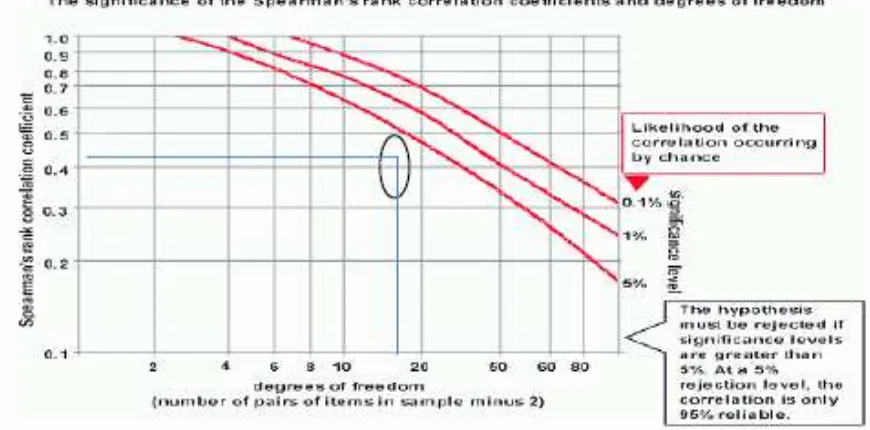
Figure 3. Significance graphic on Spearman’s rank correlation coefficient
Table 3. Genotypic correlation between the grain yield and other Characters
The Plant Characters 1 2 3 4 5 6 7 8 9
Plant height (1) 1 0.63* 0.17 0.12 0.35 0.4 0.3 0.06 0.36 Leaf length (2) 1 0.62* 0.63* 0.65* 0.41 0.63* 0.58* 0.63* Days pollen to shed (3) 1 0.80* 0.53* 0.37 0.72* 0.62* 0.5* Days of harvest time (4) 1 0.69* 0.55* 0.63* 0.46* 0.67* Kernel weight plant-1 (5) 1 0.49 0.77* 0.31 1.00*
Diameter of ear (6) 1 0.78* 0.12 0.77*
Number of rows ear-1 (7) 1 0.52* 0.75*
Kernel Water content (8) 1 0.27
Grain yield (9) 1
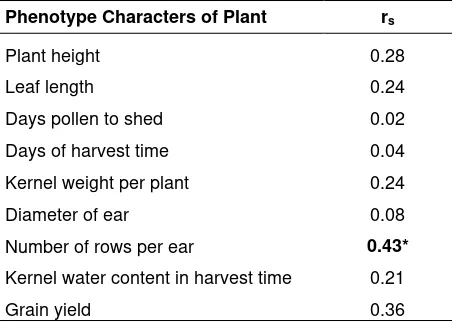
Other facts showed that genotype correlation among the plant characters described significant genetic correlation between number of rows ear-1 and other phenotype characters. Therefore, it was presumed that there was some relationship between primers used as molecular marker and other phenotype characters. The phenotype characters, particularly, had genetic correlation with number of rows ear-1, such as: leaf length, days pollen to shed, days of harvest time, kernel weight plant-1, diameter of ear, and grain yield.
http://dx.doi.org/10.17503/Agrivita-2012-34-2-p127-135 Table 4. Spearman’s rank correlation coefficient
value between the Phenotype Characters and Jaccard’s similarity coefficient
Phenotype Characters of Plant rs
Plant height 0.28
Leaf length 0.24
Days pollen to shed 0.02 Days of harvest time 0.04 Kernel weight per plant 0.24 Diameter of ear 0.08 Number of rows per ear 0.43*
Kernel water content in harvest time 0.21
Grain yield 0.36
CONCLUSIONS AND SUGGESTION
Based on result of the research, some conclusions were drawn as follows: (1) the genetic diversities were found based on the phenotype characters and the molecular marker, (2) the genetic correlation was foundamong the observed phenotypic characters, and (3) strong and significant correlation between Jaccard’s similarity coefficient and number of rows ear character was also found. Therefore, it was presumed that there was some relationship between primers used as molecular marker and other phenotypic characters, particularly the phenotype characters, which had genetic correlation with number of rows ear-1, such as: the leaf length, days of pollen emerging, harvest time, kernel weight plant-1, diameter of ear, and the grain yield.Therefore, number of rows ear-1 can be used as one of the selection criteria in breeding maize since it showed strong and significant correlation between phenotypic characters and molecular data as well as higher heritability value. For further review, it is suggested to learn more about relationship among 3 primers and the previous generation and after S6 as well as multiply number of primer used in learning the genotypic diversity in maize.
REFERENCES
Aguilar, C.G., I. Schuster, A.T. A. Juniroe, C.A. Scapim and E.S.N. Vieira. 2008.
Heterotic Groups in Tropical Maize Gerplasm by Test Cross and Simple sequence Repeat markers. Genet. Mol. Res. 7 (4): 1233-1244.
Azrai, M. 2005. A Review on Molecular Marker Utilization in Selection Process of Plant. J. AgroBiogen 1 (1):26-37
Barbosa-Neto JF, Sorrells ME, Cisar G (1996). Prediction of Heterosis in Wheat Using Coefficient of Rarentage and RFLP-based Estimates of Genetic Relationship. Genome, 39: 1142-1149. Cordeiro, G.M, Y.B. Pan, and R.J. Henry. 2003.
Sugarcane microsatellites for the assessment of genetic diversity in sugarcane germplasm. Plant Science 165: 181-189.
Doyle, J.J dan J.L. Doyle. 1987. A Rapid DNA Isolation procedure for small quantities of fresh leaf tissue. Phytochemical Bulletin. 19:11-15.
Ding, J., J. Ma, C. Zhang, H. Dong, Z. Xi, Z. Xia and J. wu. QTL mapping for test weight by using F2:3 population in maize. Indian Academy of Sci. 90: 75-79. Dhliwayo, T., K. Pixley, A. Menkir and M.
Warburton. 2009. Combining Ability, Genetic Distances, and heterosis among Elit CIMMYT and IITA Tropical Maize Inbred Lines. Crop Sci 49: 1201-1210. Fehr, W.R. 1994. Principles of Cultivar
Development. Iowa State University. Ames. 536p.
Geographyfieldwork. 2011. Spearman’s rank correlation coefficient. Bercelona field studies centre, SL. www. Geographyfieldwork.com
Halimi, E. S., N.R. Pransiswa and D.A. Purba. 2011. Development of Acid-Soil Tolerant Corn (Zea mays L.) with High-Quality Protein. J. Agrivita vol 33 (2):127-132 Kostavo. A, E. Todorovska, N. Christov, V.
Sevov and A.I. Atanassov. 2006. Molecular characterization of Bulgarian maize Germplasm collection via SSR markers. Biotechnol. & Biotechnol. Eq. Institute of Plant GeneticResources, Sadovo, Bulgaria.
Lee, E.A., J.A. Young, F. Azizi, S. Jay and A.W. Schaafsma. 2008. Phenotypic and Genotypic Characterization of purple Kernel Streak in White Food Corn. Crop Sci. 49: 1235-1241.
Mohammadi, S.A., B.M. Prasana, C. Sudan and N.N. Singh. SSR 2008. Heterogeneic pattens of maize parental lines and prediction of hybrid performance. Faculty of Agronomy, Univ. Of Tabriz. Iran
Pongsai, C., X. Tan, A. Silapapun, P. Suthipong and L. Wei. 2009. The use of SSR markers to identify heterotic pattern of F1 hybrids in two tropical maize population. Sci. Technol. 16: 175-184. Pabendon, M.B., M.J. Mejaya, J. Koswara and
H. Aswidinnoor. 2009. SSR-based genetic diversities among maize inbred lines and their relationship with F1 phenotypic data of MR4 and MR14 testcrosses. Ind. J. of Agri. 2: 41-48. Singh, R.K. dan B.D. Chaudhary. 1979.
Biometrical methods in quantitative
genetic Analysis. Kalyani Publishers.
New Delhi.
Sofi, P., A.G. Rather and S. Venkatesh. 2006. Triple Test Cross Analysis in Maize (Zea mays L.). Indian. J. Sci. 1(1-2): 191-193 Srdic, J., S. M. Drinic, Z. Pajic and M.
Pilipovic.2007. Characterisation of Maize Inbred Lines Based on Molecular Markers, Heterosis and Pedigree Data. Genetika. 39 (3): 355-363.
Salami, A.E., S.A.O. Adegoke and Q.A. Adegbite. 2007. Genetic Variability among Maize Cultivars Grown in Ekiti-State, Nigeria. Middle-East J. of Sci. Research 2 (1): 8-13
Trindade, A.P.R., R.J.B. Pinto, A.T.D.A. Junior, C.A. Mangolin, M.F.P.S. Machado and C.A. Scapim. 2010. Genetic diversity of breeding popcorn lines determined by SSR markers. Elec. J. Biothec. 13: 1-9. Wu, Mingsheng, Xihai Jia, L.Tian and Baochun
Ly. 2006. Rapid and reliable purity identification of F1 Hybrids of Maize (Zea Mays) using SSR Markers. Moleculer Plant Breeding 4(3): 381-384 Ye-yun. X., Z. Zhang, X. Yi-ping and Y.
Long-ping. 2005. Identification and Purity Test of Super Hybrid Rice with SSR Molekuler Markers. Rice Sci. 12(1): 7-12.
Yoshitola, J., T. Thirumirugan, R.M. Sundaram, M.K. Naseerullah, M.S. Rhamesa, N.P. Sharma, R.V. Sonti and STC. 2002. Assessment of purity of rice hybrids using microsatellite and STS marker. Crop Sci. 42: 1369-1373.
