INTRODUCTION
Bambara groundnut (Vigna subterranea L. Verdcourt) is one of underutilized crops that grows in South East Asia, like Indonesia, Malaysia and Thailand. This beans are more adaptive and drought tolerant in low fertility soil (Kuswanto, Waluyo, Pramantasari, & Canda, 2012). This plant is able to fix nitrogen in soil through a symbiosis with Rhizobium bacteria, like the other leguminous (Ntundu, Bach, Christiansen, & Andersen, 2004), so the nitrogen needed is always enough. This crop is a drought tolerant plant which plays its role in adapting to climate changes. It becomes a genetic resource to improve plant variety which has resistance to biotic and abiotic stress (Padulosi, Heywood, Hunter, & Jarvis, 2011).
Underutilized crop can increase food security by eliminating the risk of over dependency on the limited main crops. Besides that, it could
support plant diversification effort and increase sustainable agricultural development by reducing cultivation input such as reducing the application of nitrogen fertilizer so it can diminish agricultural sector contribution in increasing the greenhouse gas effect (Mayes et al., 2012). To enhance attainment of potential yield of the crop, it requires the production of Bambara groundnut in areas with similar environmental conditions (Pungulani, Kadyampakeni, Nsapat, & Kachapila, 2012).
Since the Bambara groundnut landraces are not homogenous and are only adapted to certain environments, there is a lack of uniformity in performance of these landraces if grown under varied environmental conditions. There is, therefore a need to come out with improved varieties, to promote and enhance cultivation of Bambara groundnut across the region and the country at large (Akpalu, Atubilla, & Oppong-Sekyere, 2013).
Positive Impact of Similarity on Twice Single Seed Descent of Purification
on Bambara Groundnut (
Vigna subterranea
L. Verdcourt)
Kuswanto1*) and Prakit Somta2)
1) Faculty of Agriculture, Universitas Brawijaya, Indonesia 2) Faculty of Agriculture, Kasetsart University, Thailand
ARTICLE INFO Keywords:
Bambara groundnut Plant breeding Purification Selection Single seed
Article History:
Received: November 2, 2017 Accepted: December 5, 2017
*) Corresponding author:
E-mail: [email protected]
ABSTRACT
The important issue to develop the local lines of Bambara groundnut is genetic diversity. There are some characters that showed diversity in one lines, such as seed color, seed shape or growth habit. The differences of its qualitative character show a different genetic trait (Kuswanto, Waluyo, Pramantasari, & Canda, 2012). Plant breeding on Bambara groundnut is exposed to some problems of local varieties. The main problem of Bambara groundnut genotype improvement is the low of purity. Purity is the most important part in developing self-pollinating crop in Indonesia. Bambara groundnut is a self-pollinating crop, so purity is important to be developed to create pure superior varieties. Purity will determine a uniformity of local varieties
The research was started in 2014 to purify the local line based on plant and seed characters. The previous research from Nuryati, Soegianto, & Kuswanto (2014) had 50 genotypes based on the selection of seed characters. Purification process had been done based on pod and seed characteristics. Pod and seed characteristic from every local line had high variability. According to Oyiga & Uguru (2011), the primary components of Bambara groundnut yield are the number of pods per plant and seed weight. Seed weight shows correlation with the number of flower per plant and the number of pod per plant (Jonah, 2011; Jonah, Aliyu, Jibung, & Abimiku, 2013). Study of correlation in character which has a high yield is more effective for selection of superior genotypes. Shape, color and texture of pods from one location show considerable variation. The same thing happens in the shape, color and texture of seed. This variability on pod and seed characteristics can be used as material for breeding program in developing new varieties.
The research on genetic purification of Bambara groundnut had finished in twice single seed descent. There were 20 selected genotypes from previous research Nuryati, Soegianto, & Kuswanto (2014). The plant selection was based on single seed descent so it will improve purity of the line gradually. Breeder would take one seed of plant to be planted on next planting. One seed is assumed as one genotype which heritage the same genetic characters. The application of single seed descent will improve purity. Purification will become
perfect if a single seed descent is applied more than once.
The research served a new information about possibility on single seed descent application to purify local varieties. So, the objective of this research was to evaluate the improving purity of local line of Bambara groundnut and to find out the uniformity gain level within lines after single seed descent applied twice.
MATERIALS AND METHODS
The research consisted of 3 observations: evaluation of qualitative character on collected lines, application first single seed descent and application of second single seed descent, respectively. This research was conducted in Agriculture Research Station, Universitas Brawijaya, Indonesia, from 2014 to 2016. The materials used in this research were 20 selected genotypes of Bambara groundnut. They were the selected line by single seed descent from previous research. Selection was conducted among collected 50 lines that had distinct characters and a sufficient number of seeds as material for evaluating genetic relationship and variability. The material of the first research was based on the same characters between parent and progenies that were selected by single seed descent. Selected seeds were planted as material of the second research. From all of researches, they were sowed and observed the qualitative and quantitative characters.
The observation on quantitative and qualitative characters of every individual plant was done following the International Plant Genetic Resources Institute descriptors for Bambara groundnut (IPGRI, 2000). Qualitative characters are the growth habit, terminal leaflet shape, color of terminal leaflet, pigmentation on hypocotyls, pigmentation on flower, stem hairiness, pod shape, pod color, pod texture, seed shape, and seed color. While quantitative characters are days of the first flowering, number of flowers per plant, age of harvest, number of pods per plant and fruit set.
RESULTS AND DISCUSSION Evaluation of 50 Selected Local Lines
The evaluation of genetic variability was from selected 50 local lines on 24 quantitative characters. The variation of each line had narrow variability for plant height, canopy width, number of leaves, petiole length, terminal leaflet length, terminal leaflet width, internode length, flowering age, banner length, peduncle length, banner length, days of fresh harvest, harvesting seed, pod length, pod width, number of stems, number of nodes per stem, seed length and seed width, 100 seeds weight and shelling percentage. Three other characters were included the number of flowers per plant, weight of fresh pod per plant and number of pod per plant which showed that there were lines which had narrow variability and there were lines that had broad variability.
Local line of GSG 3.5, GSG 2.4 and WSS 2.2.2 line had broad variability in number of flowers per plant character. There were 32 purified local lines that had broad genetic variability and 18 purified local lines that had narrow genetic variability in fresh pod weight per plant character. While for number of pods per plant, there were 37 purified local lines which had narrow genetic variability and 13 lines with broad genetic variability (Nuryati, Soegianto, & Kuswanto, 2014). Table 1 describes the total of 50 selected local lines from collected lines.
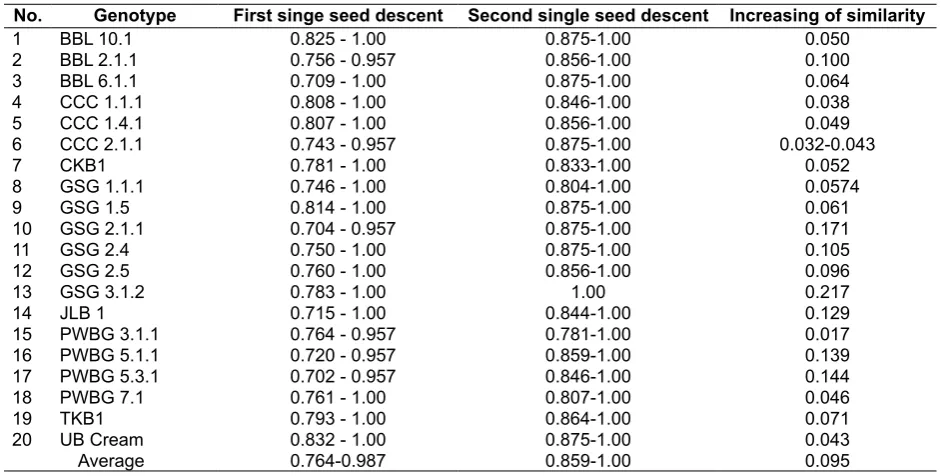
Increasing Genetic Similarity within Lines These local lines were planted as material in this research and were observed the qualitative characters. There were 20 local lines selected from previous research were analyzed with cluster analysis. Cluster analysis applied to analyze genetic relationship among plant individually. Cluster analysis was based on qualitative characters. Qualitative characters controlled by monogenic (1-2 genes) and non-response to environmental factors. So in the case, variability of qualitative characters indicated a variability of genetic factors. On the first single seed descent, it got similarity coefficient of 0.704-0.832. On the second single seed descent, it got similarity coefficient of 0.804-1.00. The increasing of similarity coefficient from 0.10 until 0.168 will improve purification of local lines 15.76-20.19 %, and it depends on genotype.
On the first single descent, only 5 genotypes of Bambara groundnut (CCC 1.4.1, SS 2.2.2, GSG 1.5, BBL 10.1, and CCC 1.1.1) had similarity coefficient more than 0.80. This value explained a single seed descent must be continued to second selection. The higher of similarity coefficient, the more uniform of plants character of a genotype will be so that it is pure genetically. According to Pandin (2010) the degree of similarity which used genetic matrix can be divided into four categories: very close resemblance (very good) r > 0.9; good 0.8 < r < 0.9; less good 0.7 < r < 0.8; bad r < 0.7. The level of genetic similarity of a population can be described by a genetic distance from individual members of the population. The closer its genetic distance among individuals in a population, the more uniform the population will be. The farther its individual genetic distance in a population, the more population has become increasingly diverse.
On the second single descent, almost all of genotypes had similarity coefficient of more than 0.80. There was one genotype, GSG 312, had a perfect similarity coefficient, because it had value 1 (100 %). It could be said that line GSG 312 had full purified. Uniformity within population was determined with genetic distance among plant individually. The closer genetic distance among plants, the more uniform their genetic characters will be. Similarity coefficient is 1 (100 %) means the genetic distance within line GSG 312 is 0 %, so all characters of GSG 312 were same or uniform. Uniformity among individual plant within same line is assumed to be caused by a relative relationship (Austi, Damanhuri, & Kuswanto, 2014) as impact in line of parent (Putri, Sutjahjo, & Jambormias, 2014).
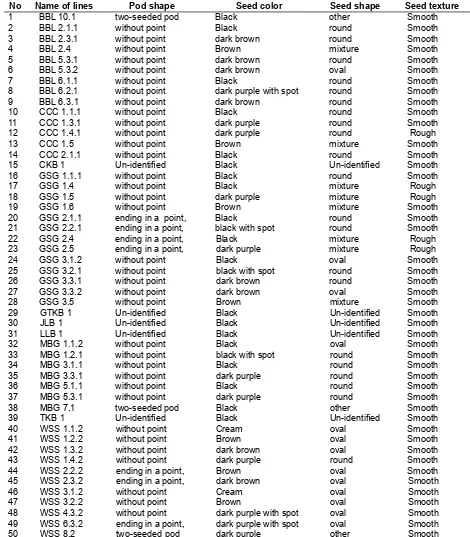
No Name of lines Pod shape Seed color Seed shape Seed texture
1 BBL 10.1 two-seeded pod Black other Smooth 2 BBL 2.1.1 without point Black round Smooth 3 BBL 2.3.1 without point dark brown round Smooth 4 BBL 2.4 without point Brown mixture Smooth
5 BBL 5.3.1 without point dark brown round Smooth
6 BBL 5.3.2 without point dark brown oval Smooth
7 BBL 6.1.1 without point Black round Smooth 8 BBL 6.2.1 without point dark purple with spot round Smooth 9 BBL 6.3.1 without point dark brown round Smooth 10 CCC 1.1.1 without point Black round Smooth 11 CCC 1.3.1 without point dark purple round Smooth 12 CCC 1.4.1 without point dark purple round Rough
13 CCC 1.5 without point Brown mixture Smooth
14 CCC 2.1.1 without point Black round Smooth
15 CKB 1 Un-identified Black Un-identified Smooth 16 GSG 1.1.1 without point Black round Smooth
17 GSG 1.4 without point Black mixture Rough
18 GSG 1.5 without point dark purple mixture Rough
19 GSG 1.6 without point Brown mixture Smooth 20 GSG 2.1.1 ending in a point, Black round Smooth 21 GSG 2.2.1 ending in a point, black with spot round Smooth 22 GSG 2.4 ending in a point, Black mixture Rough
23 GSG 2.5 ending in a point, dark purple mixture Rough
24 GSG 3.1.2 without point Black oval Smooth
25 GSG 3.2.1 without point black with spot round Smooth 26 GSG 3.3.1 without point dark brown round Smooth
27 GSG 3.3.2 without point dark brown oval Smooth
28 GSG 3.5 without point Brown mixture Smooth
29 GTKB 1 Un-identified Black Un-identified Smooth 30 JLB 1 Un-identified Black Un-identified Smooth 31 LLB 1 Un-identified Black Un-identified Smooth 32 MBG 1.1.2 without point Black oval Smooth 33 MBG 1.2.1 without point black with spot round Smooth 34 MBG 3.1.1 without point Black round Smooth
35 MBG 3.3.1 without point dark purple round Smooth
36 MBG 5.1.1 without point Black round Smooth
37 MBG 5.3.1 without point dark purple round Smooth
38 MBG 7.1 two-seeded pod Black other Smooth
39 TKB 1 Un-identified Black Un-identified Smooth 40 WSS 1.1.2 without point Cream oval Smooth 41 WSS 1.2.2 without point Brown oval Smooth 42 WSS 1.3.2 without point dark brown oval Smooth 43 WSS 1.4.2 without point dark purple round Smooth 44 WSS 2.2.2 ending in a point, Brown oval Smooth
45 WSS 2.3.2 ending in a point, dark brown oval Smooth 46 WSS 3.1.2 without point Cream oval Smooth
47 WSS 3.2.2 without point Brown oval Smooth 48 WSS 4.3.2 without point dark purple with spot oval Smooth 49 WSS 6.3.2 ending in a point, dark purple with spot oval Smooth
50 WSS 8.2 two-seeded pod dark purple other Smooth
The main qualitative character support variability was a difference in seed color character. Seed color often disturbs uniformity of lines. On the first observation, the genotype of Bambara groundnut showed that there were differences between progenies and parents. For example, CCC 1.1.1 lines had black color of seed. The progenies of this line had seed with cream color (1.31 %), brown (4.34 %), black (59.57 %), black with brown spots (10.56 %), dark brown (11.86 %) and dark purple (12.36 %). It happened because there was a segregation of heterozygous genotype. Seed color of quantitative character was not influenced by the environment but controlled by a single gene (Nuryati, Soegianto, & Kuswanto, 2014). Second observation, in genotype CCC 1.1.1 plant number 3 with early planted seed color was black, and also the progenies had seed with brown reddish color 11.11 %, black 44.44 %, brown 5.56 % and dark purple 38.89 %. It was the reason why single seed descent was chosen in this research.
The difference in seed color on Bambara groundnut also found in other research, such as Zembabwe Red, the seeds were quite uniform in color, with a low segregation into different red color. After three evaluation seasons, it showed less segregation in seed color. There were also
black seed color in Garborone Black (Africa), it segregated into other color, especially brown and the most common seed color was black and brown on a single pod (Heller, Begemann, & Mushonga, 1997). The same thing was described by Ouedraogo et al. (2008), there was a segregation seed color in progenies, farmers in Burkina Faso who used seeds from prior plantation period, stated that the color of seed change year by year.
Variation of Quantitative Characters
The evaluation of variability in phenotypic was done by coefficients of variation in each quantitative character (Table 3 and Table 4). Flowering age and (sometimes) harvesting age are controlled by monogenic, so both of them have minimum response to environmental factors. The late flowering has a detrimental effect on seed yield of in the savannah zone. In areas with marginal rains, earlier flowering confers an advantage of forming more pods and seeds and consequently higher yields (Abu & Saaka, 2011).
Table 3 shows that coefficient of variation in days of first flowering and harvesting age has a low value, less than 10 %. The low to medium value of variation coefficient shows a uniformity in those plants (Rozika, Murti, & Purwanti, 2013). Table 2. Similarity Coefficient on first and second of singe seed descent
No. Genotype First singe seed descent Second single seed descent Increasing of similarity
1 BBL 10.1 0.825 - 1.00 0.875-1.00 0.050 2 BBL 2.1.1 0.756 - 0.957 0.856-1.00 0.100 3 BBL 6.1.1 0.709 - 1.00 0.875-1.00 0.064 4 CCC 1.1.1 0.808 - 1.00 0.846-1.00 0.038
5 CCC 1.4.1 0.807 - 1.00 0.856-1.00 0.049 6 CCC 2.1.1 0.743 - 0.957 0.875-1.00 0.032-0.043
7 CKB1 0.781 - 1.00 0.833-1.00 0.052 8 GSG 1.1.1 0.746 - 1.00 0.804-1.00 0.0574
9 GSG 1.5 0.814 - 1.00 0.875-1.00 0.061
10 GSG 2.1.1 0.704 - 0.957 0.875-1.00 0.171 11 GSG 2.4 0.750 - 1.00 0.875-1.00 0.105
12 GSG 2.5 0.760 - 1.00 0.856-1.00 0.096
13 GSG 3.1.2 0.783 - 1.00 1.00 0.217 14 JLB 1 0.715 - 1.00 0.844-1.00 0.129
15 PWBG 3.1.1 0.764 - 0.957 0.781-1.00 0.017
16 PWBG 5.1.1 0.720 - 0.957 0.859-1.00 0.139
17 PWBG 5.3.1 0.702 - 0.957 0.846-1.00 0.144
18 PWBG 7.1 0.761 - 1.00 0.807-1.00 0.046
19 TKB1 0.793 - 1.00 0.864-1.00 0.071
Nuryati, Soegianto, & Kuswanto (2014) stated that the average of flowering age of Bambara groundnut was 47 days and average of harvesting age was 128 days. According to Shaumi, Chandria, Waluyo, & Karuniawan (2012) if the variability is low, so selection have to be stricter in order to achieve a desired genotype uniformity on that character because the individual of its population is relatively uniform. But, it is not recommended that the selection of local line of Bambara groundnut to be based on quantitative characters. The selection strategy should be able to single out genotype which has excellent genes and is still expressed in every condition (Mustikarini, Ardiarini, Basuki, & Kuswanto, 2017).
The other characters had high response to environment and controlled by polygenic. The quantitative character from the observation had high coefficient of variation. Quantitative character was controlled by polygenic and each gene contributes little portion to phenotype. The quantitative characters relatively had a larger environmental component than the genetic component. The high value of variation coefficient showed a large
variety trait of the population. The high variability showed a diversity in plant character, so it still needed a selection of superior character to achieve uniform population (Shaumi, Chandria, Waluyo, & Karuniawan, 2012).
The difference of variation coefficient value gave a different information with analysis in qualitative character. On qualitative character, which cluster analyzed applied, stated that among individual within line was more uniform than quantitative characters. In other hand, the qualitative character analysis was better to evaluate uniformity or purity of Bambara groundnut, both of vegetative and reproductive characters.
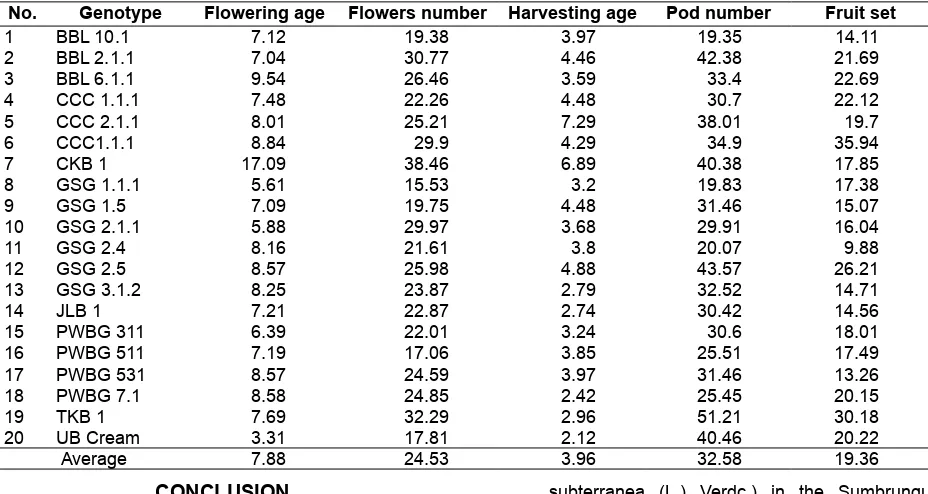
The application of first single seed descent and second one had the same pattern of coefficient of variation. Although flowering age and harvesting age were the characters with low value, but other characters had a high value. The high of variation coefficient was supported by environment effect. It can be concluded that purification of Bambara groundnut was not suitable when evaluated from quantitative characters.
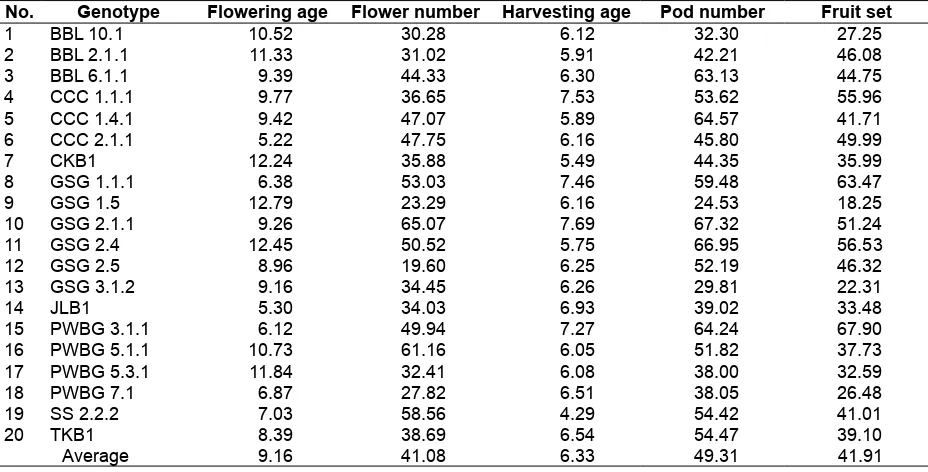
Table 3. Coefficient variation on first singe seed descent
No. Genotype Flowering age Flower number Harvesting age Pod number Fruit set
1 BBL 10.1 10.52 30.28 6.12 32.30 27.25 2 BBL 2.1.1 11.33 31.02 5.91 42.21 46.08 3 BBL 6.1.1 9.39 44.33 6.30 63.13 44.75 4 CCC 1.1.1 9.77 36.65 7.53 53.62 55.96
5 CCC 1.4.1 9.42 47.07 5.89 64.57 41.71 6 CCC 2.1.1 5.22 47.75 6.16 45.80 49.99
7 CKB1 12.24 35.88 5.49 44.35 35.99 8 GSG 1.1.1 6.38 53.03 7.46 59.48 63.47
9 GSG 1.5 12.79 23.29 6.16 24.53 18.25
10 GSG 2.1.1 9.26 65.07 7.69 67.32 51.24 11 GSG 2.4 12.45 50.52 5.75 66.95 56.53
12 GSG 2.5 8.96 19.60 6.25 52.19 46.32
13 GSG 3.1.2 9.16 34.45 6.26 29.81 22.31 14 JLB1 5.30 34.03 6.93 39.02 33.48
15 PWBG 3.1.1 6.12 49.94 7.27 64.24 67.90
16 PWBG 5.1.1 10.73 61.16 6.05 51.82 37.73
17 PWBG 5.3.1 11.84 32.41 6.08 38.00 32.59
18 PWBG 7.1 6.87 27.82 6.51 38.05 26.48
19 SS 2.2.2 7.03 58.56 4.29 54.42 41.01 20 TKB1 8.39 38.69 6.54 54.47 39.10 Average 9.16 41.08 6.33 49.31 41.91
CONCLUSION
Similarity of coefficient from the first single seed descent was less than 0.80, so it must be continued with the second one. Two circles of single seed descent selection were capable to purify Bambara groundnut of local lines until more than 0.80. Simple similarity coefficient of qualitative character described a genetic distance among plant individual within line population. The quantitative characters had high environment effect on phonotype so it could not be used to evaluate the purity of Bambara groundnut.
ACKNOWLEDGEMENT
Thank you very much for Nuryati, Ainin Arif, and Aldita Adin Nugraha. This research was supported by Underutilized Crops Research Center, Universitas Brawijaya.
REFERENCES
Abu, H. B., & Saaka, S. (2011). Characterization of bambara groundnut landraces and their evaluation by farmers in the Upper West Region of Ghana. Journal of Development in Sustainable
Agriculture, 6(1), 64–74. http://doi.org/10.11178/
jdsa.6.64
Akpalu, M. M., Atubilla, I. A., & Oppong-Sekyere, D.
subterranea (L.) Verdc.) in the Sumbrungu community of Bolgatanga, Upper East Region, Ghana. International Journal of Plant, Animal
and Environmental Sciences, 3(3), 68-75.
Retrieved from http://ijpaes.com/admin/php/uplo
ads/354_pdf.pdf
Austi, I. R., Damanhuri, & Kuswanto. (2014). Keragaman dan kekerabatan pada proses penggaluran kacang bogor (Vigna subterranea L.Verdcourt) jenis lokal [Diversity and genetic relationship in
line purification process on local type of bambara
groundnut (Vigna subterranea L.Verdcourt)].
Jurnal Produksi Tanaman, 2(1), 73-79. Retrieved
from http://protan.studentjournal.ub.ac.id/index. php/protan/article/view/81
Heller, J., Begemann, F., & Mushonga, J. (Eds.). (1997). Bambara groundnut (Vigna subterranea (L.)
Verdc.). Promoting the conservation and
use of underutilized and neglected crops. 9. Paper presented at Proceedings of the workshop on Conservation and Improvement of Bambara Groundnut (Vigna subterranea (L.) Verdc.), Harare, Zimbabwe, 14–16
November 1995. Gatersleben, DE: Institute
of Plant Genetics and Crop Plant Research; Harare, ZW: Department of Research & Specialist Services; Rome, IT: International Plant Genetic Resources Institute. Retrieved from https://www.bioversityinternational.org/
No. Genotype Flowering age Flowers number Harvesting age Pod number Fruit set
1 BBL 10.1 7.12 19.38 3.97 19.35 14.11 2 BBL 2.1.1 7.04 30.77 4.46 42.38 21.69 3 BBL 6.1.1 9.54 26.46 3.59 33.4 22.69 4 CCC 1.1.1 7.48 22.26 4.48 30.7 22.12
5 CCC 2.1.1 8.01 25.21 7.29 38.01 19.7 6 CCC1.1.1 8.84 29.9 4.29 34.9 35.94
7 CKB 1 17.09 38.46 6.89 40.38 17.85 8 GSG 1.1.1 5.61 15.53 3.2 19.83 17.38
9 GSG 1.5 7.09 19.75 4.48 31.46 15.07
10 GSG 2.1.1 5.88 29.97 3.68 29.91 16.04 11 GSG 2.4 8.16 21.61 3.8 20.07 9.88
12 GSG 2.5 8.57 25.98 4.88 43.57 26.21
13 GSG 3.1.2 8.25 23.87 2.79 32.52 14.71 14 JLB 1 7.21 22.87 2.74 30.42 14.56
15 PWBG 311 6.39 22.01 3.24 30.6 18.01
16 PWBG 511 7.19 17.06 3.85 25.51 17.49
17 PWBG 531 8.57 24.59 3.97 31.46 13.26
18 PWBG 7.1 8.58 24.85 2.42 25.45 20.15
19 TKB 1 7.69 32.29 2.96 51.21 30.18 20 UB Cream 3.31 17.81 2.12 40.46 20.22 Average 7.88 24.53 3.96 32.58 19.36
IPGRI. (2000). Descriptors for bambara groundnut
(Vigna subterranea). Rome, IT: International
Plant Genetic Resources Institute; Ibadan, NG: International Institute of Tropical Agriculture; Germany: The International Bambara Groundnut Network. Retrieved from https://www.
bioversityinternational.org/uploads/tx_news/ Descriptors_for_Bambara_groundnut__Vigna_ subterranea__324.pdf
Jonah, P. M. (2011). Phenotypic and genotypic correlation in bambara groundnut (Vigna subterranea (L.) Verdc) in Mubi, Adamawa State, Nigeria. World
Journal of Agricultural Sciences, 7(3), 298–303.
Retrieved from https://www.idosi.org/wjas/wjas7 (3)/7.pdf
Jonah, P. M., Aliyu, B., Jibung, G. G., & Abimiku, O. E. (2013). Phenotypic and genotypic variance and heritability estimates in bambara groundnut (Vigna subterranea [L.] Verdc) in Mubi, Adamawa State, Nigeria. International Journal of IT, Engineering and Applied Sciences
Research, 2(2), 66-71. Retrieved from http://
citeseerx.ist.psu.edu/viewdoc/download?
doi=10.1.1.404.808&rep =rep1&type=pdf Kuswanto, Waluyo, B., Pramantasari, R. A., & Canda,
S. (2012). Koleksi dan evaluasi galur-galur lokal kacang bogor (Vigna subterranea)
[Collection and evaluation of local strains of bambara groundnut (Vigna subterranea)]. Paper presented at Proceedings of the National Seminar of Perhimpunan Ilmu Pemuliaan Indonesia (PERIPI): Peran Sumber Daya Genetik dan Pemuliaan dalam Mewujudkan Kemandirian Industri Perbenihan Nasional
(pp. 144-151). Bogor, ID: Perhimpunan Ilmu
Pemuliaan Indonesia (PERIPI). Retrieved from http://kuswanto.lecture.ub.ac.id/files/2012/11/ Kus-Peripi-2012.pdf
Mayes, S., Massawe, F. J., Alderson, P. G., Roberts, J. A., Azam-Ali, S. N., & Hermann, M. (2012). The potential for underutilized crops to improve security of food production. Journal of
Experimental Botany, 63(3), 1075–1079. https://
doi.org/10.1093/jxb/err396
Mustikarini, E. D., Ardiarini, N. R., Basuki, N., & Kuswanto.
(2017). Selection Strategy of Drought Tolerance
of Red Rice Mutant Lines. AGRIVITA Journal
of Agricultural Science, 39(1), 91-99. http://doi.
org/10.17503/agrivita.v39i1.648
Ntundu, W. H., Bach, I. C., Christiansen, J. L., & Andersen, S. B. (2004). Analysis of genetic diversity in bambara groundnut [Vigna subterranea (L.)
Verdc] landraces using amplified fragment length
polymorphism (AFLP) markers. African Journal
of Biotechnology, 3(4), 220–225. Retrieved from
http://www.ajol.info/index.php/ajb/article/view /14947
Nuryati, Soegianto, A., & Kuswanto. (2014). Genetic relationship and variability among Indonesian
purified local lines of bambara groundnut (Vigna
subterranea (L.) Verdc.) based on morphological characters. African Journal of Science and
Research, 3(5), 18-24. Retrieved from http://ajsr.
rstpublishers.com/pdf_files/all/ajsr_a_1876_5a jsroct%20correction1.pdf
Ouedraogo, M., Ouedraogo, J. T., Tignere, J. B., Balma, D., Dabire, C. B., & Konate, G. (2008). Characterization and evaluation of accessions of Bambara groundnut (Vigna subterranea (L.) Verdcourt) from Burkina Faso. Sciences &
Nature, 5(2), 191–197. http://doi.org/10.4314/sci
nat.v5i2.42164
Oyiga, B. C., & Uguru, M. I. (2011). Interrelationships among pod and seed yield traits in bambara groundnut (Vigna subterranea L. Verdc) in the derived savanna agro-ecology of South–Eastern Nigeria under two planting dates. International
Journal of Plant Breeding, 5(2), 106-111.
Retrieved from https://www.zef.de/uploads/tx_
zefportal/Publications/4f38_IJPB_5(2)106-111o.
Padulosi, S., Heywood, V., Hunter, D., & Jarvis, A. (2011). 26. Underutilized species and climate change: Current status and outlook. In S. S. Yadav, R. J.
Redden, J. L. Hatfield, H. Lotze-Campen & A. E.
Hall (Eds.), Crop adaptation to climate change (pp. 507-521). Oxford, UK: Wiley-Blackwell. http://doi.org/10.1002/9780470960929.ch35
Pandin, D. S. (2010). Keragaman genetik kelapa dalam bali (DBI) dan dalam sawarna (DSA) berdasarkan
penanda Random Amplified Polymorphic DNA
(RAPD) [Genetic diversity of bali tall (DBI) and sawarna tall (DSA) coconuts based on Random
Amplified Polymorphic DNA (RAPD)]. Jurnal
Penelitian Tanaman Industri, 16(2), 83-89.
Retrieved from http://ejurnal.litbang.pertanian.
Pungulani, L., Kadyampakeni, D., Nsapat, L., & Kachapila, M. (2012). Selection of high yielding and farmers’ preferred genotypes of bambara nut (Vigna subterranea (L.) Verdc) in Malawi. American
Journal of Plant Sciences, 3(12), 1802–1808.
http://doi.org/10.4236/ajps.2012.312A221 Putri, I. D., Sutjahjo, S. H., & Jambormias, E. (2014).
Evaluasi karakter agronomi dan analisis kekerabatan 10 genotipe lokal kacang hijau (Vigna radiata L. Wilczek) [Evaluation of agronomy’s character and cluster analysis of 10 genotype indigenous mungbean (Vigna radiata L. Wilczek)]. Buletin Agrohorti, 2(1), 11-21. Retrieved from http://journal.ipb.ac.id/index.php/
bulagron/article/viewFile/8187/pdf
Rozika, Murti, R. H., & Purwanti, S. (2013). Eksplorasi dan karakterisasi sawo (Manilkara zapota (L.) van Royen) di Daerah Istimewa Yogyakarta
[Exploration and characterization of sapodilla
(Manilkara zapota (L.) van Royen) In Daerah Istimewa Yogyakarta]. Vegetalika, 2(4), 101-114. Retrieved from https://jurnal.ugm.ac.id/jbp/ article/view/4009
Shaumi, U., Chandria, W., Waluyo, B., & Karuniawan, A. (2012). Potensi genetik ubijalar unggulan hasil pemuliaan tanaman berdasarkan karakter morfo-agronomi [Genetic potential of sweet potato of plant breeding based on morpho-agronomical traits]. In A. W. Hermanto, N. Nugrahaeni, A. A. Rahmianna, Suharsono, F. Rozi, E.
Ginting, A. Taufiq, A. Harsono, Y. Prayogo,
E. Yusnawan (Eds.). Inovasi Teknologi dan Kajian Ekonomi Komoditas Aneka Kacang dan Umbi Mendukung Empat Sukses Kementerian
Pertanian. Paper presented at Proceedings
of the National Seminar of Various Beans and
Tubers Research Result, Malang, 15 November 2011 (pp. 721-730). Bogor, ID: Pusat Penelitian
dan Pengembangan Tanaman Pangan. Retrieved from https://www.researchgate.net/