*Corresponding author: E-mail: [email protected]
Available online at http://medpet.journal.ipb.ac.id/
Production and Energy Partition of Lactating Dairy Goats Fed Rations Containing
Date Fruit Waste
E. Yuniartia, D. Evvyernieb*, & D.A. Astutib
aStudy Program of Nutrition and Feed Science, Faculty of Animal Science, Graduate School,
Bogor Agricultural University
bDepartment of Nutrition and Feed Technology, Faculty of Animal Science, Bogor Agricultural University
Jalan Agatis, Kampus IPB Darmaga Bogor 16680, Indonesia
(Received 18-05-2015; Reviewed 15-06-2015; Accepted 09-10-2015)
ABSTRACT
Dates fruit waste (DFW) is a by-product of dates juice industry that contains high energy. So, it is suitable for an energy source in dairy goat ration. This study was conducted to observe the effect of DFW utilization in the ration on energy partition and productivity of lactating dairy goats. The experimental design was randomized block design using 9 primiparous lactating dairy goats. There were three types of ration as treatments used in this study, i.e. R0= 35% forage + 65% concentrate, R1= 35% forage + 55% concentrate + 10% DFW, and R2= 35% forage + 45% concentrate + 20% DFW. Data were analyzed using ANOVA and polynomial orthogonal test. The evaluated variables were dry mat-ter intake (DMI), energy partition including energy intake, digestible and metabolizable energy, fecal and urine energy, energy in methane gas, and energy in milk, milk production and quality. The results showed that the linear decreased of DMI, energy intake, digestible energy, metabolizable energy, and urine energy with the increased of DFW level in the rations. The use of 10% DFW (R1) showed the lowest energy loss through feces and methane gas of all treatments about 1089.57 kcal/head/d and 2.36 kcal/head/d, respectively. The use of DFW did not affect energy retention in milk. The utilization of DFW in ration did not significantly prevent the decline of milk production and milk quality. It can be concluded that DFW can be used as an alternative feed for the lactating dairy goat up to 10% in the ration.
Key words: dairy goat, date fruit waste, energy, milk production, milk quality
ABSTRAK
Ampas kurma merupakan limbah industri sari kurma yang memiliki kandungan energi tinggi, sehingga berpotensi untuk dimanfaatkan sebagai sumber energi dalam pakan kambing perah. Penelitian ini bertujuan untuk mengamati pengaruh pemanfaatan ampas kurma di dalam ransum pada partisi energi dan produktivitas kambing perah laktasi. Rancangan percobaan yang digunakan adalah rancangan acak kelompok (RAK) dengan 9 ekor kambing perah laktasi yang telah sekali beranak. Ransum perlakuan yang digunakan terdiri atas R0= 35% hijauan + 65% konsentrat, R1= 35% hijauan + 55% konsentrat + 10% ampas kurma, and R2= 35% hijauan + 45% konsentrat + 20% ampas kurma. Data yang diperoleh dianalisis menggunakan ANOVA dan uji polinomial ortogonal. Peubah yang diukur adalah konsumsi bahan kering, partisi energi yang meliputi konsumsi energi, energi tercerna dan termetabolis, energi feses dan urin, energi dalam gas metan, dan energi dalam susu, serta produksi dan kualitas susu. Hasil penelitian menunjukkan bahwa penurunan secara linear pada konsumsi BK dan energi, energi tercerna, energi termetabolis, dan energi urin seiring dengan meningkatnya level penggunaan ampas kurma di dalam ransum. Pemanfaatan ampas kurma pada level 10% (R1) menun-jukkan kehilangan energi melalui feses dan gas metan terkecil dibandingkan perlakuan lainnya yaitu 1089,57 kkal/ekor/hari dan 2,36 kkal/ekor/hari. Pemanfaatan ampas kurma tidak menunjukkan adanya perbedaan yang signifikan pada kandungan energi di dalam susu. Secara statistik, ampas kurma juga tidak memperlambat penurunan produksi dan kualitas susu. Dapat disimpulkan bahwa ampas kurma dapat menjadi pakan alternatif bagi kambing perah laktasi dengan penggunaan hingga 10% di dalam ransum.
28 April 2016
INTRODUCTION
Goats have a major role to play in developing countries due to their adaptability under harsh and marginal rural conditions, predominantly in the tropical and subtropical zones of the world (Rinaldi et al., 2007). Sutama (2008) stated that dairy goat milk production can reach up to 1.2 L/head/d and Ramadhan et al. (2013) stated that they can reach up to 1.5 L/d. Dairy goat is an alternative of dairy livestock to improve milk supply in Indonesia (Novita et al., 2006; Sukarini, 2006). Ettawah
Crossbred (PE) is a type of dairy goats which have been widely spread in Indonesia. They play major roles in meat and milk production (dual purpose) (Hasan et al.,
2014; Souhoka et al., 2009) and they are bred by cross-ings the Kacang and Ettawah (Jamnapari) goats (Sodiq, 2012).
Cellulosic agro industrial byproducts are widely used as the main feed in intensive ruminant rearing (Toharmat et al., 2007).One of the byproduct is date fruit waste (DFW). Up to 56% of date fruit weights are left as DFW after date fruit processing to produce date oil. One of the date oil industries located in Bogor, Indonesia and the industry left 1.4 tons DFW per day or 504 tons annually. Proximate analysis results in The Research Centre of Bioresources and Biotechnology of IPB (2014) indicated that DFW contained 16.96% dry matter, 1.28% crude fat, 9.71% crude protein, 16.48% crude fiber, 60.95% TDN and 68.71% NFE.
The research on the use of DFW in the dairy goat ration has not been conducted intensively; therefore its information is still limited. Our in vitro preliminary study on DFW utilization in dairy goat ration found the inclusion up to 20% DFW increased propionate propor-tion and dry matter digestibility linearly. These results need to be further investigated in vivo to study their direct effects on the livestock, especially on productivity and energy partition. This study was aimed to observe the effect of DFW utilization in the ration on energy partition and productivity of lactating dairy goats.
MATERIALS AND METHODS
Experimental Design
This experiment was carried out at CV. Cordero Farm Bogor Indonesia. Sample analysis were conducted at 1) Dairy Production Laboratory, Faculty of Animal Science IPB, 2) The Research Centre of Bioresources and Biotechnology of IPB, and 3) Laboratory of Animal Production, Indonesian Research Institute, Bogor. This study tested three rations (R0, R1, and R2) as treatments. Each treatment was repeated three times. The study used a randomized block design (RBD). The goats were grouped based on daily milk production. The rations consisted of 35% forage + 65% concentrate + 0% DFW (R0), 35% forage + 55% concentrate + 10% DFW (R1) and 35% forage + 45% concentrate + 20% DFW (R2).
Animal and Housing
This experiment used nine primiparous Ettawah crossbred (PE) lactating goats with 63 kg average body weight and 861 mL/head daily milk production. The goats were housed in 2 x 1.5 m2 individual cages which were made out of bamboo and wood. Temperatures and humidity around the housing area in the morning were 18.7-23.1oC and 99% and in the afternoon were 22.8-28.1oC and 79%-99%, respectively. Each cage was equipped with a feed bank and a drink bucket. The oth-er equipments used woth-ere digital scales with maximum capacity of 7 kg, analog scales with maximum capacity of 15 kg, and a volumetric flask.
Treatment Rations
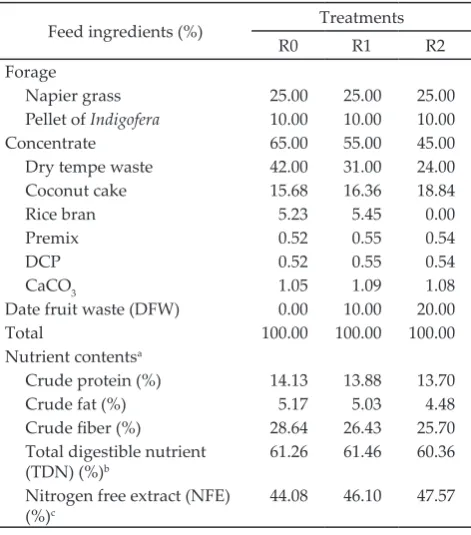
The ration consisted of 35% forage and 65% con-centrate (Table 1). The forage consisted of napier grass and pellet of Indigofera, and the concentrate was made out of dry tempe waste, coconut meal, rice bran, premix, DCP, and lime. The formulas were based on the needs of lactating goats in NRC (2007), i.e. 14% crude protein and 61% TDN. DFW was collected from Bogor, West Java, Indonesia. The rations were formulated iso-protein and iso-energy at different levels of DFW utilization.
Note:
R0= 0% DFW (control); R1= 10% DFW; R2= 20% DFW;
aLaboratory analysis results of Biological Resources and Biotechnology Bogor Agricultural University (2014);
bTDN is based on the formula of Hartadi et al. (1990), TDN= 37.937 - 1.018
Crude fiber – 4.886 Crude fat + 0.173 NFE + 1.042 Crude protein + 0.015 (Crude fiber)2 – 0.058(Crude fat)2 + 0.008 (Crude fiber) (NFE) + 0.119 (Crude fat) (NFE) + 0.038 (Crude fat) (Crude protein) + 0.0039 (Crude fat)2 (Crude protein);
cNFE is based on the formula NFE= 100 – Dry matter – Crude protein –
Crude fat – Crude fiber.
Table 1. Composition and nutrient content of treatment rations
Feed ingredients (%) Treatments
R0 R1 R2
Forage
Napier grass 25.00 25.00 25.00
Pellet of Indigofera 10.00 10.00 10.00
Concentrate 65.00 55.00 45.00
Dry tempe waste 42.00 31.00 24.00
Coconut cake 15.68 16.36 18.84
Rice bran 5.23 5.45 0.00
Premix 0.52 0.55 0.54
DCP 0.52 0.55 0.54
CaCO3 1.05 1.09 1.08
Date fruit waste (DFW) 0.00 10.00 20.00
Total 100.00 100.00 100.00
Nutrient contentsa
Crude protein (%) 14.13 13.88 13.70
Crude fat (%) 5.17 5.03 4.48
Crude fiber (%) 28.64 26.43 25.70
Total digestible nutrient (TDN) (%)b
61.26 61.46 60.36
Nitrogen free extract (NFE) (%)c
The goats were fed three times a day consisting of concentrate, DFW and forage. Concentrate was given at 06.30 am, DFW was given at 2.00 pm, and forage was given at 4.00 pm, while water was given ad libitum.
Energy Partition Analysis
Energy that was utilized in the animal’s body can be evaluated from the amount of nutrients intake and nutrients exreted. Energy intake (kcal/head/d) was calculated from the dry matter intake multiplied by
the Gross Energy (GE) of diets (kcal). Energy excreted
was measured from fecal and urine energy. Feed intake was measured; and feces and urine were collected dur-ing the last week of research for 6 d. Feed, feces, and urine energies were measured by using bomb calorim-eter. Fecal energy was calculated from fecal produced in dry matter multiplied by the energy of the feces. Measurement of urinary nitrogen (N-urine) was per-formed by using the Kjeldahl method, and the energy of urine was calculated from the amount of N-urine pro-duced (g) multiplied by the equivalent calorific value of N. Every 1 g of urinary nitrogen is equivalent to 34 KJ (Astuti et al., 2000). Digestible energy (DE) is the dif-ference between the energy intake and fecal energy. Metabolizable energy (ME) is the difference between the energy digested (DE) with the energy lost through methane gas and urine.
The amount of energy from methane gas produced is estimated by using the formula of Moss et al. (2000). Energy CH4 (mM)= 0.45C2 – 0.275C3 + 0.40C4 (C2= acetic acid; C3= propionic acid; C4= butyric acid). Acetic, propionic, and butyric acids were obtained by analyzing partial VFA (Volatile Fatty Acids) using a Gas
Chromatography (GC). VFA samples were measured
from the goat rumen fluid that was taken at the end of
the research. Rumen fluid was taken by using a
stom-ach tube connected to the reservoir tube and vacuum
pump. The stomach tube was inserted into the mouth of a goat to get into the rumen. The amount of rumen fluid taken from each goat was 10 mL. The fluid was put into a plastic bottle after measuring its pH. The bottle was immediately stored in a cooling box before storing in a freezer.
Concentrations of partial VFA obtained from GC are in mM (millimolar). These data needed to be converted into volume unit (liter) for obtaining the energy dissipation through methane. The energy wasted through methane gas reached up to 39.64 kJ or 9.45 kcal/L of methane gas (Brouwer, 1965). The conversion was done by using the ideal gas equation: P.V= n.R.T (P= pressure (2.041 atm); V= volume of methane (L); n= concentration of methane (mol); R= fixed gas constant (0.0821 L atm 1ºK/mol); T = temperature (523 ºK)).
Energy retention in milk was calculated by multi-plying the content of milk fat, milk protein, lactose (g) with the equivalent calorific value of those nutrients. Equivalent calorific value every gram of milk fat, milk protein, and lactose are 38.5 KJ (9.2015 kcal), 23.85 KJ (5.7001 kcal) and 16.74 KJ (4.0008 kcal) respectively (Garza et al., 1985; Mandel, et al., 2005).
Daily Milk Production, Milk Production Efficiency, and Quality of Milk Test
Milk production was measured daily during the study period. Lactating dairy goats were milked twice every morning and evening at 7 am and 4.30 pm. Milk that was produced was measured with a volumetric flask to determine the volume of production. The efficiency of milk production was calculated by the formula:
Milk production efficiency (%) = [Milk production (g)/ Dry matter intake (g)] x 100%
Milk samples that would be tested for its qual-ity were taken on the last day of the maintenance in the morning and afternoon. Samples of milk were taken as much as 10 mL for each goat. Milk quality was measured by using Milkotester (Lactoscan) at Dairy Production Laboratory, Faculty of Animal Science, Bogor Agricultural University. The quality of milk rep-resented from the tester included dry matter, fat, solid non-fat, protein, and lactose.
Statistical Analysis
Daily milk production and its efficiency were described descriptively, while milk quality and en-ergy partition were analyzed by ANOVA (Analysis of
Variance) to determine the effect of treatment on the
observed variables. Treatment that showed significant effect on the measured variables would be tested further using polynomial orthogonal test to obtain the response curve.
RESULTS AND DISCUSSION
Energy Partition
Energy is the common currency of life, as it fuels biological processes at every level of organization (Careau et al., 2008; Moore & Hopkins, 2009). Friggens
et al. (2013) stated that the nutrients obtained from an animal are channeled, or partitioned, in varying propor-tions to different physiological funcpropor-tions (milk, body reserves, reproduction, etc.). Distribution of energy utilization and its expenditure is termed as energy parti-tion. Energy partition as responses to DFW utilization in lactating dairy goat is presented in Table 2.
30 April 2016
accounting for as much as 80% of glucose produced in lactating cows (Allen et al., 2009). Increasing propionate concentration may lead to the increased plasma glucose concentration; cows with the greatest plasma glucose concentrations responded to propionate infusion with the greatest depression in feed intake (Bradford & Allen, 2007). Depression in DMI resulted in decreasing en-ergy intake since some nutrients intakes (carbohydrates, proteins, fats, vitamin, and mineral) were decreased. Carbohydrates (starch, cellulose, and hemicellulose) as the main source of energy for ruminant were contained in forage and concentrate. Ruminant animals digest cellulose via a symbiotic relationship with rumen micro-organisms (Russell et al., 2009). The starch, cellulose, and hemicellulose were digested into simple molecule of monosaccharide and later by micro-organism fermenta-tion in rumen this monosaccharide is used to produce volatile fatty acids (VFA). The products of rumen fermentation (VFA) were the main energy sources of
ruminant (Nafikov & Beitz, 2007; Alexander et al., 2008).
Furthermore, feed that has been consumed will be processed in the body of animal. Some feed fractions were not digested, metabolized or synthesized and were excreted in feces, urine, and methane gas. These excreta were the energy losses channels. The primary losses of
energy were through the indigestible energy fraction and excreted through feces. The results showed that energy losses through the feces were influenced by the treatments in quadratic models. Control (R0) showed the highest energy losses through feces (1629.14 kcal/ head/d), while utilization of 10% DFW (R1) showed the lowest energy losses (1089.57 kcal/head/d). The percentage of energy losses through feces compared to energy intake of R0, R1, and R2 were 31.65%, 24.31%, and 43.29%, respectively.
The energy value of energy intake after reduction by the energy losses through feces was named ingested energy or digestible energy. The results showed a linear decrease in digestible energy along with increasing DFW level. The digestion process of feed in ruminant occurs in the rumen (ruminal digestion) and post-rumen (intestinal digestion) (Huntington et al., 2006). Diet containing high concentrate could reduce the digest-ibility of the fiber due to the decrease in rumen pH that was caused by very fast fermentation process (Yang & Beauchemin, 2006). The decrease in pH to ≤ 6 can inhibit the action of cellulolytic microorganisms that causes the
decrease in the digestibility of fiber (Rustomo et al., 2006;
Newbold et al., 2005). Inclusion of DFW in the ration increased NFE component, a readily available nutrient in the rumen that could speed up the ruminal fermenta-tion process. The increased fermentafermenta-tion processes may lead to the increased availability of VFA that promotes the decrease in rumen pH and cause the inhibition for cellulolytic microbial activity (Mosoni et al., 2007).
Part of digested energy is not metabolized and uti-lized to fulfill animal requirement. The unused materials are excreted through urine and methane gas. The energy losses through urine showed a linear decrease along with the increase of DFW. Agle et al. (2010) stated that feed contained high crude protein or ruminal degrad-able protein (RDP) would cause high nitrogen losses through urine. The availability of RDP in the body was affected by the amount of RDP consumed. Although the rations in this experiment were formulated iso-protein, the lower DMI intakes in R1 and R2 caused lower pro-tein consumption. Therefore, nitrogen urine was also lower.
Table 2. Energy partition of rations containing dates fruit waste (DFW)
Variables Treatments
a
SEM Lb Qc
R0 R1 R2
Dry matter intake (kg/head/d) 1.67 1.48 1.21 0.09 * NS
Energy intake (kcal/head/d) 5178.37 4502.26 3677.59 279.35 * NS
Fecal energy (kcal/head/d) 1629.14 1089.57 1591.08 97.06 NS *
Digestible energy (kcal/head/d) 3549.23 3412.69 2086.51 290.49 * NS
Urine energy (kcal/head/d) 39.40 29.89 18.68 3.92 * NS
Energy in methane gas (kcal/head/d) 3.05 2.36 2.59 0.15 * **
Metabolizable energy (kcal/head/d) 3506.78 3380.43 2065.24 271.41 * NS
Energy in milk (kcal/head/d) 777.37 659.08 632.11 32.06 NS NS
Note: aR0= 0% DFW (control); R1= 10% DFW; R2= 20% DFW; bL= Linear effect of treatments (contrast orthogonal test); cQ= Quadratic effect of treatments
(contrast orthogonal test); *(P<0.05); **(P<0.01); NS= non-significant.
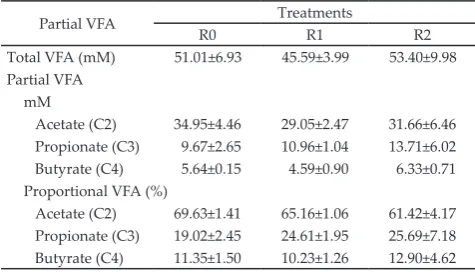
Table 3. Total and proportional VFA of rations containing dates fruit waste (DFW) in the rumen
Note: aR0= 0% date fruit waste (DFW) (control); R1= 10% DFW; R2= 20% DFW
Partial VFA Treatments
R0 R1 R2
Total VFA (mM) 51.01±6.93 45.59±3.99 53.40±9.98 Partial VFA
mM
Acetate (C2) 34.95±4.46 29.05±2.47 31.66±6.46 Propionate (C3) 9.67±2.65 10.96±1.04 13.71±6.02 Butyrate (C4) 5.64±0.15 4.59±0.90 6.33±0.71 Proportional VFA (%)
April 2016 31 The rate of fermentation of carbohydrates in the
feed organic material would greatly affect the amount of methane production (Jentsch etal., 2007). Methane is produced as a result of anaerobic fermentation of the soluble and structural carbohydrates by methanogens in the rumen of ruminant animals that represents a loss of approximately 7.22% of gross energy intake (Santoso et al., 2007).
VFA production and its molar proportion on this study are presented in Table 3. The DFW inclusions increase propionate concentration. Hosoda et al. (2005) stated that decreasing methane production in rumen is accompanied with an increase in propionate molar proportion. Inclusions of DFW in the ration showed a quadratic pattern of energy loss through methane. The highest energy losses through methane showed by R0 (3.05 kcal/head/d) and the lowest showed by R1 (2.36 kcal/head/d). CH4 produced by ruminants represents an energy loss to the animal (Ramin & Huhtanen, 2013).
Metabolizable energy decreased linearly along with the increasing level of DFW in the ration. Factors affecting feed metabolism of ruminant are energy losses in urine and methane (Nkrumah et al., 2006). This re-sponse decreased because energy intake and digestible energy also decreased, although energy losses through urine and methane gas were small.
The treatments did not show significant effect on the energy retention in milk. The percentage of energy in milk compared with energy intake of R0, R1, and R2 were 15.34%, 14.91%, and 17.30%, respectively. These results showed the amount of energy intake used by animals to produce milk. Inclusion of DFW showed non-significant effects as compared with the other treat-ments; however the percentage of 20% DFW showed the increase in energy retention.
Milk Production, Milk Production Efficiency and Quality of Milk
Milk production is the main purpose of dairy goat farming. The amount of milk produced and its quality are influenced mostly by the feed consumed. Daily milk production was observed for 36 d for all treatments. The amounts of milk production before treatments were
560-620 mL/head/d. Milk productions during observa-tion were fluctuating, but the amount of milk produced formed nearly specific patterns for all treatments.
R0 increased milk production by 24% on the last day (day 125 in lactation period) and R1 increased by 8%, while R2 showed the decrease by 18% (Figure 1). General lactation curve of Sarda dairy goat milk produc-tion according to Macciota et al. (2005) showed the peak lactation on day 45 to 55 and decreased until the end of period. Lactating dairy goats that were used in this study were 90th days in milk (mid lactation). Generally on this period, the milk production goes down. Milk production showed in Figure 1 had similar patterns of response in all treatments. R1 showed the highest yield on day 105 as well as R2; however the highest produc-tion of R2 occurred on day 111. DFW tended to show its ability to retard the decline of milk production. This effect is presumably related to the active compounds content of DFW such as flavonoids and phenol hydro-quinone. These compounds have some benefits for health, so it is able to support the optimal function of the digestive system. The other benefits of active com-pounds in date fruit are anti-inflammation, intestinal function protection, anti-cancer, and
immunostimula-tory effects (Baliga et al., 2011).
Milk production in lactating dairy goat is strongly influenced by the availability of glucose. Glucose is the limiting factor for the secretion of milk in the udder because it is a precursor of lactose synthesis which con-trols the movement of water into milk (Guinard-Flament
et al., 2006; Zhao & Keating, 2007). DFW has a high NFE
that can supply more glucose for lactose synthesis, so it will increase milk yield. This effect is thought to be the cause of the increased milk production of lactating dairy goats in their decline production period. Milk produc-tion efficiency is the percentage of milk producproduc-tion to dry matter intake.
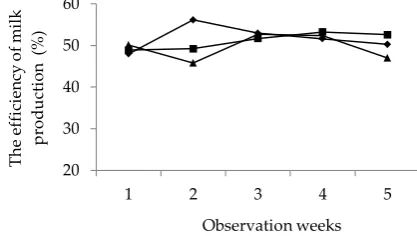
The efficiency of milk production in the first week was not much different among treatments (Figure 2). R1
showed the increase in production efficiency in the 2nd
until 4th weeks by 0.69%, 5.08%, and 2.96%, respectively, as compared to that in the 1st week. The pattern of effi-ciency on R2 showed a decrease in the 2nd and 4th weeks as compared with the 1st week by 8.57% and 0.66%, but
Figure 1. Daily milk production (mL/head/d) of dairy goats fed dates fruit waste (DFW) in the ration. Treatments R0 (-♦-)= 0% DFW (control); R1 (-■-) = 10% DFW; R2 (-▲ -)= 20% DFW.
Figure 2. The efficiency of milk production (%) of dairy goats
32 April 2016
it showed a dramatic increase in the 3rd week by 15.01%. The efficiency of milk production of R0 showed a dif-ferent pattern as compared to the other groups where it continued to decline from 3rd and 4th week. In the last week of the observation, the efficiency of milk produc-tion of R0, R1, and R2 decreased by 2.62%, 1.16%, and 10.19%, respectively, as compared with the 1st week.
R1 had milk production efficiency more stable than others. On the contrary, R2 showed a dramatically increase and decrease of its efficiency. The value of milk production efficiency indicated one of the advantages of DFW in influencing milk production. It can be suspected that the utilization of DFW up to 10% in the ration can influence the high efficiency of milk production in the long term.
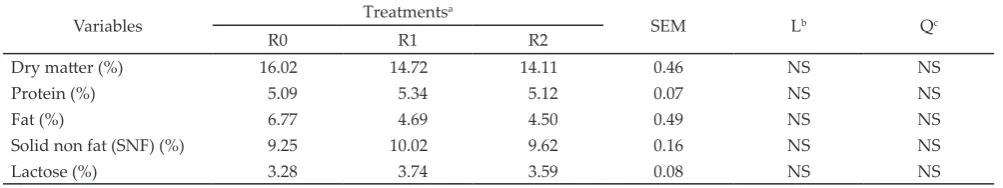
The utilization of DFW did not show a significantly different effect on milk quality (DM, protein, fat, SNF and lactose) (Table 4). Standard dairy goat milk qual-ity for a premium class according to Thai Agricultural Standard (2008) contains protein, fat, and dry matter more than 3.7%, 4%, and 13% respectively. The milk quality in this study contained high levels of protein, fat and dry matter that exceed those standards, i.e. 5.09%-5.12%, 4.5%-6.77%, and 14.11%-16.02%, respectively.
DFW supplementation in the ration did not statisti-cally affect milk fat content. The percentage of milk fat showed a considerable difference in values among the treatments where it showed the decline of percentage as the level of DFW in the ration increased. This could occur due to high NFE in DFW that produce higher pro-pionate to acetate ratio in the rumen. A higher propio-nate lead to increase the lactose content in milk because it was a precursor of lactose synthesis; however milk fat was synthesized more by acetate.
CONCLUSION
The use of 10% DFW showed the lowest energy loss through feces and methane gas of all treatments, it was about 1089.57 kcal/head/d and 2.36 kcal/head/d, respectively. DFW could not prevent the decline of milk production and not significantly affect milk quality. Based on the treatment results, it can be concluded that DFW up to 10% in the rations can be used as an alterna-tive feed for lactating dairy goats.
ACKNOWLEDGEMENT
The author would like to thank to Pusat Studi Biofarmaka IPB for facilitating this research. This re-search was funded by DIKTI through higher education operational cost (BOPTN) project 2014.
REFERENCES
Agle, M., A. N. Hristov, S. Zaman, C. Schneider, P. Ndegwa, & V. K. Vaddella. 2010. The effects of ruminally degraded
protein on rumen fermentation and ammonia losses from
manure in dairy cows. J. Dairy Sci. 93: 1625-1637. http:// dx.doi.org/10.3168/jds.2009-2579
Alexander, G., B. Sigh, A. Sahoo, & T. K. Bhat. 2008. In vitro
screening of plant extracts to enhance the efficiency of uti
-lization of energy and nitrogen in ruminant diets. Anim.
Feed. Sci. 145: 229-244. http://dx.doi.org/10.1016/j.anifeed
-sci.2007.05.036
Allen, M. S., B. J. Bradford, & M. Oba. 2009. The hepatic oxi-dation theory of the control of feed intake and its
applica-tion to ruminants. J. Anim. Sci. 87: 3317-3334. http://dx.doi. org/10.2527/jas.2009-1779
Astuti, D. A., D. Sastradipradja, & T. Sutardi. 2000. Nutrient balance and glucose metabolism of female growing, late
pregnant and lactating Ettawah crossbreed goats.
Asian-Australasian J. Anim. Sci. 13: 1068-1075.
Baliga, M. S., B. R. V. Baliga, S. M. Kandathil, H. P. Bhat, & P. K. Vayalil. 2011. A review of the chemistry and pharmacol-ogy of the date fruits (Phoenix dactylifera L). Food Research
International 44: 1812-1822. http://dx.doi.org/10.1016/j.
foodres.2010.07.004
Bradford, B. J., A. D. Gour, A. S. Nash, & M. S. Allen. 2006. Propionate challenge tests have limited value for investi-gating bovine metabolism. J. Nutr. 136: 1915-1920.
Bradford, B. J. & M. S. Allen. 2007. Depression in feed intake by a highly fermentable diet is related to plasma insulin concentration and insulin response to glucose infusion. J.
Dairy Sci. 90: 3838-3845.
http://dx.doi.org/10.3168/jds.2007-0086
Brouwer, E. 1965. Report of sub-committee on constant and fac -tor (in Energy Metabolism). EAAP Publ. 11: 441-443.
Careau, V., D. Thomas, M. M. Humphries, & D. Rèale. 2008. Energy metabolism and animal personality. Oikos 117:
641-653. http://dx.doi.org/10.1111/j.0030-1299.2008.16513.x
Friggens, N.C., L. Brun-Lafleur, P. Faverdin, D. Sauvant, & O. Martin. 2013. Advances in predicting nutrient partitioning in the dairy cow: recognizing the central role of genotype
and its expression through time. Animal 7: 89-101. http://
dx.doi.org/10.1017/S1751731111001820
Garza, C., N. F. Butte, & K. G. Dewey. 1985. Determination of
the energy content of human milk. In: Human Lactation I:
Variables Treatments
a
SEM Lb Qc
R0 R1 R2
Dry matter (%) 16.02 14.72 14.11 0.46 NS NS
Protein (%) 5.09 5.34 5.12 0.07 NS NS
Fat (%) 6.77 4.69 4.50 0.49 NS NS
Solid non fat (SNF) (%) 9.25 10.02 9.62 0.16 NS NS
Lactose (%) 3.28 3.74 3.59 0.08 NS NS
Table 4. Milk quality which was affected by the ration containing date fruit waste (DFW)
Note: aR0= 0% DFW (control); R1= 10% DFW; R2= 20% DFW; bL= Linear effect of treatments (contrast orthogonal test); cQ= Quadratic effect of treatments
Milk Component and Methodologies. Editor: Jensen RG, Neville MC. Plenum Press, New York.
Guinard-Flament, J., E. Delamaire, S. Lemosquet, M. Boutin-aud, & Y. David. 2006. Changes in mammary uptake and metabolic fate of glucose with once-daily milking and feed restriction in dairy cows. Reprod. Nutr. Dev. 5: 589-598.
http://dx.doi.org/10.1051/rnd:2006030
Hartadi, H., S. Reksohadiprojo, & A. D. Tilman. 1990. Tabel Komposisi Pakan untuk Indonesia. UGM Press, Yogya-karta.
Hasan, F., Jakaria, & A. Gunawan. 2014. Genetic and
phenotyp-ic parameters of body weight in Ettaw grade goats. Med. Pet. 37: 8-16. http://dx.doi.org/10.5398/medpet.2014.37.1.8
Hosoda, K., T. Nishida, W. Y. Park, & B. Eruden. 2005. Influ -ence of Menthaxpiperita L. (peppermint) supplementation on nutrient digestibility and energy metabolism in lactat-ing dairy cow. Asian-Australasian J. Anim. Sci. 18: 1721-1726.
Huntington, G. B., D. L. Harmon, & C. J. Richards. 2006. Sites, rates, and limits of starch difestion and glucose
metabo-lism in growing cattle. J. Anim. Sci. 84: E14-E24.
Jentsch, W., M. Schweigel, F. Weissbach, H. Scholze, W. Pitroff, & M. Derno. 2007. Methane production in cattle calculated
by nutrient composition of the diet. Arch. Anim. Nutr. 61:
10-19. http://dx.doi.org/10.1080/17450390601106580
Macciota, N. P. P., P. Fresi, G. Usai, & A. Cappio–Borlino.
2005. Lactation curves of Sarda breed goats estimated with
test day models. J. Dairy Res. 72: 470-475. http://dx.doi.
org/10.1017/S0022029905001366
Mandel, D., R. Lubetzky, S. Dollberg, S. Barak, & F. B. Mi
-mouni. 2005. Fat and energy contents of expressed human breast milk in prolonged lactation. Pediatric 116: 432-435.
http://dx.doi.org/10.1542/peds.2005-0313
Moore, I. T. & W. A. Hopkins. 2009. Interaction and trade-offs
among physiological determinants of performance and
re-productive success. Integr. Comp. Biol. 49: 441-451. http://
dx.doi.org/10.1093/icb/icp081
Mosoni, P., F. Chaucheyras-Durand, C. Bera-Mailet, & E. Fo-rano. 2007. Quantification by real-time PCR of cellulolytic
bacteria in the rumen of sheep after supplementation of a forage diet with readily fermentable carbohydrates: ef-fect of a yeast additive. J. Appl. Microbiol. 103: 2676-2685.
http://dx.doi.org/10.1111/j.1365-2672.2007.03517.x
Moss, A. R., J. P. Jouany, & J. Newbold. 2000. Methane pro-duction by ruminants: its contribution to global warming.
Ann. Zootech. 49: 231-253. http://dx.doi.org/10.1051/an
-imres:2000119
Nafikov, R. A. & D. C. Beitz. 2007. Carbohydrate and lipid
me-tabolism in farm animals. J. Nutr. 137: 702-705.
Newbold, C. J., S. Lopez, N. Nelson, J. O. Ouda, R. J. Wal-lace, & A. R. Moss. 2005. Propionate precursors and other metabolic intermediates as possible alternative electron acceptors to methanogenesis in ruminal fermentation
in vitro. Brit. J. Nutr. 94: 27-35. http://dx.doi.org/10.1079/
BJN20051445
Novita, C. I., A. Sudono, L. K. Sutama, & T. Toharmat. 2006.
Produktivitas kambing Peranakan Ettawah yang diberi ransum bebasis jerami padi fermentasi. Med. Pet. 29:
96-106.
NRC. 2007. Nutrient Requirements of Small Ruminants. Sheep,
Goats,Cervids, and New World Camelids. Nat. Acad. Press, Washington DC.
Nkrumah, J. D., E. K. Okine, G. W. Mathison, K. Schmid, C. Li, J. A. Basarab, M. A. Price, Z. Wang, & S. S. Moore. 2006.
Relationship of feedlot feed efficiency, performance, and
feeding behavior with metabolic rate, methane
produc-tion, and energy partitioning in beef cattle. J. Anim. Sci.
84: 145-153.
Ramadhan, B. G., T. H. Suprayogi, & A. Sustiyah. 2013. Tampi-lan produksi susu dan kadar lemak susu kambing
Per-anakan Ettawa akibat pemberian pakan dengan imbangan hijauan dan konsentrat yang berbeda. Animal Agriculture
Journal 1: 354-363.
Ramin, M. & P. Huhtanen. 2013. Development of equation for
predicting methane emmissions from ruminant. J. Dairy
Sci. 96: 2476-2493. http://dx.doi.org/10.3168/jds.2012-6095
Rinaldi, L., V. Veneziano, & G. Cringoli. 2007. Dairy goat pro-duction and the importance of gastrointestinal strongyle
parasitism. T. Roy. Soc. Trop. Med. H. 101: 745-746. http:// dx.doi.org/10.1016/j.trstmh.2007.03.010
Russell, J. B., R. E. Muck, & P. J. Weimer. 2009. Quantitative analysis of cellulose degradation and growth of cellulolyt-ic bacteria in the rumen. FEMS Mcellulolyt-icrobiology Ecology 67:
183-197. http://dx.doi.org/10.1111/j.1574-6941.2008.00633.x
Rustomo, B., O. AlZahal, J. P. Cant, M. Z. Fan, T. F. Duffield, N. E. Odongo, & B. W. McBride. 2006. Acidogenic value
of feeds. II. Effects of rumen acid load from feeds on dry matter intake, ruminal pH, fibre degradability and milk
production in the lactating dairy cow. Can. J. Anim. Sci. 86: 119-125
Santoso, B., B. Mwenya, C. Sar, & J. Takahashi. 2007. Methane production and energy partition in sheep fed timothy si-lage or hay-based diets. JITV 12: 27-33.
Sodiq, A. 2012. Non genetic factors affecting pre-weaning
weight and growth rate of ssettawah grade goats. Med. Pet 35: 21-27. http://dx.doi.org/10.5398/medpet.2012.35.1.21
Souhoka, D. F., M. J. Matatula, W. M. M. Nalley, & M. Rizal.
2009. Laktosa mempertahankan daya hidup spermatozoa kambing Peranakan Etawah yang dipreservasi dengan plasma semen domba priangan. Jurnal Veteriner 10: 135-142.
Sukarini, I. A. M. 2006. Produksi dan komposisi air susu kamb-ing Peranakan Etawah yang diberi tambahan konsentrat
pada awal laktasi. Majalah Ilmiah Peternakan 9: 1-12.
Sutama, I. K. 2008. Pemanfaatan sumberdaya ternak lokal seb-agai ternak perah mendukung peningkatan produksi susu nasional. Wartazoa 18: 207-217.
Thai Agricultural Standard. 2008. Raw Goat Milk. National Bureau of Agricultural Commodity and Food Standards. Ministry of Agriculture and Cooperatives, Thailand.
Toharmat, T., N. Hotimah, E. Nursasih, R. Nazilah, T. Q. No-erzihad, N. A. Sigit, & Y. Retnani. 2007. Status Cad an
Zn pada kambing Peranakan Ettawah muda yang diberi
ransum bentuk mash dengan pakan sumber serat berbeda. Med. Pet. 30: 71-78.
Yang, W. Z. & K. A. Beauchemin. 2006. Effects of physically ef
-fective fiber on chewing activity and ruminal pH of dairy
cows fed diets based on barley silage. J. Dairy. Sci. 89:
217-228. http://dx.doi.org/10.3168/jds.s0022-0302(06)72086-0
Zhao, F. Q. & A. F. Keating. 2007. Expression and regulation of glucose transporters in the bovine mammry gland. J. Dairy